Soil erosion affects many sectors including agri-culture and water management and thus remains a big problem in the Czech Republic. Krása (2010) states that ca 50% of the agricultural land in the Czech Republic is at risk. Soil degradation by water erosion is a complex process which depends on many factors (Cerdan et al. 2002), and is also very site dependent, mainly due to differences in climate and agronomic practices (Romero 1998). It is commonly agreed (Durán et al. 2008) that vegetation cover plays a very important role in soil erosion control and is the single factor with the highest relevance for human interaction (Stocking 1994). Plants protect the soil in various ways: (i) leaves hinder raindrops, and thus mitigate their kinetic impact on the soil surface (Styczen and Morgan 1995); (ii) roots support preferential flow in the soil profile, which improves the infiltration conditions (Bronick and Lal 2005), and (iii) stems slow down the overland flow by increasing the
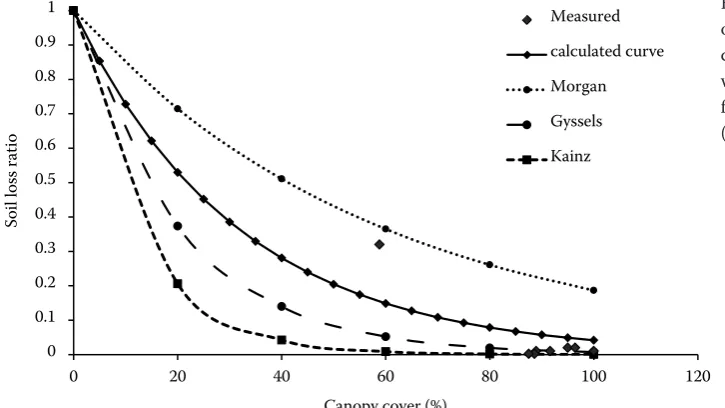
roughness which also supports infiltration (Styczen and Morgan 1995). Moreover, roots are one of the key factors affecting the stability of aggregates, even in the early stages of crop growth (De Baets and Poesen 2010). General relationships were developed to link the decrease of soil erosion and runoff production with increasing vegetation cover (Gyssels et al. 2005). The relationship is usually described by the following equation:
SLr = e–b × CC
Where: SLr – soil loss ratio; b – constant; CC – canopy cover.
Only one of 13 relationships published by Gyssels et al. (2005) is related to cultivated land for sugar beets (Kainz 1989). The others are related to per-manent grassland. Some of these curves are shown in Figure 1. Canopy cover (CC) is one of the most frequently applied parameters in simulation models and in empirical methods for describing the actual state of the vegetation in the field (Laliberte et
Determining the protective effect of agricultural crops
on the soil erosion process using a field rainfall simulator
T. Davidová
1, T. Dostál
1, V. David
1, P. Strauss
21
Department of Irrigation, Drainage and Landscape Engineering, Faculty of Civil
Engineering, Czech Technical University in Prague, Prague, Czech Republic
2
Institute for Land and Water Management Research, Federal Agency for Water
Management, Petzenkirchen, Austria
ABSTRACT
In this paper the data measured by application of the MDS NZ2 field rainfall simulator have been used to demon-strate the effect of vegetation cover on surface runoff generation and soil loss. The results of 15 experiments for two crops (oats and wheat) are presented. Canopy cover and the leaf area index are used to describe the vegeta-tion development. Measured soil loss decreased with growing vegetavegeta-tion significantly from the maximum values 74.7 g/min for oats (38.4 g/min for wheat) to 0.4 g/min (1.5 g/min respectively) from the experimental plot of 16 m2. Thus, this work clearly demonstrates the positive effect of canopy development on soil loss. However, the
ef-fect of the developing cover on the surface runoff generation was not significant.
Keywords: water erosion; soil detachment; soil loss ration; vegetative cover; LAI
al. 2007). CC describes the proportion of the soil surface that is covered by the vertical projection of plants (Jennings et al. 1999). It is also used for setting the C factor values in the universal soil loss equation – USLE (Wischmeier and Smith 1978). In this case, the crop stage periods are defined according to the canopy cover. In the revised universal soil loss equation (Renard et al. 1997), CC is defined as an individual subfactor. Another parameter which provides information about the vegetation structure is the leaf area index – LAI (Watson 1947). LAI is defined as the total one-sided area of leaves above a unit area of the soil surface. These two parameters were used to describe the temporal sequence of vegetation development for the purposes of the analyses presented in this paper.
The aim of the presented research consists of the assessment of the vegetation protective effect with respect to soil erosion and surface runoff by experiments carried out using rainfall simulation. Generally, this effect is known and has been pub-lished by a number of authors (Wischmeier and Smith 1978, Kaspar et al. 2001, Blanco and Lal 2008, Ruiz-Colmenero et al. 2012). It is assumed that the intensity of soil erosion and surface runoff decreases with increasing vegetation cover. We used rainfall simulation experiments to confirm this assumption by experimental data. The ap-plication of rainfall simulation for the mentioned purpose in the conditions of the Czech Republic has not been published, yet.
MATERIAL AND METHODS
Experimental site. The study area is located in the Central Bohemia Region (49°46'55''N, 14°49'48''E). The climate is moderately warm, with a mean annual temperature of 7.7°C and mean annual rainfall of 596 mm. The soil at the experi-mental site is classified as Cambisol according to FAO. Soil texture is loamy sand according to the classification of Novák published by Kutílek (1978).
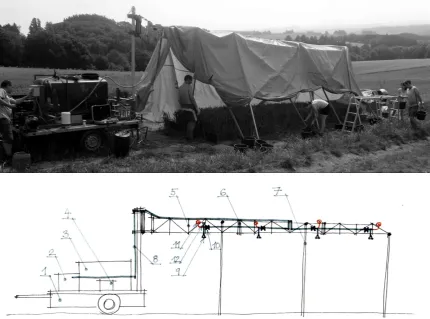
Rainfall simulator. The rainfall simulator used for the simulations is built on a trailer transport-able by car. Its structure is shown in Figure 2.
The height of the nozzles was set to 2.6 m above the sprayed surface. Four nozzles (Spraying Systems, ½ HH – 40 WSQ FullJet, Wheaton, USA) were used with independent operation. Each nozzle is equipped with a manometer for pressure control, which is an important parameter affecting the drop size distri-bution (Abudi et al. 2012). The median drop size (d50) for the nozzle type used here is 1.5–2.0 mm at a pressure of 80 MPa. The spraying homogene-ity measured by Christiansen’s uniformhomogene-ity coef-ficient – CU (Christiansen 1942) varies slightly around 86%. The rainfall intensity is controlled by the nozzle valves driven by the programmable unit. The intensities used for the simulations were 40 mm/h in 2012, and 70 mm/h in 2013. Simulations were run until the runoff reached a steady state which was usually after 40 min. Simulations were carried out from April to harvest. Simulated rainfall intensity was chosen with respect to water avail-0
0.1 0.2 0.3 0.4 0.5 0.6 0.7 0.8 0.9 1
0 20 40 60 80 100 120
Soi
l l
os
s ra
tio
Canopy cover (%)
[image:2.595.63.426.99.303.2]Measured calculated curve Morgan Gyssels Kainz
ability and the technical limits of the simulator. The aim was to simulate extreme storm events which can occur in the area of interest.
Field experiments. The experimental plots are 8 m in length and 2 m in width. The slope of the plots used for the experiments was approximately 9% as documented for standard USLE plots (Wischmeier and Smith 1978). The experiments were always car-ried out on both plots, with the crop and clean-tilled continuous fallow plots prepared according to the methodology defined by the standard (ASTM D 6459 2007). In 2012, oats (cv. Vok) sown by no-tillage technology after stubble breaking and deep loosening was examined. In 2013, winter wheat (cv. Rapsodia) sown after standard tillage was examined.
Measurements of runoff and soil erosion. We measured surface runoff and suspended solids in each experiment. The surface runoff was col-lected in a container at constant time intervals and was weighed immediately. In each interval, 0.5 L
of runoff was sampled for laboratory analysis of suspended solids.
Measurements of vegetation and soil condi-tions. In order to define the conditions of each experiment correctly, the initial soil moisture and the characteristics of the development of the vegetation CC and LAI were measured.
CC was used especially during the initial phases of vegetation development, when LAI could not be measured using a LAI meter. In this case, CC was determined using optical capturing of the surface from above, followed by classifying the taken photos. The weakness of this parameter lies in the fact that it does not take into account the vertical structure and the density of vegetation.
[image:3.595.81.512.100.419.2]LAI was historically measured by a destructive method, in which all plants from a known area are gathered and the total leaf area is measured using a planimeter. We used optical measurements provided by a LAI2000 plant canopy analyzer
(Lincoln, USA). The values collected by this device were validated by a destructive method.
Soil moisture was determined at the beginning and at the end of each experiment by taking un-disturbed soil samples (in total 4 samples for each plot) from the experimental site. The soil samples were taken 5 cm under the surface. Volumetric soil moisture content was then measured in the laboratory by a gravimetric method.
Statistical analysis. In order to assess the im-portance of all considered parameters, a linear additive model was built for various combina-tions of independent variables. The model was parameterized using the least squares method, and the significance of each parameter was assessed by the two-tailed Student’s t-test, considering a significance level of α = 0.05 for various combina-tions of parameters.
RESULTS AND DISCUSSION
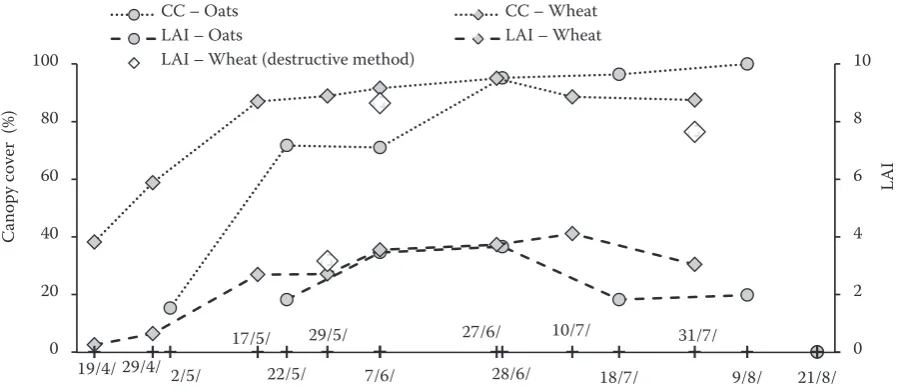
The temporal development of the vegetation-related characteristics used in this study is pre-sented in Figure 3. The increase in the CC and the LAI values was rapid during the initial stages of crop growth in both years. Then it became slower between June and August, and there was a much slower increase, or the values even decreased, mainly due to ripening of the crops and shrink-age of the vegetation. In addition, the values of LAI measured optically decrease with the loss of
chlorophyll and with changing color, though the leaf area generally remains the same and so the interception characteristics are also almost con-stant. According to Wilhelm et al. (2000), optical methods for determining LAI are unreliable at higher values and the results that they produce are undervalued, as was confirmed by our mea-surements. Due to the unreliability of determin-ing LAI usdetermin-ing optical measurements in summer periods, LAI was also measured three times by a destructive method. The values for LAI obtained using this method are shown in Figure 3. These are much higher than the values measured using the LAI2000 (for ca 30–120%), which confirmed the assumptions mentioned above. The simulation on August 21, 2012, was carried out on the plot after the harvest with the remaining stubble. This simulation was excluded from further evaluation.
[image:4.595.73.522.536.731.2]Vegetation cover versus soil detachment and runoff. The effect of vegetation on surface runoff was first assessed using the runoff coefficient (RC), calculated as the ratio between the total runoff volume and the total precipitated volume over the simulation. Tables 1 and 2 show the overall trend of a decreasing runoff coefficient with growing vegetation. This trend is disturbed by the values achieved during the rainfall simulation carried out on July 27, 2013, which show higher runoff coefficient values. The reason for this is most likely the high initial soil moisture content value of 33.4%, which initiated high surface runoff due to reduced infiltration capacity. The first simulations
Figure 3. Course of oats and wheat growth described by canopy cover (CC) and leaf area index (LAI)
19/4/ 29/4/
17/5/ 29/5/ 27/6/ 10/7/ 31/7/
2/5/ 22/5/ 7/6/ 28/6/ 18/7/ 9/8/ 21/8/
0 2 4 6 8 10
0 20 40 60 80 100
LA
I
C
an
op
y
co
ve
r
(%)
CC – Oats CC – Wheat
LAI – Oats LAI – Wheat
were strongly affected by the loosened soil surface, which therefore had high infiltration capacity.
The comparison of the last two simulations carried out in 2012 (August 9 and 21) on a vegetated plot and on a plot with stubble shows a slight decrease in the runoff coefficient from 0.13–0.10 while the initial soil moisture content was 30.1% on August 9, 2012 and 24.9% on August 21, 2012. The decline of the runoff coefficient is most likely caused by in-creased infiltration due to lower initial soil moisture and the crop residues slowing down overland flow. This is also in agreement with the assumption of low influence of interception on the runoff in the case of precipitations with high intensities.
One of the most important results is the confir-mation of the assumption that the protective effect of vegetation increases with its growth. This is clearly demonstrated by the average soil loss values (SL) on vegetated plots, which decrease continually
from the maximum values achieved in the second simulation in both years. The value of SL was cal-culated as an average value of soil loss during the experiment. These maximum values were 74 and 38 g/min, respectively, which decreased to values of about 1 g/min in the high vegetation season. The lower soil loss values corresponding to the first simulations are affected by high infiltration, related to the seed-bed conditions and therefore a loosened soil surface. Indeed, this trend can be demonstrated by the soil loss ratio values (SLR, the ratio of the soil loss on a vegetated plot to the soil loss on a fallow plot, defined by Renard et al. 1997). The values of SLR calculated at 40 min after the beginning of the simulation were used to demonstrate the protective effect of vegetation cover on soil loss (Figure 1).
[image:5.595.66.532.126.281.2]The calculated t-values and P-values are shown in Table 3. The analysis of our results showed a
Table 1. Basic parameters of the simulations in 2012: Rainfall intensity (RF, mm/h); initial soil moisture (SM, %); runoff coefficient (RC); average soil loss (SL, g/min), and soil loss ratio (SLR)
2.5. 22.5. 7.6. 28.6. 18.7. 9.8. 21.8.
RF 34 75 38 56 39 39 42
SMvegetated 18.1 16.0 18.0 9.8 27.1 30.1 24.9
SMfallow * * 21.4 18.1 29.4 27.7 26.1
RCvegetated 0.14 0.41 0.32 0.38 0.38 0.13 0.10
RCfallow * * 0.18 0.36 0.50 0.35 0.48
SLvegetated 23.3 74.4 11.3 5.1 2.0 0.4 1.1
SLfallow * * 18 173 125 48 88
SLR – – – 0.01 0.02 0.01 –
*not measured
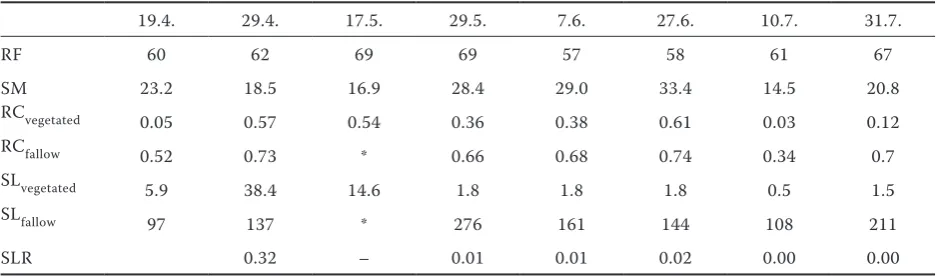
Table 2. Basic parameters of the simulations in 2013: Rainfall intensity (RF, mm/h); initial soil moisture (SM, %); runoff coefficient (RC); average soil loss (SLR, g/min), and soil loss ratio (SLR)
19.4. 29.4. 17.5. 29.5. 7.6. 27.6. 10.7. 31.7.
RF 60 62 69 69 57 58 61 67
SM 23.2 18.5 16.9 28.4 29.0 33.4 14.5 20.8
RCvegetated 0.05 0.57 0.54 0.36 0.38 0.61 0.03 0.12
RCfallow 0.52 0.73 * 0.66 0.68 0.74 0.34 0.7
SLvegetated 5.9 38.4 14.6 1.8 1.8 1.8 0.5 1.5
SLfallow 97 137 * 276 161 144 108 211
SLR 0.32 – 0.01 0.01 0.02 0.00 0.00
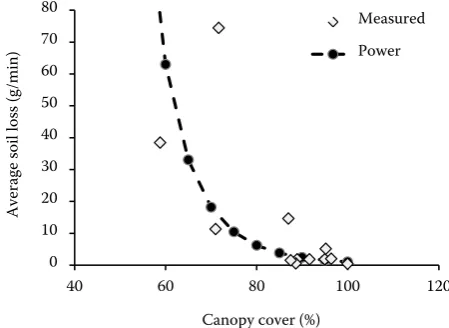
[image:5.595.63.532.603.742.2]significant interaction (P < 0.01) between average soil loss and canopy cover. The results follow the expected shape, which is based on the assumption that soil loss decreases as the value of CC increases (Figure 4). The dependence of SL on all the other parameters considered here, and that of RC on all the variables considered here, was not confirmed by the analysis of the available measured data.
Figure 1 shows the dependence of measured SLR values on CC compared to those published by other authors (Kainz 1989, Morgan et al. 1998, Gyssels et al. 2005). Measured values do not fit well on any single curve of those used for comparison. However, the curve fitted to the measured data lies between them and the assumption of decreasing soil loss with growth of vegetation was also confirmed.
[image:6.595.63.288.560.724.2]The value of b for the fitted curve is 0.032 which corresponds to R2 = 0.52. The values of SLR mea-sured in both summer periods are very low, which
Table 3. Student t-values for the parameters considered here and for various combinations of parameters
α = 0.05, tα/2
n – k Average soil loss (g/min) Runoff coefficient
Combination of parameters t-stat P-value t-stat P-value
CC (tα/2
n – k = 2.2) CC –3.19 0.0096 –0.98 0.35
CC/SM (tα/2
n – k = 2.23)
CC –2.61 0.03 –1.28 0.23
SM –0.38 0.71 0.93 0.38
CC/SM/RF (tα/2
n – k = 2.26)
CC –2.39 0.04 –1.10 0.30
SM –0.17 0.87 0.99 0.35
RF 1.12 0.30 0.58 0.58
SM (tα/2
n – k = 2.2) SM –1.30 0.22 0.42 0.68
CC – canopy cover; SM – soil moisture; RF – rainfall intensity
indicates very good protective effect of oats and wheat during this period in which the most dan-gerous rainstorms from the point of view of soil erosion usually occur. The main aim of the pre-sented research consisted in the assessment of the applicability of a new rainfall simulator for the purposes of quantifying the vegetation protective effect with respect to soil erosion in the condi-tions of the Czech Republic. The data measured and evaluated demonstrate the strong effect of vegetation and fit with the results of other similar research. It will be necessary to perform a number of simulations within the continuing research to have a wider database for statistical evaluation which would provide more significant values.
REFERENCES
Abudi I., Carmi G., Berliner P. (2012): Rainfall simulator for field runoff studies. Journal of Hydrology, 454–455: 76–81. ASTM (2007): Standard Test Method for Determination of Rolled
Erosion Control Product (RECP) Performance in Protecting Hillslopes from Rainfall-Induced Erosion. D 6459-07. West Conshohocken, American Society of Testing and Materials. Blanco H., Lal R. (2008): Principles of Soil Conservation and
Management. New York, Springer.
Bronick C.J., Lal R. (2005): Soil structure and management: A review. Geoderma, 124: 3–22.
Cerdan O., Le Bissonnais Y., Couturier A., Saby N. (2002): Model-ling interrill erosion in small cultivated catchments. Hydrologi-cal Processes, 16: 3215–3226.
De Baets S., Poesen J. (2010): Empirical models for predicting the erosion-reducing effects of plant roots during concentrated flow erosion. Geomorphology, 118: 425–432.
0 10 20 30 40 50 60 70 80
40 60 80 100 120
A
ve
ra
ge
so
il
lo
ss (
g/
m
in)
Canopy cover (%)
Measured Power
Durán Zuazo V.H., Rodríguez Pleguezuelo C.R. (2008): Soil-erosion and runoff prevention by plant covers. A Review. Agronomy for Sustainable Development, 28: 65–86.
Gyssels G., Poesen J., Bochet E., Li Y. (2005): Impact of plant roots on the resistance of soils to erosion by water: A review. Progress in Physical Geography, 29: 189–217.
Christiansen J.E. (1942): Irrigation by sprinkling. University of California Agricultural Experiment Station, Bulletin, 670: 124. Jennings S.B., Brown N.D., Sheil D. (1999): Assessing forest
canopies and understorey illumination: Canopy closure, canopy cover and other measures. Forestry, 72: 59–74.
Kainz M. (1989): Runoff, erosion and sugar beet yields in conven-tional and mulched cultivation results of the 1988 experiment. Soil Technology Series, 1: 103–114.
Kaspar T.C., Radke J.K., Laflen J.M. (2001): Small grain cover crops and wheel traffic effects on infiltration, runoff, and erosion. Journal of Soil and Water Conservation, 56: 160–164. Krása J. (2010): Empirical models of water erosion in the Czech
Republic – Tools, data, options and calculation risks. Habilita-tion thesis. Prague. CTU Prague, Faculty of Civil Engineering, 159. (In Czech)
Kutílek M. (1978): Hydropedology. Prague, SNTL, ALFA, 295. (In Czech)
Laliberte A.S., Rango A., Herrick J.E., Fredrickson E.L., Burkett L. (2007): An object-based image analysis approach for de-termining fractional cover of senescent and green vegetation with digital plot photography. Journal of Arid Environments, 69: 1–14.
Morgan R.P.C., Quinton J.N., Smith R.E., Govers G., Poesen J.W.A., Auerswald K., Chisci G., Torri D., Styczen M.E. (1998): The
European soil erosion model (EUROSEM): A dynamic approach for predicting sediment transport from fields and small catch-ments. Earth Surface Processes and Landforms, 23: 527–544. Renard K.G., Foster G.R., Weesies G.A., McCool D.K., Yoder
D.C. (1997): Predicting Soil Erosion by Water: A Guide to Conservation Planning with the Revised Universal Soil Loss Equation (RUSLE). USDA AH 703. Washington, US Govern-ment Printing Office.
Romero L.R. (1998): Olive farming in the age of science and in-novation. Olivae, 72: 42–51.
Ruiz-Colmenero M., Bienes R., Eldridge D.J., Marques M.J. (2012): Vegetation cover reduces erosion and enhances soil organic carbon in a vineyard in central Spain. Catena, 104: 153–160. Stocking M.A. (1994): Vegetative Cover and Management
Ef-fects. Soil Erosion: Research Methods. Ankeny, Soil and Water Conservation Society, 211–232.
Styczen M.E., Morgan R.P.C. (1995): Engineering properties of vegetation. In: Morgan R.P.C., Rickson R.J. (eds): Slope Sta-bilization and Erosion Control: A Bioengineering Approach. London, E&FN SPON, 5–58.
Watson D.J. (1947): Comparative physiological studies on the growth of field crops: I. Variation in net assimilation rate and leaf area between species and varieties, and within and between years. Annals of Botany, 11: 41–76.
Wilhelm W., Ruwe K., Schlemmer M.R. (2000): Comparison of Three Leaf Area Index Meters in a Corn Canopy. Lincoln, U.S. Department of Agriculture: Agricultural Research Service. Wischmeier W.H., Smith D.D. (1978): Predicting rainfall erosion
losses: A guide to conservation planning. Washington, U.S. Department of Agriculture.
Received on November 19, 2014 Accepted on February 16, 2015
Corresponding author: