When thermally treating liquid viscous products in the pasteurisation equipment, it is necessary to maintain the determined temperature and the holding time, if possible, for all particles of the product as stated by LIN (1979) and SCALZO et al. (1969). An ideal situation is to maintain the piston flow where the residence time is the same for all particles (MURIANA et al. 1996). Due to the viscosity of the flowing liquid food products, this is, however, not possible because a parabolic velocity profile is usually created with a maximum velocity in the central line of the tubes as mentioned by PUNIDADAS and MCKELLAR (1999). In this case, the residence time of the central parti-cles is the shortest, while, on the contrary, partiparti-cles in the side parts of the tubes have, theoretically, the infinite resi-dence time (VERKAMP et al. 1974). In the specific case of the pasteurisation of egg yolks, there is, in addition, a dan-ger of denaturation, coagulation, and sedimentation of the lipo-protein components present.
This work is aimed at assessing, especially by the use of experimental methods, the distribution of the residence time
in the heating and holding parts of a continuous flow pas-teurisation equipment during the paspas-teurisation of egg yolks.
MATERIAL AND METHODS
The experiments were performed using a pasteurisation equipment Sanovo Engineering, Denmark, equipped with a plate exchanger APV 1.01 with plates having the exter-nal dimensions of 410 × 1145 mm and the thickness of 0.7 mm. The heating section was equipped with 89 plates of 381 mm pitch, a regeneration section with 129 plates of 554 mm pitch, and a cooling section with 97 plates of 412 mm pitch. After the deduction of the marginal plate and of one plate thickness, the thickness of the channel slot is calculated approx. as 3.6 mm. The active surface of one plate is not known, it can be estimated at the dimensions of 360 × 880 mm. We assume the flow of the product in the plate exchanger always through two par-allel channels.
Residence Time Distribution during Egg Yolk Pasteurisation
ALEŠ LANDFELD1, RUDOLF ŽITNÝ2, MILAN HOUŠKA1, KAREL KÝHOS1and PAVLA NOVOTNÁ1
1Food Research Institute Prague, Prague, Czech Republic; 2Faculty of Mechanical Engineering,
Czech Technical University Prague, Prague, Czech Republic
Abstract
LANDFELD A., ŽITNÝ R., HOUŠKA M., KÝHOS K., NOVOTNÁ P. (2002): Residence time distribution during egg yolk pasteurisation. Czech J. Food Sci., 20: 193–201.
This work describes the determination of the average residence times during egg yolk – and whole liquid eggs pasteurisation in an industrial pasteurisation equipment (plate pasteuriser + tube holder). For the detection of the impulse the conductivity method was used. Conductivity was then monitored using the bridge method. In the system, the total of 3 probes were placed. To mark the particles of the flowing product, salted yolk with the content of salt of 1.3 or 1.8% was used. In addition, rheological properties of pasteurised yolk were determined at the temperatures of 5, 25, 45, and 65°C. Based on the geometry of the channels in the individual sections of the pasteurisation equipment, the character of the flow was estimated using the Re criterion and was found to be laminar in all parts of the system. The work includes the comparison of the average residence times obtained by (a) the method of volumes, (b) the analysis of the conductivity response, (c) the estimate made by using the TUPLEX software, and (d) the estimate of the peaks of the conductivity response.
Keywords: residence time; pasteurisation; egg yolks; tube flow
p u m p h old er
P rob e 3
th erm o m e ter
P rob e 2 h eat exch a n ger
flo w m eter
P rob e 1
p rod u ct p u m p p rod u ct in let
cooler regeneration heater tan k
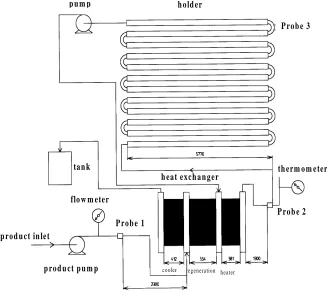
The scheme of the measured part of the line is included in Fig. 1. The product is pumped with a screw pump from the reserve tank through a flowmeter. The inlet of the prod-uct is in the regeneration part of the plate exchanger where it is pre-heated by passing the pasteurised product leav-ing the holder, it proceeds into the heatleav-ing part where the process of its heating to the pasteurisation temperature of 66°C is completed. We estimate the temperature of the heat-ing water as 68°C. The product then proceeds through a tube DN 50 of the total length of 7.07 m into the holder. The holder for yolks consists of 12 pieces of thermally insulated tubes DN 65 of the length of 6.06 m, and of 11 pieces of transfer bends of 180° of the length of 0.32 m (11 × 0.32 = 3.52 m). The decrease in the average tempera-ture of the product in the holder can be estimated as 2°C.
The distribution of the residence time was measured by the conductivity method. In the equipment, stainless steal conductivity probes (produced in Food Research Insti-tute Prague) were installed and adjusted in such way as to provide, for the selected concentration of moderately salted yolk, a significant change of the output signal pro-portional to the electrical conductivity of the passing product. An input probe (Probe No. 1) was placed be-yond the flowmeter at the distance of 2.3 m from the entry into the regeneration section on the tubes DN 50; it mea-sured the conductivity of the entering product with the temperature of approx. 5–7°C. Another probe (Probe No. 2) was placed in the distance of 1.3 m beyond the outlet from the heater, again on the tubes DN 50, which means in the
[image:2.595.76.403.99.391.2]also at the end of the holder), the second dose of the marked product was let into the system.
On the first day of the measurement, apart from the yolk, whole liquid eggs were also successfully marked by salt-ed yolk before continuous pasteurisation so that one more measurement was obtained of the impulse response dur-ing the pasteurisation of whole liquid eggs.
After the termination of the operation, the equipment is washed with water under the same temperature regime as the pasteurisation is performed. The course of the system washing has also been recorded as it is important with regard to the sanitation of the equipment, and because it is accompanied by a significant decrease in conductivity. During the experiments, the temperature of the entering product (5–7°C) was monitored with a digital thermome-ter. On the panel of the equipment, the output tempera-ture of the product (usually 66°C) and the flow rate of the product (usually 3.1 t/h) were monitored.
After the completion of the experiments, a sample of pasteurised yolk (dry matter approx. 40%) was taken and rheological properties were measured as a function of tem-perature (for the temtem-peratures of 5, 25, 45, and 65°C) using the rotational rheometer Haake RS150, the characteris-tics were also measured of the system conductivity probe – measuring bridge as a relationship between the con-centration of the salt added to yolk and the output volt-age.
RESULTS AND DISCUSSION
Determination of the average residence time from the estimated volumes
Plate exchanger. Using detailed calculations on the basis of the estimated dimensions of the plates and the calculation of the slot width, the following volumes were determined.
• Volume of the regeneration section for the heated pro-duct VR = 73 l
• Volume of the heating section for the heated product
VO = 50.16 l
The detailed calculation procedure is described in the report of LANDFELD et al. (2000).
Volumes of tubes
• Cold yolk between Probe No. 1 and the entry in the plate exchanger: DN 50, internal diameter 49 mm, length 2.3 m;
V = 4.3 l
• Heated yolk between the plate exchanger and Probe No. 2: DN 50, length 1.3 m; V = 2.45 l
• Connection between Probe No. 2 and the beginning of the holder: DN 50, length 5.77 m; V = 10.9 l
• The volume from the beginning of the holder to Probe No. 3: DN 65, internal diameter 67 mm, length 70.02 m;
V = 246.7 l
• The volume between Probe No. 1 (entry) and Probe No. 2 (behind the plate exchanger): volume of tubes DN 50 (length 2.3 m) + volume of regeneration (entry) + volu-me of heater + tubes DN 50 (length 1.3 m); V = 129.85 l. At the density of yolks of 1018 kg/m3 = 1.018 kg/l and
the performance 3100 kg/h = m. = 0.861 kg/s, the flow rate V = 0.846 l/s..
The average residence time between Probe No. 1 and Probe No. 2 is t = 153 s-
• Volume between Probe No. 2 and Probe No. 3: V = volu-me of tubes DN 50 (length 5.77 m) + holder; V = 257.6 l The average residence time between Probe No. 2 and Probe No. 3 t = 304.5 s-
Calculation of the distribution of the residence time of the particles in the holder
The flowing liquid in a tube (yolk) has a parabolic shape of the velocity profile (Fig. 5). For the mathematical mod-elling, we divided this shape into individual annuluses in which we determined the velocity of flow using Tuplex software for the calculation. In this program the parame-ters of power law rheological model were input intended for the temperature of 65°C (Table 1). From these values of velocity, we can calculate the rates of flow in every annulus in accordance with the following relation:
(1)
where:i = stands for the annulus order
vi= average values of velocity in the individual annuluses
The centre of the tube is modelled as a flow through a circular surface, annuluses begin from Index No. 2.
From the individual calculated flow rates Vi and the to-tal flow rate, the relative distribution of the number of particles (by volume) flowing through the individual an-nuluse can be calculated. The residence time ti for these annuluses was determined from the following relation:
(2)
where:L= length of the holder (taken only in the relation to Probe No. 3)
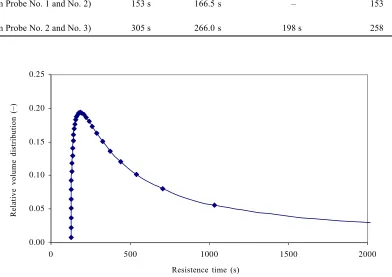
The calculated dependence of the relative distribution of the number of particles on the residence time is indicat-ed in Fig. 6. We can see that the highest relative number of particles has the passing time of 185 s. In addition to this time, it is necessary to add also the passing time from Probe No. 2 to the entry to the holder. This is the volume of 10.9 l that gives, at the flow rate of 0.846 l/s, the time of 12.9 s. The residence time determined by this method is thus 198 s.
i i
i d v
d V 4 ) – (
. 2–1
In the tubes beyond Probe 2 (beyond the plate exchanger)
Tubes DN 50, internal diameter D = 49.10–3 m,
V = 0.849.10. –3 m3/s, T = 65°C
The procedure is similar as in the previous case. An appropriate flow index n = 0.908 and consistency coeffi-cient K´ = 0.072 Pa.sn of the yolk for 65°C (Table 1).
From relation (3), we obtained, for this flow index a: the shear rate γ.w = 75.1 1/s
the apparent viscosity µz = 4.839.10–2 m/s
velocity of the flow in the tubes u– = 4.486.10–1 m/s
Reynolds number Re determining the flow character is Re = 462.4.
From the value of Re criterion, it can be seen that in this part of the tubes, the flow is laminar (Re < 2300).
Tube in the holder
Tubes DN 65, internal diameter D = 67.10–3 m,
V = 0.846.10. –3 m3/s, T = 65°C
The procedure is similar as in the previous case. An appropriate flow index n = 0.908 and consistency coeffi-cient K´ = 0.072 Pa.sn of yolk for 65°C (Table 1).
From relation (3), we obtained, for this flow index n: the shear rate as follows: γw = 29.38 s–1
the apparent viscosity µz = 5.28.10–2 Pa.s
velocity of the flow in the tubes u– = 2.4.10–1 m/s
Reynolds number Re determining the flow character is then Re = 310.
From the values of Re criterion, it can be seen that in this part of the tubes, the flow is laminar (Re < 2300).
Channel in the plate pasteuriser (the last plate in front of the entry in the holder)
Slot: height H = 3.57.10–3 m, width W = 360.10–3 m
V = 0.846.10 . –3 m3/s, T = 65°C
The shear rate on the wall during the flow of power law liquid through the slot of a rectangular cross-section is calculated from the relation (RIEGER 1981):
(5)
At first, we calculated the shear rate on the wall for Newtonian liquid (i.e. n = 1) and thereafter determined from Fig. 5 and Table 1, the appropriate flow index n = 0.908 and consistency coefficient K´ =0.072 Pa.sn of yolk
for 65°C.
From relation (5), we obtained, for this flow index n: the following shear rate: γ.w = 1 143.7 s–1
the apparent viscosity: µz = 3.77.10–2 Pa.s
velocity of the flow in the slot is (yolk flows always through two channels): u– = 3.29.10–1 m/s
Calculation of the shear rate on the wall and Re criteria
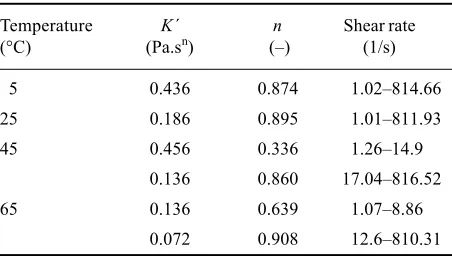
The results of the measurements of the temperature dependence of the rheological parameters of egg yolk are listed in Table 1. It is obvious that egg yolk behaves as non-Newtonian liquid.
In the tubes behind Probe No. 1 (in front of the plate exchanger)
Tubes DN 50, internal diameter D = 49.10–3 m,
V = 0.849.10. –3 m3/s, T = 5°C
The shear rate on the wall during the flow of power law liquid through the tube of a circular diameter is calculated from the following relation (RIEGER 1981):
(3)
where: n = flow behaviour index
At first, we calculated the shear rate on the wall for the Newtonian liquid (i.e. n = 1). From Table 1, we then deter-mined the appropriate value of the flow index n = 0.874 and the consistency coefficient K’= 0.436 Pa.sn of the yolk
for 5°C in the appropriate range of shear rates.
From relation (3), we obtained, for this flow index n, the shear rate on the wall of tubes:
γ.w = 75.88 s
–1
For the apparent viscosity, the following relation is val-id (ULBRECHT & MITSCHKA 1965):
(4) From relation (4), we calculated the apparent viscosity: µz = 2.528.10–1 Pa.s
The average velocity of the flow in the tube is then as follows: uu– = 4.486.10–1 m/s
Reynolds number Re which evaluates the character of flow is then as follows: Re = 88.5.
[image:4.595.71.297.126.254.2]From the value of Re criterion, it can be seen that, in this part of the tubes laminar flow occurs (Re < 2300). Table 1. The parameters consistency coefficient K´ and flow behaviour index n for the yolks at different temperatures
Temperature K´ n Shear rate
(°C) (Pa.sn) (–) (1/s)
5 0.436 0.874 1.02–814.66
25 0.186 0.895 1.01–811.93
45 0.456 0.336 1.26–14.9
0.136 0.860 17.04–816.52
65 0.136 0.639 1.07–8.86
0.072 0.908 12.6–810.31
3 32 . 4 1 3 D V n n w π + = γ ! ! . ' γ −1
=
µ n
w
z K !
2 H W V n n w !
! . 6
3 1
2 +
Reynolds number Re determining the flow character is then Re = 62.8.
We can see that the flow is laminar also in this case. In the individual sections of the plate exchanger, tempera-tures differ. At 25°C, Re = 26.7, at 45°C, Re = 46.8, respec-tively.
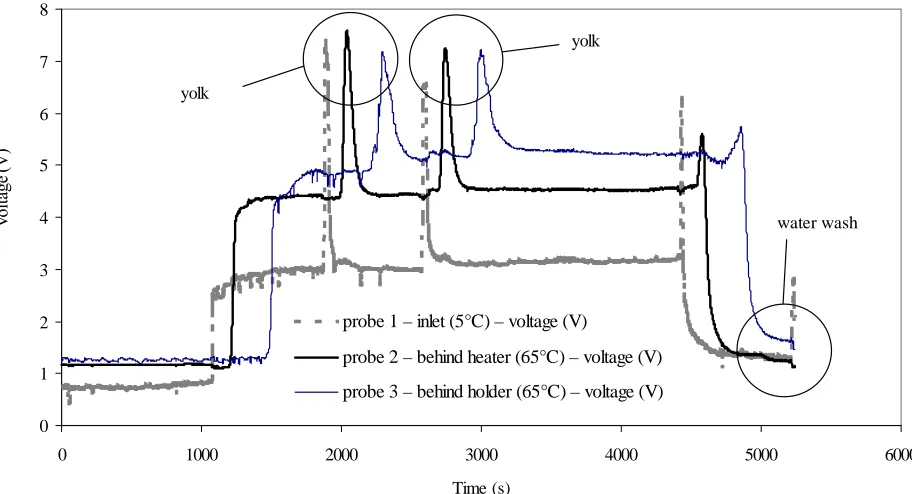
Determination of the average residence time and standard deviations from the experiments
The experimentally measured data of the course of con-ductivity with time are included in Figs. 2 and 3; using the maximum values of conductivity, we can estimate the
[image:5.595.62.523.187.435.2]res-Fig. 2. Results of the measurement of the residence time of egg yolk and whole liquid eggs during pasteurisation – 1st experimental run
Fig. 3. Results of the measurement of the residence time of egg yolk during pasteurisation – 2nd experimental run
0 2 4 6 8 10 12
0 1000 2000 3000 4000 5000 6000 7000 8000 9000
Time (s)
probe 1 – inlet (5°C) – voltage (V)
probe 2 – behind heater (65°C) – voltage (V)
probe 3 – behind holder (65°C) – voltage (V)
egg yolk whole liquid eggs
0 1 2 3 4 5 6 7 8
0 1000 2000 3000 4000 5000 6000
Time (s)
probe 1 – inlet (5°C) – voltage (V)
probe 2 – behind heater (65°C) – voltage (V)
probe 3 – behind holder (65°C) – voltage (V)
yolk
yolk
water wash
V
oltage (V)
V
[image:5.595.64.520.494.741.2]0 2 4 6 8 10 12
0 1 2 3 4 5 6
Salt concentration (%)
probe 1 – inlet (5°C)
probe 2 – behind heater (65°C)
probe 3 – behind holder (65°C)
idence time t - . We found that between Probe No. 1 and Probe No. 2, the average residence time was t = 153 s, and- between Probe No. 2 and Probe No. 3, it was t = 258 s.- These values are in a very good agreement with the theo-retical values determined from the volumes of the individ-ual parts of the line.
The results of the calibration of the individual conduc-tivity probes as a function of salt concentration in the pasteurised yolk are included in Fig. 4. It results from this calibration that every probe reacts in a slightly different way, and that the output voltage from the measuring bridge is not a linear function of the concentration (especially for Probe No. 1). For this reason, correction was made for this non-linearity of the calibration signals. The corrected courses of conductivity were processed by the method of splines. The correction was made to the ground (a zero level of conductivity for unsalted product). An extrapola-tion was made of the reverberated conductivity (tail) and a shift was performed of all responses from the beginning by which the time of the piston flow was estimated; nor-malisation of the data per a unit surface was also per-formed.
The response curves adjusted in this way were subject-ed to the identification of the distribution of the residence time by the methods of regularisation by the method of splines. Impulse responses, were calculated i.e. the
re-0 0.2 0.4 0.6
0 0.01 0.02 0.03 0.04 0.05 0.06 0.07
[image:6.595.202.531.92.436.2]Distance from tube wall (m)
Fig. 5. Velocity profile in the holder tube during egg yolk pas-teurisation (calculated by Tuplex software for the temperature of 65°C)
sponses per a unit step input signal, and the average res-idence time and the average quadratic deviation were de-termined.
For the heating part of the plate exchanger (in more details, the space monitored by Probes No. 1 and No. 2 – Fig. 1), the average residence times are included in Ta-ble 2. It is obvious from the taTa-ble that, for the second measurement of the second experiment, the identification was not precise which might have been caused by the
Table 3. Average residence times for the holder, determined by the analysis of conductivity data
Marking t - (s) s (s)
1st experiment 260 37
2nd experiment, 1st measurement 274 40
2nd experiment, 2nd measurement 264 34
Average 266
Table 2. Average residence times for the exchanger, detected by the analysis of conductivity data
Marking t - (s) s (s)
1st experiment 167 36
2nd experiment, 1st measurement 166 32
2nd experiment, 2nd measurement 72 15
[image:6.595.71.297.674.759.2]Average 166.5 –
Fig. 4. Results of the cali-bration of the conductivity probes
V
oltage (V)
[image:6.595.308.540.674.759.2]Table 4. Comparison of the average residence times
Equipment Method Analysis of Estimate using Estimate from the peaks
of volume conductivity Tuplex software of conductivity responses
Exchanger
(between Probe No. 1 and No. 2) 153 s 166.5 s – 153
Holder
(between Probe No. 2 and No. 3) 305 s 266.0 s 198 s 258
inaccurate data of the courses of conductivity. These data were not included in the calculation of the average.
For the holder (more precisely, for the space monitored by Probes No. 2 and 3 – Fig. 1), the average residence times and deviations were determined by analysis and are included in Table 3.
From the tables, it is obvious that there exist relatively significant deviations of the average residence times which are actually the deviations of the piston flow.
A comparison of the average residence times determined by the analysis of the conductivity responses with the estimates of the average residence times calculated using the volumes and other methods is listed in Table 4.
It is obvious that using Tuplex software, the shortest residence time was determined for the holder. This is caused by the fact that it relates to the time for which the relative volume (number of particles) is maximal, it does not relate to the average residence time. As Tuplex soft-ware considers also very long residence times of particles on the walls of the holder, the average residence time will be very long (estimated at approx. 600 s). The average residence times estimated from the volumes correlate very
0.00 0.05 0.10 0.15 0.20 0.25
[image:7.595.87.479.165.442.2]0 500 1000 1500 2000
Fig. 6. Dependence of the relative volume distribution on the residence time in the holder (calculated with Tuplex software)
well with the results of the analysis of the conductivity responses, and with the results obtained from the time shifts of the maximum values of the conductivity respons-es. The results of the analysis of the conductivity re-sponses can be considered as the most precise, see Tables 2 and 3 where the values of deviations are also included.
Conclusion
The flow in the system of pasteurisation equipment is laminar during the pasteurisation of yolk. The shear rate on the wall of the plate exchanger reached the value of up to 1143 s–1 while the shear rate on the wall of the transport
tubes DN 50 was 75 s–1 and, on the wall of the holder (tube
DN 65), it was 29 s–1.
On the basis of the experimental data obtained by means of the conductivity probes, it was found that the average residence time in the heating part of the plate exchanger (more precisely between Probes No. 1 and No. 2) was 166.5 s with the average quadratic deviation of 32 to 36 s. Using the same method, the average residence time was determined in the holder (more precisely between Probes
Relative volume distribution (–)
No. 2 and No. 3) and had the value of 266 s with the average quadratic deviation in the range of 34 to 40 s. This time complies with the requirements of the Decree of the Ministry of Agriculture of the Czech Republic No. 287/1999 of the Coll., Art. 51, Par. 3, that says that, during a continuous flow pasteurisation of yolk, it is necessary to maintain the temperature of 65°C for the time of 180 s. This requirement is also fulfilled by the minimum resi-dence time that can be estimated from Figs. 2 and 3 as the time from the first detection of salted yolk in Probe No. 2 to the first detection of salted yolk in Probe No. 3. For the first experiment, measurement No. 1, this time was 234 s, for the second experiment, measurement No. 1, this time was 221 s, and for the measurement No. 2 225 s. As a reserve of the inactivation effect, the temperature history in the heating part of the plate exchanger can, also be taken into account.
List of symbols
n flow behaviour index [–]
D internal diameter of tubes [m]
H height of slot [m]
K´ consistency coefficient [Pa.sn]
L length [m]
Re Reynolds number [–]
S flow cross section [m2]
s average quadratic deviation of the average
residence time [s]
T temperature [°C]
t - average residence time [s]
u– average velocity [m/s]
V volume [m]
Vo volume of the heating section [m]
VR volume of the regeneration section [m]
V . rate of flow (flow rate) [m3/s]
W width of slot [m]
vi local velocity of flow [m/s]
γ.w shear rate on the wall [1/s]
µz apparent viscosity [Pa.s]
ρ density [kg/m3]
R e f e r e n c e s
LANDFELD A., ŽITNÝ R., HOUŠKA M., KÝHOS K., NOVOTNÁ P. (2000): Distribution of residence time during pasteurisation of yolks. [Technical Report.] VÚPP Prague. (in Czech) LIN S.H. (1979): Residence time distribution of flow in a
con-tinuous sterilization process (review). Process Biochem., 14: 23–24, 26–27.
MURIANA P.M., HUIYING-HOU, SINGH R.K. (1996): A flow-injection system for studying heat inactivation of Listeria
moocytogenes and Salmonella enteritidas in liquid whole egg.
J. Food Protect., 59: 121–126.
PUNIDADAS P., MCKELLAR R.C. (1999): Selected physical properties of liquid egg products at pasteurization tempera-ture. J. Food Process. Pres., 23: 153–168.
RIEGER F., HOUDA J., BINKO J. (1981): Measurement of rheo-logical properties of melt polymers using extrusiometer. In: 4th Nation-wide Conf. Rheology of liquids in the industrial
practise. Velké Karlovice. (in Czech)
SCALZO A.M., DICKERSON R.W. JR., POL J.C. (1969): Re-zidence times of egg products in holding tubes of egg pas-teurizers. Food Technol., 23: 678–681.
ULBRECHT J., MITSCHKA P. (1965): Chemical Engineering of Non-Newtonian Liquids. Publishing company of the Czech Academy of Sciences, Prague. (in Czech)
VEERKAMP C.H., ROMIJN A.J.M., POL J.C. (1974): Influence of varying residence-time distribution on inactivation of mi-croorganisms during pasteurization of egg products. Le-bensm.-Wiss. Technol., 7: 306–310.
Received for publication January 15, 2002 Accepted after corrections June 6, 2002
Souhrn
LANDFELD A., ŽITNÝ R., HOUŠKA M., KÝHOS K., NOVOTNÁ P. (2001): Rozložení dob prodlení při pasteraci žloutků. Czech J. Food Sci., 20: 193–201.
Z geometrie kanálů v jednotlivých sekcích pasteračního zařízení byl určen charakter toku pomocí Re kritéria, který byl ve všech
částech systému laminární. V práci jsou uvedena porovnání středních dob prodlení získaných metodou objemů, analýzou odezev vodivosti, odhadem pomocí software Tuplex a odhadem z píků odezev vodivosti.
Klíčová slova: doba prodlení; pasterace; vaječný žloutek; pístový tok
Corresponding author: