Effect of Slurry Solids Concentration and Ball Loading on
Mill Residence Time Distribution
Augustine B. Makokha1,*, Diana Starovoytova Madara2, Saul Sitati Namago3, Edwin Ataro4
1Department of Chemical & Metallurgical Engineering, University of the Witwatersrand, Johannesburg, South Africa 2Department of Industrial, Manufacturing & Textile Engineering, Moi University, Eldoret, Kenya
3Department Chemical & Process Engineering, Moi University, Eldoret, Kenya 4Department of Electrical & Communications Engineering, Moi University, Eldoret, Kenya
Abstract The residence time distribution (RTD) of mineral slurry and slurry holdup volume in an industrial ball mill has
been successfully studies using tracer tests. Six different conditions of solids concentration and three levels of ball loading were assessed. The effects of the slurry solids concentration and the ball loading on the mean residence time of slurry were clearly depicted in the results. Using the mass balance of salt tracer inside the mill, the slurry flow rate through the mill was estimated and the calculated values compared reasonably with the measured ones within the limits of experimental error. Further, based on the measured flow rates and residence times, it was possible to estimate the slurry holdup volume inside the mill. The correlation between slurry holdup volume with ball loading, slurry solids concentration and feed flow rate yielded plausible results. ANOVA statistical tests (F-test and t-test) were utilized to assess the adequacy of the correlation equation and the significance of the correlation coefficients.Keywords RTD, Holdup, Ball mill, Ball load, Slurry
1. Introduction
Mineral processing industry has in the recent past witnessed increased installation of large diameter mills in order to benefit from economies of scale. However, to fully utilize the available mill capacity and maintain energy efficiency for these large devices, closer and more effective control is needed. Satisfaction of this need would result in stability of the entire mineral processing circuit, thereby reducing the overall cost in mineral extraction. Songfack and Rajamani [1] showed that accurate knowledge of internal flow through the mill is fundamental in trying to improve the efficiency of wet milling circuits. For a given set of operating conditions, the flow behaviour of slurry within the mill determines the slurry residence time inside the mill and consequently the holdup volume, both of which have a large influence on the milling efficiency. The holdup volume influences the effectiveness of material transport to the breakage zones and the rate of breakage. Therefore, besides other key mill control parameters, it is imperative that the optimal slurry residence time and holdup volume that correspond to maximum milling efficiency be reliably predicted as a function of key operating conditions such as
* Corresponding author:
[email protected] (Augustine B. Makokha) Published online at http://journal.sapub.org/mining
Copyright © 2014 Scientific & Academic Publishing. All Rights Reserved
mill load volume and slurry properties. This consideration constitutes part of the motivation for this study.
2. Review of Residence Time
Distribution in Engineering Systems
For decades, the residence time distribution (RTD) technique has been employed successfully to characterize the transport of material in a wide range of engineering processes. The concept of RTD was first proposed by MacMullin and Weber in 1935 [2] for analysis of chemical reactors but later on Danckwerts [3] developed it into a more definitive form by identifying and characterizing various distribution profiles of interest. The tracer response is the method popularly used for RTD studies. Typically, measuring of RTD involves introduction of a tracer at the feed and continuously or discretely monitoring the response at the discharge in terms of conductivity or concentration. If the tracer is injected as a pulse, then the fraction of tracer that remains in the system at any time (at constant flow rate through the reactor) can be described by the distribution function E(t) mathematically described as follows [4]:
0
( )
( )
( )
C t
E t
C t dt
∞=
Where C(t) represents the concentration of the tracer in the discharge stream while the integral of C(t)dt defines the area under the curve. Interpretation of the RTD curves is based on moment analysis which provides an indication of various aspects of flow in a reactor. The zeroth moment is related to the material holdup in the system which is represented by the area under the curve. For normalized RTD data, the area under the curve is equal to unity.
0 0
( )
1
M
=
∞∫
E t dt
=
(2)The first and second moment of the RTD function around the origin give the mean residence time (τ) and the variance (σ2) respectively, where the latter is a measure of spread of the RTD curves about the mean value.
0
( )
t E t dt
τ
=
∞∫
(3)2 2
0
(
t
)
E t dt
( )
σ
=
∞∫
−
τ
(4)The shape of RTD curves depends on the combined effect of the flow behavior and mixing performance inside the process equipment, which is usually related to the RTD function parameters i.e. mean residence time and variance. This information is important for diagnostics as well as control purposes. Specific multivariate unit processes such as wet ball milling require accurate knowledge of the material residence time inside the process vessel in order to effectively control and optimize the process. Studies by Kelsall et al [5], Hogg [6], Kinneberg and Herbst [7], Austin et al [8] and King [9] have shown that residence time
distribution function is a key component of the breakage behavior model for continuous mills. The residence time distribution function describes the flow through the mill while grinding equations describe the breakage behavior as a function of time.
In this study, salt tracer tests have been performed on an industrial secondary ball mill at different operating conditions. The aim was first to establish the effect of changes in slurry solids concentration and mill ball loading on residence time distribution and the subsequent impact on milling efficiency. Secondly, to explore a possible means to estimate slurry holdup volume inside the mill based on the tracer response data.
3. Experimental
3.1. Industrial Ball Mill
The ball mill utilized in the sampling survey has an inside diameter of 7.3 m and length of 9.6 m and is run in open circuit. Under normal operating conditions, the mill ball loading is 30% of total mill volume, mill rotational speed is 75% of critical speed, slurry solids concentration is 75%, solids feed rate is 330 tph.
3.2. Experimental Program & Procedures
The literature [5, 10] presents several types of tracers that have been used for RTD measurement in tumbling mills ranging from soluble salts to radioisotopes. After careful evaluation of possible tracers, the common salt, sodium chloride was adopted for RTD measurements in the present study. Six sets of salt tests were performed on the mill to determine the slurry residence time and the RTD. In each test run 250kg of salt (NaCl) was dumped into the cyclone underflow stream almost instantaneously (within 5sec) and the response was monitored at the discharge.
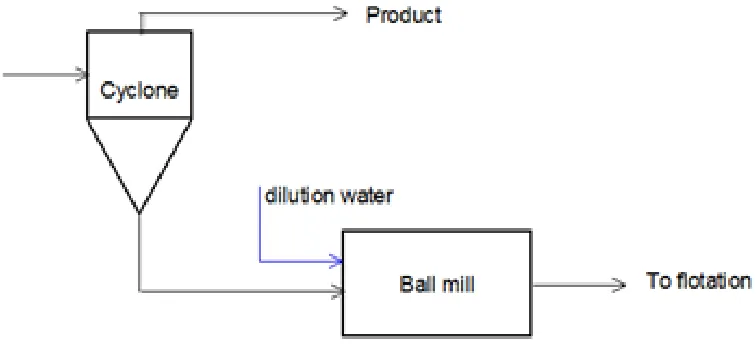
Figure 1 is a schematic representation of the flow-sheet of the milling circuit. Timed samples were collected manually into 250 ml plastic bottles over the duration of 90 minutes for conductivity analysis. The sampling process was accomplished using a specially designed sampling manifold installed at the mill discharge just before the discharge sump. The sampling duration of 90 minutes was considered sufficient for the salt to completely disappear from the mill.
The beginning of sample collection was synchronized with the salt impulse event. Prior to each test run, the mill was allowed to stabilize at a set feed flow rate and particle concentration for about 1.5 hours. A summary of the experimental program is presented in Table 1.
Table 1. Experimental program for the salt tests Ball Loading (%) In-mill wt % solids
65.1 67.3 72.1 73.4 75.1 75.6
25 √ √
30 √ √
33 √ √
Solids feed rate to the mill was measured at the densifier cyclone underflow as depicted in Figure 1. Samples were collected from each of the 5 densifier cyclones into sampling bags for a period of 2-3 seconds and then weighed to determine the mass flow rate. The sampling process was repeated for 1 hour with a total of 3 runs per cyclone from which an average flow rate was determined. In order to obtain accurate time duration of each sampling sequence, the sampling process was videoed using a Panasonic NV-GS180 camera at 25 fps.
4. Data Analysis and Discussion
4.1. RTD Data
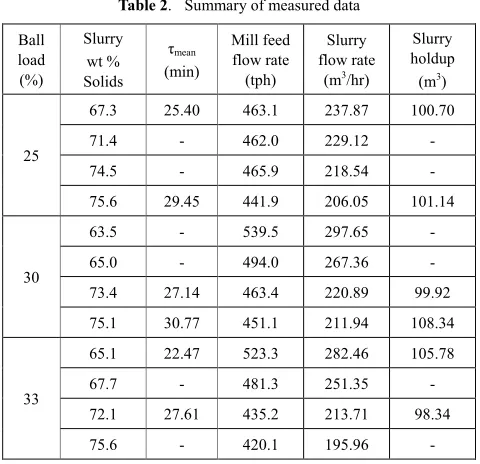
Table 2. Summary of measured data Ball load (%) Slurry wt % Solids τmean (min) Mill feed flow rate (tph) Slurry flow rate
(m3/hr)
Slurry holdup (m3)
25
67.3 25.40 463.1 237.87 100.70 71.4 - 462.0 229.12 - 74.5 - 465.9 218.54 - 75.6 29.45 441.9 206.05 101.14
30
63.5 - 539.5 297.65 - 65.0 - 494.0 267.36 - 73.4 27.14 463.4 220.89 99.92 75.1 30.77 451.1 211.94 108.34
33
65.1 22.47 523.3 282.46 105.78 67.7 - 481.3 251.35 - 72.1 27.61 435.2 213.71 98.34 75.6 - 420.1 195.96 -
Table 2 presents experimental results of the effect of mill ball loading and slurry solids concentration on residence time and hold-up. The measured residence times were obtained from the RTD data using equation 3. Since the mill feed was relatively fine with d50 < 150µm, the settling velocity of particles in slurry would be very slow hence it was assumed that the liquid phase of slurry closely approximated the behavior of the solids phase.
4.2. Tracer Response
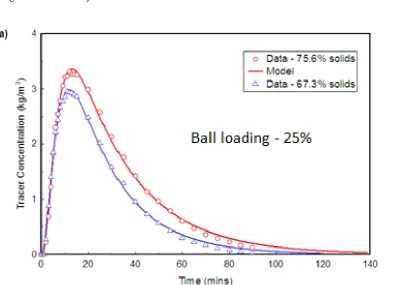
The tracer concentration in the discharge stream, corrected for the base (zero-tracer) concentration of slurry was determined from the conductivity measurements through a simple offline calibration procedure. This involved preparation of several slurry samples to different concentrations by dissolving a known mount of tracer (between 0.3 and 1.5g) into each sample. The slurry samples were collected from the mill discharge stream prior to injection of the salt impulse. The volume of each slurry sample was determined through wet mass and dry mass analysis. The calibration equation was then obtained by mathematically relating the measured conductivity of the calibration samples to the tracer concentration. One should note that for validity of this calibration method, the calibration samples and tracer samples have to go through the same time history and that the conductivity measurement of tracer samples has to be conducted immediately after the calibration procedure. This would help to eliminate any possible errors that may arise from other ionic concentrations generated with time from continuous reactions occurring within the ore slurry. Figures 2a-c show the tracer concentration profiles for different mill operating conditions. A modified version of the RTD model proposed by Canevarolo et al [11] which defines the typical variation of tracer concentration with time was fitted to the RTD data representing the salt concentration versus time, Equation 5.
1 2
( ) ( )
( ) 1 exp exp
n
d d
t t
C t = A − − −ατ − −ατ
(5)
The model parameter A is a constant related to the area under the curve and hence the mass balance while n is the
power exponent. The parameters α1and α2 are rate constants for the increasing and decreasing part of the curve. The real time is obtained by subtracting the delay τd from the
instantaneous time, t. In all the three cases, the model fittings show good agreement with experimental data. The estimated model parameters are summarised in Table 3. It can be
of material gets delayed inside the mill by recirculation through the ball load.
Table 3. Summary of model parameters Ball
Load %
Slurry wt % solids
Estimated model parameters
A α1 α2 n τd
25 67.3 7.987 8.838 18.26 1.15 1.02 75.6 7.072 6.618 23.97 1.40 1.26 30 73.4 10.85 9.869 18.58 1.46 1.12 75.1 8.677 6.195 22.48 2.03 1.18 33 65.1 9.210 8.578 15.41 1.06 0.97 72.1 9.10 7.404 20.35 1.77 1.06
4.3. Slurry Residence Time
The experimental results of the mean residence time of slurry inside the mill are summarized in Table 2. One can observe that at same ball loading, the mean residence time is greater at higher percentage of solids in slurry. This is because higher particulates concentration increases the viscosity of slurry thereby lowering its mobility. On the other hand, an increase in the ball loading from 25 to 30% and from 30 to 33% resulted in only small changes in mean residence time.
The possible explanation for the observed marginal changes is that, an increase in the ball load tends to increase the slurry turnover time. It also reduces the slurry pool volume subsequently lowering the mill discharge capacity. But the combined effect of these two factors on slurry residence time is far less appreciable as compared to the effect of percentage of solids in slurry. This result reinforces
the findings by other researchers [1, 6] that viscosity effects play a dominant role in defining the mass transport inside the mill.
4.4. Feed Flow Rate
At steady state, the volumetric flow rate of slurry through the mill is considered to be constant. So by assuming homogeneous mixing of salt and slurry inside the mill, the mean flow rate of pulp (solids and water) through the mill can be analytically determined based on the tracer concentration profile at the mill discharge which is related to the mass balance of the tracer. The area under the concentration-time curve represents the amount of tracing material in the mill discharge stream. This can be expressed by equation 6 in which Mt is the mass of salt impulse (tracer).
0
( )
t l
M
=
Q C t dt
∞∫
(6)The mass flow rate of solids (𝑚𝑚̇𝑠𝑠), ore water (𝑚𝑚̇𝑙𝑙) and
slurry (𝑚𝑚̇𝑠𝑠𝑙𝑙 ) can be calculated using the following
expressions:
𝑚𝑚̇𝑙𝑙 = 𝜌𝜌𝑙𝑙𝑄𝑄̇𝑙𝑙 ; 𝑚𝑚̇𝑠𝑠= �100 − 𝑥𝑥𝑥𝑥𝑠𝑠 𝑠𝑠� 𝑚𝑚̇𝑙𝑙 ; 𝑚𝑚̇𝑠𝑠𝑙𝑙 = 𝑚𝑚̇𝑙𝑙 + 𝑚𝑚̇𝑠𝑠(1)
in which the termρl refers to the density of water and xs is
the weight percentage of solids in slurry. For a given level of slurry density, ρp, the slurry hold-up mass (Msl) and hold-up
volume (Vsl) can be obtained as:
;
/
sl sl mean sl sl p
Figure 2. Distribution of tracer concentration in the mill discharge
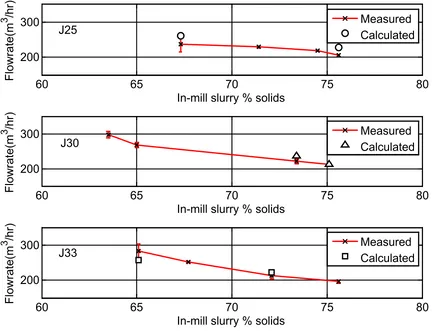
Figure 3 shows a comparison of the measured and calculated values of the slurry flow rate through the mill. A marginal variation between the measured and theoretical values of flow rates is evident. This could possibly be due to a mass balance error, attributed to unaccountable tracer losses inside the mill.
4. Mathematical Correlations
Premised on the observed trends in the data, an attempt
was made to correlate the slurry holdup volume obtained from equation 7 with the governing variables: ball loading (J), slurry solids concentration (xs) and feed flow rate (F). A
multiple linear regression model was applied in the form:
0 1
ˆ
k j j ij i jj i j
Y
β
β
X
β
X X
ε
= <
=
+
∑
+
∑∑
+
(8)coefficient, βij is the interaction term coefficient and ε represents other sources of variability un-accounted for by the model.
The data was subjected to statistical analysis (ANOVA) using KYPLOT software. The regression coefficients were obtained based on the method of least squares as [β]= (XTX)-1XTY in which [β] is the matrix of coefficients, X is the
matrix of predictors while Y is the matrix of responses. The coefficients values were as follows:
0 1 2 3
6 6 3
12 13 23
146.12, 0.081, 0.892, 0.055,
6.82 10 , 2.44 10 , 1.07 10
β
β
β
β
β
−β
−β
−= = =− =−
= × = × = ×
Coefficients values lower than 0.005 were considered to have insignificant effect on the prediction capability of the regression equation hence only the coefficient terms, β0, β1,
β2, β3were treated as significant. The resulting constrained
equation that best described the data was obtained as:
1 2 3
0.152 1.132 0.0772 146.13
sl
V = x − x − x + (9)
Where x1, x2, and x3 are slurry solids concentration
(% solids), ball loading and feed flow rate respectively. The regression equation was checked to determine if it
provides an adequate description of the data. This was accomplished using the F-test and the results are presented in Table 4. The observed F-value of the regression was higher than the critical F-value, implying that the regression is significant at the 5% significance level.
Table 4. ANOVA for significance of the regression Source Squares Sum of Do F Squares Mean (Obsv) F-test F-test (Crit) Regression
Residual Total
161.19 3.594 164.78
3 2 5
53.72 1.797 32.96
29.89 19.16
Figure 4 shows the goodness of fit of equation 9 to the data with a linear correlation coefficient of R2 = 96%. The observed deviations are suspected to have emanated from the mass balance error in Equation 6.
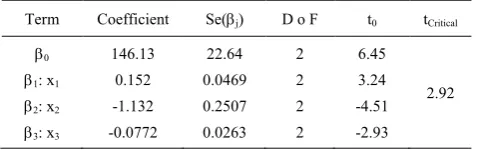
Further, the Student’s t-test was then employed to assess the significance of the individual regression coefficients in equation 9. The t-statistic was compared with the critical value at 10% significance level. All the variables passed the significance test as depicted by the data in Table 5.
Figure 3. Comparison of measured and calculated values of flow rate at different levels of slurry solids concentration and ball loading
60
65
70
75
80
200
300
J25
In-mill slurry % solids
Flowrate
(m
3
/h
r)
Measured
Calculated
60
65
70
75
80
200
300
J30
In-mill slurry % solids
Flowrate
(m
3
/h
r)
Measured
Calculated
60
65
70
75
80
200
300
J33
In-mill slurry % solids
Flowrate
(m
3
/h
r)
Figure 4. Observed versus model predictions of holdup volume
Table 5. Test of significance for individual regression coefficients Term Coefficient Se(βj) D o F t0 tCritical
β0
β1: x1
β2: x2
β3: x3
146.13 0.152 -1.132 -0.0772
22.64 0.0469 0.2507 0.0263
2 2 2 2
6.45 3.24 -4.51 -2.93
2.92
5. Conclusions
The salt tracer tests were applied to determine the slurry residence time distribution inside an industrial overflow ball mill for different conditions of slurry solids concentration and ball loading. The results revealed that, the mean residence time of slurry inside the mill is affected both by slurry solids concentration and ball loading. Further, the slurry flow rate through the mill was calculated using RTD data and the calculated values yielded a good match to the measured ones within the limits of experimental error. Based on the measured flow rates and residence times, the slurry holdup volume inside the mill was estimated. An empirical correlation of slurry holdup volume with solids concentration in slurry, ball loading and mill feed rate yielded a good fit with a mean relative error of 0.7%.
ACKNOWLEDGEMENTS
The Authors acknowledge the financial support from Wits University, Johannesburg, which enabled the execution of this Project.
REFERENCES
[1] Songfack, P and Rajamani, R., 1999, Hold-up studies in a pilot scale continuous ball mill: dynamic variations due to changes in operating variables, Int. J. Miner. Process 57:105-13.
[2] Fogler, H.S., 1992, Elements of chemical reaction engineering, Prentice-hall.
[3] Danckwerts, P.V., 1953, Continuous flow systems: distribution of residence times, Chemical Engineering
Science, 2 (1) 1-13.
[4] Levenspiel, O., 1972, Chemical Reaction Engineering, 2nd ed., Wiley, New York.
[5] Kelsall, D.F., Reid, K.J and Restarick, C.J., 1970, Continuous grinding in a small wet ball mill, Part III: A study of distribution of residence time, Powder Technology, 3: 170-178.
[6] Hogg, R., 1984, Mass transport models for tumbling ball mills,
Proc. Control’84, AIME, 7:55-69.
[7] Kinneberg, D, J and Herbst, J.A., 1983, A comparison of linear and non-linear models for open-circuit ball mill grinding, Int. J. Miner. Process, 13: 143-165.
[8] Austin, L.G., Klimpel, R. R., Luckie, P. T., 1984, Process Engineering of size reduction: ball milling. SME/AIME, New York.
[9] King, R.P., 2001, Modeling & Simulation of Mineral Processing Systems, Butterworth-Heineman, USA.
[10] Gardner, R.P., 1975, Evaluation of a radioisotope tracer method for determination of simulation parameters in open-circuit continuous ball mills, Trans. AIME, 258:46. [11] Canevarolo, S.V., Melo, T.J.A., Covas, J.A. and Carneiro,