A Study of the Debris Flow Activity on the One-Stepped
Channel Slope
Sungduk KIM
1and Hojin LEE
21Department of Civil Engineering, Chung-Ang University in Seoul, Republic of Korea; 2School
of Civil Engineering, Chungbuk National University in Cheongju, Chungbuk, Republic of Korea
Abstract
Kim S., Lee H. (2015): A study of the debris flow activity on the one-stepped channel slope. Soil & Water Res., 10: 32–39.
The purpose of this study is to evaluate the behaviour and mechanism of debris flow on various slopes through nu-merical simulation. The nunu-merical simulation was performed using the Finite Difference Element Method based on the equation of mass conservation and momentum conservation. In order to measure the behaviour of the debris flow, the debris flow of the straight rectangular channel slope and that of the one-stepped channel slope were com-pared. Firstly the water flow discharge, the water flow depth, and the sediment volume concentration at the slope downstream of the channel, depending on the different inflow water flow discharges at the upstream of the channel, were analyzed. The smaller the supply from the upstream of the channel, the water flow discharge and the water flow depth surged only at the point after the debris flow reached the downstream of the channel, and showed a tendency to decrease thereon after. On the other hand, when the supply at the upstream of the channel increased, the curve of the water flow discharge and the water flow depth was unsteadily high. Through the Root Mean Square ratio (RMS) comparison, the water flow discharge and water flow depth of the one-stepped channel slope was lower than that of the straight rectangular channel slope. Secondly, the water flow discharge, water flow depth, and sediment volume concentration depending on the change in the slope of the one-stepped channel slope were analyzed. The larger the slope, the larger the fluctuation in amplitude of the curve and this resulted in a higher water flow discharge distribu-tion as well as in a wider fluctuadistribu-tion bandwidth. In the results of the study at each point, in the case of the straight rectangular channel, the water flow discharge and depth increased as it went downstream. This is because more erosion than deposition occurs when debris flow occurs at the upstream of the channel.
Keywords: disaster; finite difference element method; momentum conservation
Heavy rainfall causes debris flow in mountainous terrains with many slopes bringing casualties and property damages. This sort of debris flow contains various amounts of mud, sand, gravel, boulders, and water. Disasters due to debris flow have continuously increased due to urbanization and reckless develop-ment in mountainous terrains. On a global scale, debris flow is not only caused by heavy rainfall but it can also be induced by earthquakes, volcanic erup-tions, and rapid collapse of ice bergs (Armanini & Gregoretti 2000; Chen & Ling 2000; Takahashi 2000; Nakagawa et al. 2002). In order to reduce such debris flow disasters, it is important to understand the behaviour and mechanism of the debris flow.
Debris flow is a phenomenon during which a mix-ture of sediment and water gains gravity and flows like a continuous fluid and because the void of the particle is saturated with water or slurry it allows for great mobility (Takahashi 2007). If we look at the studies published on debris flow, there is a study that uses the Depth Average Model (DAM) based on the mechanism of deposition and erosion (Savage & Hutter 1997; O’Brien et al. 1993; Denlinger & Iverson 2001), however, the model does not apply to the combination of deposition and erosion.
Soil & Water Res., 10, 2015 (1): 32–39 Original Paper
doi: 10.17221/17/2013-SWR
σ – density of sediment particles τb – bottom shear stress
ζb – deposition thickness of the bed measured from the original bed surface elevation
Regarding erosion velocity Bv, the equation sug-gested by Egashira et al. (1997) was used.
The bottom shear stress in the mass conservation of the sediment-water mixture equation can be shown with yield stress τy (Egashira et al. 1997):
Bv = –∇φtan(θe– tanθ) (5)
(6)
τb = τy + ρƒy∇φ|∇φ| (7)
where:
θe – equilibrium slope of c
φ – internal friction angle of sediment τy – yield stress
fy – coefficient of resistance
When the constitutive equation of Egashira et al. (1997) is used, the yield stress and coefficient of resistance can be shown as below:
(8)
(9)
where:
n – 5
e – restitution of sediment particles
kd – empirical constant (= 0.0828)
kf – empirical constant (= 0.16)
d – mean diameter of sediment
RESULTS AND DISCUSSION
Condition of numerical simulation. Figure 1 shows
the numerical simulation of the present analysis of the debris flow behaviour. Figure 1a shows the case of the straight rectangular channel slope and Figure 1b of the one-stepped channel slope. For the purpose of the numerical simulation, the one-stepped chan-nel slope is divided into 3 slopes – a 5 m upstream channel slope θ1, a 2 m one-stepped channel slope θ2, and a 2 m downstream channel slope θ3.
In the case of the straight 9 m rectangular channel, the slope θ1 is considered. Also, in both cases the
∂h +∇ × (∇φh) = B v ∂t
∂(ch) +∇ × (c ×∇φh) = C * Bv ∂t
deposition and erosion of debris flow. In the present study the model of Egashira et al. (1997) combin-ing the erosion and deposition caused by debris flow was applied. The behaviour of debris flow ac-cording to time elapse and different supply water flow discharge at the straight rectangular channel slope and at the one-stepped channel was estimated. Also the behaviour of the debris flow according to the variation of the one-stepped channel slope at the downstream of the channel was investigated. In order to figure out the level of erosion of the debris flow at the upstream of the channel, the water flow discharge q of the debris flow at each point of the entire channel was analyzed.
The study provides useful information on predicting disaster caused by debris flow at the downstream of a steep mountain slope depending on time-space rainfall distribution, and also information useful when plan-ning various counter measures to prevent debris flow disasters at mountainous areas with various slopes.
MATERIAL AND METHODS
Governing equation. The governing equation to
analyze the point from where the debris flow forms to where the deposition boundary is composed of the momentum conservation of the flow mixture, the mass conservation of the sediment-water mixture, and the mass conservation of the sediment:
(1)
(2)
(3)
(4)
where:
h – water depth φ – velocity potential
Bv – erosion velocity or deposition velocity
c – sediment concentration in debris flow
C* – maximum sediment concentration in the bed
g – gravity acceleration
θ – angle formed by the bed slope and water surface elevation
ρ – water density
ρm – mixture density of water and sediment (ρm = (σ – ρ)c + ρ)
∂(∇φh) +∇ × (∇ ×∇φh) = gh (sinθ – cosθ × ∂h) – τb ∂t ∂x ρm ∂ζb + B
v = 0 ∂t
θe = arctan
(
(σ/ρ – 1)c)
tanφ (σ/ρ – 1)c + 1τy =
{
ρg(
σ – 1)
c(
c)
1/nhcosθtanφ}
∇φρ C* |∇φ|
ƒ = 25
{
kdσ(1 – e2)c1/3+ kƒ (1 –c) 5/3}
(
d)
2width is 10 cm, and the height from the bed surface elevation to the upstream channel is 5 m. At the 3 m part of the upstream channel, the saturated sand sediment was characterized by the mean particle size of 3.1 mm, density of the sediment particle of 2.65 g/cm3, maximum sediment concentration in bed C*= 0.65, and internal friction angle tanj = 0.7. The sediment layer had 10 cm in thickness. Line A–A' and line B–B' indicates the investigation point at the downstream of the channel.
The numerical analysis. The numerical model
applies the Finite Difference Element Method using the change in time. Figure 2 presents the numerical calculation used in this study. It shows that the input condition is advantageous at the boundary surface so the water flow discharge (q) and water velocity (u) were placed on the grid line, and the sediment volume
concentration (c) and water depth (h) were placed in the centre of a cell.
I, I + 1, …, in Figure 2 shows the position level on the channel line and can be expressed as follows: (a) For the case of the straight rectangular channel
slope
– number of total points on the channel slope for numerical calculation
(b) For the case of the one-stepped channel slope – number of points on the upstream
chan-nel for numerical calculation
– number of points on the one-stepped channel for numerical calculation – number of points on the downstream of
the channel for numerical calculation – number of total points on the one-stepped
channel slope for numerical calculation J, J + 1, …, shows the elapse of time Δt when per-forming the numerical model. If the input condition of the numerical model is categorized by time, there is time of water supply discharge (t1), the time it takes to perform the numerical model calculations (t2), the time it takes the debris flow to reach the downstream of the channel or a specific location of the channel (t3), and the time interval of the numeri-cal model numeri-calculation (t4), where t4 is the linear set time interval. In the numerical model the behaviour of the debris flow according to the input values of the time terms can be displayed.
Numerical results for variation of the inflow
water flow discharge. Recently, due to changes in
[image:3.595.67.531.97.235.2]climate, heavy rainfall occurs in the mountainous regions and debris flow damage occurs frequently in the downstream channel area. Therefore, in order to investigate the level of debris flow disaster due to the changes in rainfall intensity, the water flow discharge, water flow depth, and sediment volume
Figure 1. Definition sketch for numerical simulation of debris flow: straight rectangular channel slope (a), one-stepped channel slope (b)
Figure 2. Performance of the numerical calculation
∑
I = 90total
θ1
∑
I = 20berm
θ1
∑
I = 20downstream
θ1
∑
I = 90total
θ1
∑
I = 50upstream
θ1
c: sediment volume concentration h: water depth
[image:3.595.67.290.516.742.2]Soil & Water Res., 10, 2015 (1): 32–39 Original Paper
doi: 10.17221/17/2013-SWR
concentration of the debris flow according to the variation of the supply water flow discharge at the downstream channel (line A–A' and line B–B' in Figure 1) was analyzed. Here the calculation condi-tions were set into two cases, Qinflow = 600 cm3/s and 800 cm3/s in order to consider the change in heavy rainfall. Also taking in the fact that the lowest slope in a debris flow occurrence was about 15 degrees (Takahashi 2007), the channel slope of the straight rectangular channel slope was set to θ1 = 20°. On the other hand, in the case of the one-stepped channel slope, the slope of the upstream of the channel was set to θ1 = 20°, one-stepped channel slope θ2 = 14°, and the slope of the downstream channel θ3 = 20°. The levels regarding time were set to one-stepped t1 = 20 s, t2 = 60 s, t3 = 30 s, and t4 = 0.2 s.
In order to compare the change in water flow dis-charge at the straight rectangular channel slope and the one-stepped channel slope, the Root Mean Square Ration (RMS ratio) was used. The RMS ratio equation is as follows:
(10)
where:
qstraight – water flow discharge per unit width that goes through the straight rectangular channel slope
qberm – water flow discharge per unit width that goes through the one-stepped channel slope
t3 – time after the debris flow has reached the downstream of the channel
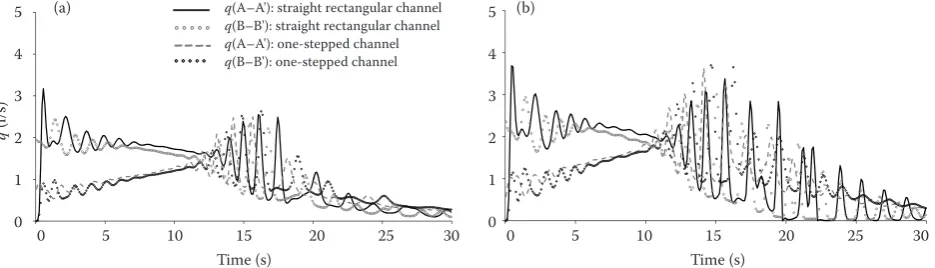
As indicated in Figure 1, Figures 3–5 show the water flow discharge, water flow depth, and sediment volume concentration in the straight rectangular channel slope and the one-stepped channel slope when the debris flow reaches the downstream of the channel at 30 s (t3 = 30 s). In Figures 3 and 4, when
the supply water flow discharge is low at the straight rectangular channel slope (Qinflow = 600 cm3/s), the water flow discharge and water flow depth only surge right after the debris flow reaches the downstream of the channel and after a few seconds it looks as though it is receding, however after 13 s there are approximately 6 s of fluctuation.
Meanwhile, as the supply water flow discharge increases, the curve of the water flow discharge and water flow depth becomes unstable, and after approximately 10 s, fluctuation with high water flow discharge and high water flow depth continues for 15 s. Even after some time the debris flow reaches the downstream channel in heavy rainfall areas, the water flow discharge and water flow depth does not decrease. And the debris flow continues to flow even further at unstable high amplitude. Thus, Figures 3 and 4 show that as the water flow discharge increases, the unstable fluctuation appears more quickly.
In the case of the one-stepped channel slope, 10 s before the debris flow first reaches the downstream of the channel, low water flow discharge and low water flow depth distribution begin and build up gradually. After these 10 s, the fluctuation appears in a high amplitude as seen in the straight rectan-gular channel slope, but the time this fluctuation continues for is shorter than the time in the case of the straight rectangular channel slope. This shows that the one-stepped channel slope can reduce the damages occurred by a debris flow in mountainous terrains. If the change in the water flow discharge in the channels of the straight rectangular channel slope and the one-stepped channel slope during a 30 s time interval is compared using the RMS ratio, in the case of Qinflow = 600 cm3/s in the A−A' line, the one-stepped channel slope shows by 30.9% lower water flow discharge than the straight rectangular
R(q) =
√
∑
t3 [(qstraight)j – (qberm)j]2/t3 [image:4.595.67.535.589.723.2]j=1
Figure 3. Water flow discharge (q)at the downstream boundary of the channel according to time for Qinflow = 600 cm3/s (a)
and Qinflow = 800 cm3/s (b)
0 1 2 3 4 5
0 5 10 15 20 25
q
(l/s)
Time (s)
0 1 2 3 4 5
0 5 10 15 20 25
Time (s)
Time (s) Time (s)
q
(l/s)
0 5 10 15 20 25 30 0 5 10 15 20 25 30
5
4
3
2
1
0
5
4
3
2
1
0 (a) q(A–A'): straight rectangular channel (b)
q(B–B'): straight rectangular channel q(A–A'): one-stepped channel q(B–B'): one-stepped channel
0 1 2 3 4 5
0 5 10 15 20 25
q
(l/s)
Time (s)
q(A–A'): straight recagular channel
q(B–B'): straight recagular channel
q(B–B'): one-stepped channel
q(A–A'): one-stepped channel 0
1 2 3 4 5
0 5 10 15 20 25
q
(l/s)
Time (s)
q(A–A'): straight recagular channel
q(B–B'): straight recagular channel
q(B–B'): one-stepped channel
q(A–A'): one-stepped channel 0
1 2 3 4 5
0 5 10 15 20 25
q
(l/s)
Time (s)
q(A–A'): straight recagular channel
q(B–B'): straight recagular channel
q(B–B'): one-stepped channel
q(A–A'): one-stepped channel 0
1 2 3 4 5
0 5 10 15 20 25
q
(l/s)
Time (s)
q(A–A'): straight recagular channel
q(B–B'): straight recagular channel
q(B–B'): one-stepped channel
q(A–A'): one-stepped channel
0 1 2 3 4 5
0 5 10 15 20 25
q
(l/s)
Time (s)
q(A–A'): straight recagular channel
q(B–B'): straight recagular channel
q(B–B'): one-stepped channel
q(A–A'): one-stepped channel 0
1 2 3 4 5
0 5 10 15 20 25
q
(l/s)
Time (s)
q(A–A'): straight recagular channel
q(B–B'): straight recagular channel
q(B–B'): one-stepped channel
q(A–A'): one-stepped channel 0
1 2 3 4 5
0 5 10 15 20 25
q
(l/s)
Time (s)
q(A–A'): straight recagular channel
q(B–B'): straight recagular channel
q(B–B'): one-stepped channel
q(A–A'): one-stepped channel 0
1 2 3 4 5
0 5 10 15 20 25
q
(l/s)
Time (s)
q(A–A'): straight recagular channel
q(B–B'): straight recagular channel
q(B–B'): one-stepped channel
q(A–A'): one-stepped channel 0
1 2 3 4 5
0 5 10 15 20 25
q
(l/s)
Time (s)
q(A–A'): straight recagular channel
q(B–B'): straight recagular channel
q(B–B'): one-stepped channel
q(A–A'): one-stepped channel 0
1 2 3 4 5
0 5 10 15 20 25
q
(l/s)
Time (s)
q(A–A'): straight recagular channel
q(B–B'): straight recagular channel
q(B–B'): one-stepped channel
q(A–A'): one-stepped channel 0
1 2 3 4 5
0 5 10 15 20 25
q
(l/s)
Time (s)
q(A–A'): straight recagular channel
q(B–B'): straight recagular channel
q(B–B'): one-stepped channel
q(A–A'): one-stepped channel 0
1 2 3 4 5
0 5 10 15 20 25
q
(l/s)
Time (s)
q(A–A'): straight recagular channel
q(B–B'): straight recagular channel
q(B–B'): one-stepped channel
q(A–A'): one-stepped channel 0
1 2 3 4 5
0 5 10 15 20 25
q
(l/s)
Time (s)
q(A–A'): straight recagular channel
q(B–B'): straight recagular channel
q(B–B'): one-stepped channel
q(A–A'): one-stepped channel 0
1 2 3 4 5
0 5 10 15 20 25
q
(l/s)
Time (s)
q(A–A'): straight recagular channel
q(B–B'): straight recagular channel
q(B–B'): one-stepped channel
Original Paper Soil & Water Res., 10, 2015 (1): 32–39
doi: 10.17221/17/2013-SWR
channel slope, and by 21.9% smaller water flow dis-charge in the B-B' line.
In the case of Qinflow = 800 cm3/s, the one-stepped channel slope showed by 15.5% lower water flow discharge than the straight rectangular channel slope in line A–A', and by 7% lower water flow discharge in line B–B'. The sediment volume concentration graph in Figure 5 shows that in the case of the straight rec-tangular channel slope the sediment concentration gets very high and then decreases at the point right after the debris flow reaches the downstream of the channel. Because a very large amount of sediment and mixture reaches the downstream, the moment a debris flow occurs in a mountainous terrain and reaches the downstream where the damages occurred through a debris flow will be quite extensive.
On the other hand, in the case of the one-stepped channel slope, the sediment volume concentration shows a relatively gentle curve from the moment the debris flow reaches the downstream of the channel. It is perceived that in the case of the actual debris flow in mountainous terrains, because the one-stepped channel slope allows for the amount of sediment
with mixture water not to increase suddenly, it is effective in delaying the debris flow.
Numerical results for variation at the
one-stepped channel slopes. Mountainous terrains are
made up of various slopes. In order to figure out the debris flow at various slopes, in the case of the one-stepped channel slope, the water flow discharge, water flow depth, and sediment volume concentra-tion of the debris flow according to the variaconcentra-tion of the one-stepped channel slope at the downstream of the channel (line A–A' at downstream in Figure 1) were analyzed.
Here the calculation conditions were set at Qinflow = 600 cm3/s, the slope at the upstream of the channel slope with a berm at θ1 = 20°, and the slope of the downstream of the channel at θ3 = 20°. Three cases were studied for the one-stepped channel slope and these were: θ2 = 12°, 14°, and 16°. The time levels were set at t1= 20 s, t2 = 60 s, t3 = 30 s, and t4 = 0.2 s. As indicated in Figure 1, Figures 6–8 show the water flow discharge, water flow depth, and sediment volume concentration according to vari-ation in the one-stepped channel slope when the
0 1 2 3 4 5 6
0 5 10 15 20 25 0
1 2 3 4 5 6
0 5 10 15 20 25
Time (s)
0 5 10 15 20 25 30
Time (s)
0 5 10 15 20 25 30
h (c m ) 6 5 4 3 2 1 0 (b)
h(A–A'): straight rectangular channel h(B–B'): straight rectangular channel h(A–A'): one-stepped channel h(B–B'): one-stepped channel
0 1 2 3
0 5 10 15 20 25
q
(l/s)
Time (s)
q(A–A'): straight recagular channel
q(B–B'): straight recagular channel
q(B–B'): one-stepped channel
q(A–A'): one-stepped channel 0
1 2 3
0 5 10 15 20 25
q
(l/s)
Time (s)
q(A–A'): straight recagular channel
q(B–B'): straight recagular channel
q(B–B'): one-stepped channel
q(A–A'): one-stepped channel 0
1 2 3
0 5 10 15 20 25
q
(l/s)
Time (s)
q(A–A'): straight recagular channel
q(B–B'): straight recagular channel
q(B–B'): one-stepped channel
q(A–A'): one-stepped channel 0
1 2 3
0 5 10 15 20 25
q
(l/s)
Time (s)
q(A–A'): straight recagular channel
q(B–B'): straight recagular channel
q(B–B'): one-stepped channel
q(A–A'): one-stepped channel
0 1 2 3 4
0 5 10 15 20 25
q
(l/s)
Time (s)
q(A–A'): straight recagular channel
q(B–B'): straight recagular channel
q(B–B'): one-stepped channel
q(A–A'): one-stepped channel 0
1 2 3 4
0 5 10 15 20 25
q
(l/s)
Time (s)
q(A–A'): straight recagular channel
q(B–B'): straight recagular channel
q(B–B'): one-stepped channel
q(A–A'): one-stepped channel 0
1 2 3 4
0 5 10 15 20 25
q
(l/s)
Time (s)
q(A–A'): straight recagular channel
q(B–B'): straight recagular channel
q(B–B'): one-stepped channel
q(A–A'): one-stepped channel 0
1 2 3 4
0 5 10 15 20 25
q
(l/s)
Time (s)
q(A–A'): straight recagular channel
q(B–B'): straight recagular channel
q(B–B'): one-stepped channel
q(A–A'): one-stepped channel 0
1 2 3 4
0 5 10 15 20 25
q
(l/s)
Time (s)
q(A–A'): straight recagular channel
q(B–B'): straight recagular channel
q(B–B'): one-stepped channel
q(A–A'): one-stepped channel 0
1 2 3
0 5 10 15 20 25
q
(l/s)
Time (s)
q(A–A'): straight recagular channel
q(B–B'): straight recagular channel
q(B–B'): one-stepped channel
q(A–A'): one-stepped channel 0
1 2 3
0 5 10 15 20 25
q
(l/s)
Time (s)
q(A–A'): straight recagular channel
q(B–B'): straight recagular channel
q(B–B'): one-stepped channel
q(A–A'): one-stepped channel 0
1 2 3
0 5 10 15 20 25
q
(l/s)
Time (s)
q(A–A'): straight recagular channel
q(B–B'): straight recagular channel
q(B–B'): one-stepped channel
q(A–A'): one-stepped channel 0
1 2 3
0 5 10 15 20 25
q
(l/s)
Time (s)
q(A–A'): straight recagular channel
q(B–B'): straight recagular channel
q(B–B'): one-stepped channel
q(A–A'): one-stepped channel 0
1 2 3
0 5 10 15 20 25
q
(l/s)
Time (s)
q(A–A'): straight recagular channel
q(B–B'): straight recagular channel
q(B–B'): one-stepped channel
q(A–A'): one-stepped channel
[image:5.595.68.530.93.228.2](a) 6 5 4 3 2 1 0
Figure 4. Flow depth (h)at the downstream boundary of the channel according to time for Qinflow = 600 cm3/s (a) and Qinflow = 800 cm3/s (b)
Figure 5. Sediment concentration (c) at the downstream boundary of the channel according to time for Qinflow = 600 cm3/s (a)
and Qinflow = 800 cm3/s (b)
0 0.1 0.2 0.3 0.4 0.5 0.6 0.7 0.8
0 5 10 15 20 25
Time (s)
0 5 10 15 20 25 30
c 0.8 0.7 0.6 0.5 0.4 0.3 0.2 0.1 0
c(A–A'): straight rectangular channel c(B–B'): straight rectangular channel c(A–A'): one-stepped channel c(B–B'): one-stepped channel
0 1 2 3 4 5
0 5 10 15 20 25
q
(l/s)
Time (s)
q(A–A'): straight recagular channel
q(B–B'): straight recagular channel
q(B–B'): one-stepped channel
q(A–A'): one-stepped channel 0 1 2 3 4 5
0 5 10 15 20 25
q
(l/s)
Time (s)
q(A–A'): straight recagular channel
q(B–B'): straight recagular channel
q(B–B'): one-stepped channel
q(A–A'): one-stepped channel 0 1 2 3 4 5
0 5 10 15 20 25
q
(l/s)
Time (s)
q(A–A'): straight recagular channel
q(B–B'): straight recagular channel
q(B–B'): one-stepped channel
q(A–A'): one-stepped channel 0 1 2 3 4 5
0 5 10 15 20 25
q
(l/s)
Time (s)
q(A–A'): straight recagular channel
q(B–B'): straight recagular channel
q(B–B'): one-stepped channel
q(A–A'): one-stepped channel
0 1 2 3 4 5
0 5 10 15 20 25
q
(l/s)
Time (s)
q(A–A'): straight recagular channel
q(B–B'): straight recagular channel
q(B–B'): one-stepped channel
q(A–A'): one-stepped channel 0 1 2 3 4 5
0 5 10 15 20 25
q
(l/s)
Time (s)
q(A–A'): straight recagular channel
q(B–B'): straight recagular channel
q(B–B'): one-stepped channel
q(A–A'): one-stepped channel 0 1 2 3 4 5
0 5 10 15 20 25
q
(l/s)
Time (s)
q(A–A'): straight recagular channel
q(B–B'): straight recagular channel
q(B–B'): one-stepped channel
q(A–A'): one-stepped channel 0 1 2 3 4 5
0 5 10 15 20 25
q
(l/s)
Time (s)
q(A–A'): straight recagular channel
q(B–B'): straight recagular channel
q(B–B'): one-stepped channel
q(A–A'): one-stepped channel 0 1 2 3 4 5
0 5 10 15 20 25
q
(l/s)
Time (s)
q(A–A'): straight recagular channel
q(B–B'): straight recagular channel
q(B–B'): one-stepped channel
q(A–A'): one-stepped channel 0 1 2 3 4 5
0 5 10 15 20 25
q
(l/s)
Time (s)
q(A–A'): straight recagular channel
q(B–B'): straight recagular channel
q(B–B'): one-stepped channel
q(A–A'): one-stepped channel 0 1 2 3 4 5
0 5 10 15 20 25
q
(l/s)
Time (s)
q(A–A'): straight recagular channel
q(B–B'): straight recagular channel
q(B–B'): one-stepped channel
q(A–A'): one-stepped channel 0 1 2 3 4 5
0 5 10 15 20 25
q
(l/s)
Time (s)
q(A–A'): straight recagular channel
q(B–B'): straight recagular channel
q(B–B'): one-stepped channel
q(A–A'): one-stepped channel 0 1 2 3 4 5
0 5 10 15 20 25
q
(l/s)
Time (s)
q(A–A'): straight recagular channel
q(B–B'): straight recagular channel
q(B–B'): one-stepped channel
q(A–A'): one-stepped channel 0 1 2 3 4 5
0 5 10 15 20 25
q
(l/s)
Time (s)
q(A–A'): straight recagular channel
q(B–B'): straight recagular channel
q(B–B'): one-stepped channel
q(A–A'): one-stepped channel
0 0.1 0.2 0.3 0.4 0.5 0.6 0.7 0.8
0 5 10 15 20 25
Time (s)
[image:5.595.69.534.592.728.2]Soil & Water Res., 10, 2015 (1): 32–39 Original Paper
doi: 10.17221/17/2013-SWR
debris flow reaches the downstream of the channel at 30 s (t3 = 30 s). In Figure 6, as the angle of the one-stepped channel slope increases, the fluctua-tion of the amplitude increases, and a high water flow discharge distribution is shown. Also as the angle of the one-stepped channel slope increases, the bandwidth of a high amplitude fluctuation be-comes wider. Therefore this sort of analysis results will provide useful information when in the case of the one-stepped channel slope.
[image:6.595.66.291.96.232.2] [image:6.595.308.532.549.702.2]Figure 7 shows the change of the water flow depth. The high water flow depth distribution is shown at the one-stepped channel slope with θ2 = 16°, and this slope shows great differences compared to the other slopes. Because the possibility of debris flow occurrence begins at the slope of θ2 = 15°, it results in big differences of the amplitude.
Figure 8 shows the change of the sediment vol-ume concentration. In the case of the one-stepped
channel slope, the sediment volume concentration is uniform without fluctuation occurrence, and as the slope lowers, the sediment volume concentration distribution decreases. The average concentration is 3.5 at this time.
Numerical results for each point of the chan-nel. Debris flow developed at the upstream of the mountainous terrain goes through a repetition of erosion and deposition as it either passes through the downstream of a mountainous terrain or deposits into the downstream area. Therefore, water flow discharge, water flow depth, and sediment volume concentration of debris flow at each point in the cases of the straight rectangular channel slope and the one-stepped channel slope were analyzed. The investigation point is as shown in Figure 1 and the calculation condition was set at Qinflow = 600 cm3/s. Figure 9 shows the water flow discharge and water flow depth. In the case of the straight rectangular channel slope (Figure 9b), as the debris flow reaches downstream, the water flow discharge and water flow depth increase. This is because when debris flow develops at the upstream of the channel, erosion caused by debris flow occurs more than deposition and thus it flows to the downstream of the channel. On the other hand, in the case of the one-stepped channel slope (Figure 9a) the debris flow occurs at the upstream of the channel, and water flow dis-charge fluctuation occurs after 12 s. The amount of water flow discharge and water flow depth at the one-stepped channel slope is significantly lower than the amount at the straight rectangular channel slope. This means that erosion can be reduced at the one-stepped channel. 0 1 2 3 4 5
0 5 10 15 20 25
Time (s)
0 5 10 15 20 25 30
q (l/s) 5 4 3 2 1 0
θ2 = 16° θ2 = 14° θ2 = 12°
0 1 2 3 4 5
0 5 10 15 20 25
q
(l/s)
Time (s)
q(A–A'): straight recagular channel
q(B–B'): straight recagular channel
q(B–B'): one-stepped channel
q(A–A'): one-stepped channel 0 1 2 3 4 5
0 5 10 15 20 25
q
(l/s)
Time (s)
q(A–A'): straight recagular channel
q(B–B'): straight recagular channel
q(B–B'): one-stepped channel
q(A–A'): one-stepped channel 0 1 2 3 4 5
0 5 10 15 20 25
q
(l/s)
Time (s)
q(A–A'): straight recagular channel
q(B–B'): straight recagular channel
q(B–B'): one-stepped channel
q(A–A'): one-stepped channel 0 1 2 3 4 5
0 5 10 15 20 25
q
(l/s)
Time (s)
q(A–A'): straight recagular channel
q(B–B'): straight recagular channel
q(B–B'): one-stepped channel
q(A–A'): one-stepped channel 0 1 2 3 4 5
0 5 10 15 20 25
q
(l/s)
Time (s)
q(A–A'): straight recagular channel
q(B–B'): straight recagular channel
q(B–B'): one-stepped channel
q(A–A'): one-stepped channel 0 1 2 3 4 5
0 5 10 15 20 25
q
(l/s)
Time (s)
q(A–A'): straight recagular channel
q(B–B'): straight recagular channel
q(B–B'): one-stepped channel
q(A–A'): one-stepped channel 0 1 2 3 4 5
0 5 10 15 20 25
q
(l/s)
Time (s)
q(A–A'): straight recagular channel
q(B–B'): straight recagular channel
q(B–B'): one-stepped channel
q(A–A'): one-stepped channel 0 1 2 3 4 5
0 5 10 15 20 25
q
(l/s)
Time (s)
q(A–A'): straight recagular channel
q(B–B'): straight recagular channel
q(B–B'): one-stepped channel
q(A–A'): one-stepped channel 0 1 2 3 4 5
0 5 10 15 20 25
q
(l/s)
Time (s)
q(A–A'): straight recagular channel
q(B–B'): straight recagular channel
q(B–B'): one-stepped channel
q(A–A'): one-stepped channel 0 1 2 3 4 5
0 5 10 15 20 25
q
(l/s)
Time (s)
q(A–A'): straight recagular channel
q(B–B'): straight recagular channel
q(B–B'): one-stepped channel
q(A–A'): one-stepped channel
Figure 6. Water flow discharge (q) at the downstream boun-dary of the channel by variance of the one-stepped channel slope with Qinflow = 600 cm3/s according to time for A–A' line
Figure 7. Flow depth (h) at the downstream boundary of the channel by variance of the one-stepped channel slope with Qinflow = 600 cm3/s according to time for A–A' line
0 1 2 3 4 5 6
0 5 10 15 20 25
Time (s)
0 5 10 15 20 25 30
h (lc m) 6 5 4 3 2 1 0
θ2 = 16° θ2 = 14° θ2 = 12°
0 1 2 3 4 5
0 5 10 15 20 25
q
(l/s)
Time (s)
q(A–A'): straight recagular channel
q(B–B'): straight recagular channel
q(B–B'): one-stepped channel
q(A–A'): one-stepped channel 0 1 2 3 4 5
0 5 10 15 20 25
q
(l/s)
Time (s)
q(A–A'): straight recagular channel
q(B–B'): straight recagular channel
q(B–B'): one-stepped channel
q(A–A'): one-stepped channel 0 1 2 3 4 5
0 5 10 15 20 25
q
(l/s)
Time (s)
q(A–A'): straight recagular channel
q(B–B'): straight recagular channel
q(B–B'): one-stepped channel
q(A–A'): one-stepped channel 0 1 2 3 4 5
0 5 10 15 20 25
q
(l/s)
Time (s)
q(A–A'): straight recagular channel
q(B–B'): straight recagular channel
q(B–B'): one-stepped channel
q(A–A'): one-stepped channel 0 1 2 3 4 5
0 5 10 15 20 25
q
(l/s)
Time (s)
q(A–A'): straight recagular channel
q(B–B'): straight recagular channel
q(B–B'): one-stepped channel
q(A–A'): one-stepped channel 0 1 2 3 4 5
0 5 10 15 20 25
q
(l/s)
Time (s)
q(A–A'): straight recagular channel
q(B–B'): straight recagular channel
q(B–B'): one-stepped channel
q(A–A'): one-stepped channel 0 1 2 3 4 5
0 5 10 15 20 25
q
(l/s)
Time (s)
q(A–A'): straight recagular channel
q(B–B'): straight recagular channel
q(B–B'): one-stepped channel
q(A–A'): one-stepped channel 0 1 2 3 4 5
0 5 10 15 20 25
q
(l/s)
Time (s)
q(A–A'): straight recagular channel
q(B–B'): straight recagular channel
q(B–B'): one-stepped channel
q(A–A'): one-stepped channel 0 1 2 3 4 5
0 5 10 15 20 25
q
(l/s)
Time (s)
q(A–A'): straight recagular channel
q(B–B'): straight recagular channel
q(B–B'): one-stepped channel
q(A–A'): one-stepped channel 0 1 2 3 4 5
0 5 10 15 20 25
q
(l/s)
Time (s)
q(A–A'): straight recagular channel
q(B–B'): straight recagular channel
q(B–B'): one-stepped channel
q(A–A'): one-stepped channel
Figure 8. Sediment concentration (c) at the downstream boundary of the channel by variance of the one-stepped channel slope with Qinflow = 600 cm3/s according to time
for A–A' line
0 0.1 0.2 0.3 0.4 0.5 0.6 0.7 0.8
0 5 10 15 20 25
Time (s)
0 5 10 15 20 25 30
c 0.8 0.7 0.6 0.5 0.4 0.3 0.2 0.1 0
θ2 = 16° θ2 = 14° θ2 = 12°
0 1 2 3 4 5
0 5 10 15 20 25
q
(l/s)
Time (s)
q(A–A'): straight recagular channel
q(B–B'): straight recagular channel
q(B–B'): one-stepped channel
q(A–A'): one-stepped channel 0 1 2 3 4 5
0 5 10 15 20 25
q
(l/s)
Time (s)
q(A–A'): straight recagular channel
q(B–B'): straight recagular channel
q(B–B'): one-stepped channel
q(A–A'): one-stepped channel 0 1 2 3 4 5
0 5 10 15 20 25
q
(l/s)
Time (s)
q(A–A'): straight recagular channel
q(B–B'): straight recagular channel
q(B–B'): one-stepped channel
q(A–A'): one-stepped channel 0 1 2 3 4 5
0 5 10 15 20 25
q
(l/s)
Time (s)
q(A–A'): straight recagular channel
q(B–B'): straight recagular channel
q(B–B'): one-stepped channel
q(A–A'): one-stepped channel 0 1 2 3 4 5
0 5 10 15 20 25
q
(l/s)
Time (s)
q(A–A'): straight recagular channel
q(B–B'): straight recagular channel
q(B–B'): one-stepped channel
q(A–A'): one-stepped channel 0 1 2 3 4 5
0 5 10 15 20 25
q
(l/s)
Time (s)
q(A–A'): straight recagular channel
q(B–B'): straight recagular channel
q(B–B'): one-stepped channel
q(A–A'): one-stepped channel 0 1 2 3 4 5
0 5 10 15 20 25
q
(l/s)
Time (s)
q(A–A'): straight recagular channel
q(B–B'): straight recagular channel
q(B–B'): one-stepped channel
q(A–A'): one-stepped channel 0 1 2 3 4 5
0 5 10 15 20 25
q
(l/s)
Time (s)
q(A–A'): straight recagular channel
q(B–B'): straight recagular channel
q(B–B'): one-stepped channel
q(A–A'): one-stepped channel 0 1 2 3 4 5
0 5 10 15 20 25
q
(l/s)
Time (s)
q(A–A'): straight recagular channel
q(B–B'): straight recagular channel
q(B–B'): one-stepped channel
q(A–A'): one-stepped channel 0 1 2 3 4 5
0 5 10 15 20 25
q
(l/s)
Time (s)
q(A–A'): straight recagular channel
q(B–B'): straight recagular channel
q(B–B'): one-stepped channel
[image:6.595.65.290.550.711.2]Original Paper Soil & Water Res., 10, 2015 (1): 32–39
doi: 10.17221/17/2013-SWR
CONCLUSION
Frequent rain and heavy rainfall cause debris flow in mountainous terrains with many slopes, bringing about casualties and property damages. Such disas-ters due to debris flow have continuously increased due to urbanization and reckless development in mountainous terrains. Therefore the purpose of this study was to verify the behaviour and mechanism of debris flow on various slopes. The water flow discharge, the water flow depth, and the sediment volume concentration of debris flow in the cases of the straight rectangular channel slope and the one-stepped channel slope were analyzed and compared. Numerical simulation was performed using the Finite Difference Element Method based on the equation of mass conservation and momentum conservation.
When the supply water flow discharge is low at the straight rectangular channel slope, the water flow discharge and water flow depth only surge right after the debris flow reaches the downstream of the channel and after a few seconds it appears to recede and low fluctuation is produced.
Whereas when the supply water flow discharge increases, the curve of the water flow discharge and water flow depth becomes unstable, and water flow discharge and water flow depth occur at an unstable and high fluctuation. This implies that in the down-stream channel of mountainous terrains that are in heavy rainfall areas, high and unstable fluctuation is the reason behind the increase of damages occurring by such disasters. In the case of the one-stepped channel slope, low water flow discharge and low water flow depth distribution begin and build up gradually. Using the RMS ratio, in the case of Qinflow = 600 cm3/s, at line A–A' of the channel, the one-stepped slope shows by 30.9% lower water flow discharge than the straight
rectangular channel slope, and by 21.9% smaller water flow discharge in line B–B'. In the case of Qinflow = 800 cm3/s, the one-stepped channel slope showed by 15.5% lower water flow discharge than the straight rectangular channel slope in line A–A' and by 7% lower water flow discharge in line B–B'.
The sediment volume concentration graph in Fig-ure 5 shows that in the case of the straight rectangular channel slope the sediment volume concentration gets very high and then decreases at the point right after the debris flow reaches the downstream of the channel. Because a very large amount of sediment and mixture reaches the downstream, the interval between the debris flow is formed in a mountainous terrain and reaches the downstream causing damages through a debris flow is quite long.
In the case of the one-stepped channel slope, the sediment volume concentration shows a relatively gentle curve. It is perceived that in the case of the actual debris flow in mountainous terrains, because the one-stepped channel slope allows for the amount of sediment with mixture water not to increase sud-denly, it is effective in delaying the debris flow. As the angle of the one-stepped channel slope increases, the fluctuation of the amplitude increases and a high water flow discharge distribution is shown. Also as the angle of the one-stepped channel slope increases, the bandwidth of a high amplitude fluctuation becomes wider. High water flow depth distribution is shown at the one-stepped channel slope of θ2 = 16°, and this slope shows great differences in comparison to other slopes. Because the possibility of debris flow occurrence begins at the slope of θ2 = 15°, it results in notable differences in the amplitude.
[image:7.595.65.535.92.234.2]In the investigation of each point, in the case of the straight rectangular channel, the water flow dis-charge and water flow depth increased as the debris
Figure 9. Water flow discharge (q) at the line of the channel slope with Qinflow = 600 cm3/s according to time for one-
stepped channel slope (a) and straight rectangular channel slope (b)
0 1 2 3 4 5
0 5 10 15 20 25 0
1 2 3 4 5
0 5 10 15 20 25
Time (s)
0 5 10 15 20 25 30
Time (s)
0 5 10 15 20 25 30
q
(l/s)
5
4
3
2
1
0
5
4
3
2
1
0
(a) q(A–A') (b)
q(C–C') q(D–D') q(E–E')
0 1 2 3 4
0 5 10 15 20 25
q
(l/s)
Time (s)
q(A–A'): straight recagular channel
q(B–B'): straight recagular channel
q(B–B'): one-stepped channel
q(A–A'): one-stepped channel 0
1 2 3 4
0 5 10 15 20 25
q
(l/s)
Time (s)
q(A–A'): straight recagular channel
q(B–B'): straight recagular channel
q(B–B'): one-stepped channel
q(A–A'): one-stepped channel 0
1 2 3 4
0 5 10 15 20 25
q
(l/s)
Time (s)
q(A–A'): straight recagular channel
q(B–B'): straight recagular channel
q(B–B'): one-stepped channel
q(A–A'): one-stepped channel 0
1 2 3 4
0 5 10 15 20 25
q
(l/s)
Time (s)
q(A–A'): straight recagular channel
q(B–B'): straight recagular channel
q(B–B'): one-stepped channel
q(A–A'): one-stepped channel
0 1 2 3 4 5
0 5 10 15 20 25
q
(l/s)
Time (s)
q(A–A'): straight recagular channel
q(B–B'): straight recagular channel
q(B–B'): one-stepped channel
q(A–A'): one-stepped channel 0
1 2 3 4 5
0 5 10 15 20 25
q
(l/s)
Time (s)
q(A–A'): straight recagular channel
q(B–B'): straight recagular channel
q(B–B'): one-stepped channel
q(A–A'): one-stepped channel 0
1 2 3 4 5
0 5 10 15 20 25
q
(l/s)
Time (s)
q(A–A'): straight recagular channel
q(B–B'): straight recagular channel
q(B–B'): one-stepped channel
q(A–A'): one-stepped channel 0
1 2 3 4 5
0 5 10 15 20 25
q
(l/s)
Time (s)
q(A–A'): straight recagular channel
q(B–B'): straight recagular channel
q(B–B'): one-stepped channel
q(A–A'): one-stepped channel 0
1 2 3 4 5
0 5 10 15 20 25
q
(l/s)
Time (s)
q(A–A'): straight recagular channel
q(B–B'): straight recagular channel
q(B–B'): one-stepped channel
q(A–A'): one-stepped channel 0
1 2 3
0 5 10 15 20 25
q
(l/s)
Time (s)
q(A–A'): straight recagular channel
q(B–B'): straight recagular channel
q(B–B'): one-stepped channel
q(A–A'): one-stepped channel 0
1 2 3
0 5 10 15 20 25
q
(l/s)
Time (s)
q(A–A'): straight recagular channel
q(B–B'): straight recagular channel
q(B–B'): one-stepped channel
q(A–A'): one-stepped channel 0
1 2 3
0 5 10 15 20 25
q
(l/s)
Time (s)
q(A–A'): straight recagular channel
q(B–B'): straight recagular channel
q(B–B'): one-stepped channel
q(A–A'): one-stepped channel 0
1 2 3
0 5 10 15 20 25
q
(l/s)
Time (s)
q(A–A'): straight recagular channel
q(B–B'): straight recagular channel
q(B–B'): one-stepped channel
q(A–A'): one-stepped channel 0
1 2 3
0 5 10 15 20 25
q
(l/s)
Time (s)
q(A–A'): straight recagular channel
q(B–B'): straight recagular channel
q(B–B'): one-stepped channel
Soil & Water Res., 10, 2015 (1): 32–39 Original Paper
doi: 10.17221/17/2013-SWR
flow reached the downstream of the channel. This is because when the debris flow was developed at the upstream of the channel, erosion caused by debris flow was greater than the deposition and thus it flowed to the downstream. On the other hand, in the case of the one-stepped channel slope, the amount of water flow discharge and water flow depth was higher than the amount at the straight rectangular channel slope. This means that erosion can be re-duced at the one-stepped channel.
The results from this study will provide useful information in predicting disaster caused by debris flow at the downstream of a steep mountain slope depending on changing rainfall. It will also provide useful information when planning various counter measures to prevent debris flow disasters at moun-tainous areas with various slopes.
References
Armanini A., Gregoretti C. (2000): Triggering of debrisflow by overland flow: A comparison between theoretical and experimental results. In: Naeser N.D., Wieczorek G.F. (eds): Proc. 2nd Int. Conf. Debris-Flow Hazards
Mitiga-tion: Mechanics, Prediction, and Assessment, Taipei, Aug 16−18, 2000: 117–124.
Chen C.L., Ling C.H. (2000): Fully developed snout profiles of noncohesive debris-flow with internal friction. In: Naeser N.D., Wieczorek G.F. (eds): Proc. 2nd Int. Conf.
Debris-Flow Hazards Mitigation: Mechanics, Prediction, and Assessment, Taipei, Aug 16−18, 2000: 335–344. Denlinger R.P., Iverson R.M. (2001): Flow of variably
fluid-ized granular masses across three-dimensional terrain,
numerical predictions and experimental tests. Journal of Geophysical Research, 106 (B1): 553–566.
Egashira S., Miyamoto K., Itoh T. (1997): Constitutive equa-tion of debris flow and their applicability. In: Chen C.I. (ed.): 1st Int. Conf. Debris-Flow Hazards Mitigation:
Mechanics, Prediction, and Assessment, San Francisco, Aug 7–9, 1997: 340–349.
Ghilardi P., Natale L., Savi F. (2001): Modelling debris flow propagation and deposition. Physics and Chemistry of the Earth, 26: 651–656.
Nakagawa H., Satofuka Y., Takahama J. (2002): Water In-duced Hazard – I. Lalitpur, Institute of Engineering: 1–40. O’Brien J.S., Julien P.Y., Fullerton W.T. (1993): Two-dimen-sional water flood and mudflow simulation. Journal of Hydraulic Engineering, 119: 244–266.
Savage S.B., Hutter K. (1997): The dynamics of avalanches of granular materials from initiation to runout. Part I. Analysis. Acta Mechanica, 86: 201–223.
Takahashi T. (2000): Initiation of debris flow of various types of debris flow. In: Naeser N.D., Wieczorek G.F. (eds): Proc. 2nd Int. Conf. Debris-Flow Hazards
Mitiga-tion: Mechanics, Prediction, and Assessment, Taipei, Aug 16−18, 2000: 15–25.
Takahashi T. (2007): Debris Flow: Mechanics, Prediction and Countermeasures. Tokyo, Taylor & Francis/Balkema. Takahashi T., Nakagawa H., Harada T., Yamashiki Y. (1992): Routing debris flows with particle segregation. Journal of Hydraulic Engineering, 118: 1490–1507.
Received for publication March 11, 2013 Accepted after corrections May 26, 2014
Corresponding author: