©
DOI: 10.1534/genetics.104.030338
The Amplification Model for Adaptive Mutation: Simulations and Analysis
Mats E. Pettersson,* Dan I. Andersson,
†John R. Roth
‡and Otto G. Berg*
,1*Department of Molecular Evolution, Uppsala University EBC, SE-75236 Uppsala, Sweden,†Microbiology and Tumour Biology Center, Karolinska Institute and Department of Bacteriology, Swedish Institute for Infectious Disease Control, SE-171 82, Solna,
Sweden and‡Microbiology Section/DBS, University of California, Davis, California 95616
Manuscript received April 22, 2004 Accepted for publication October 25, 2004
ABSTRACT
It has been proposed that thelacrevertants arising under selective conditions in the Cairns experiment do not arise by stress-induced mutagenesis of stationary phase cells as has been previously assumed. Instead, these revertants may arise within growing clones initiated by cells with a preexisting duplication of the weakly functionallac allele used in this experiment. It is proposed that spontaneous stepwise increases inlaccopy number (amplification) allow a progressive improvement in growth. Reversion is made more likely primarily by the resultant increase in the number of mutational targets—more cells with morelaccopies. The gene amplification model requires no stress-induced variation in the rate or target specificity of mutation and thus does not violate neo-Darwinian theory. However, it does require that a multistep process of amplification, reversion, and amplification segregation be completed withinⵑ20 generations of growth. This work examines the proposed amplification model from a theoretical point of view, formalizing it into a mathematical framework and using this to determine what would be required for the process to occur within the specified period. The analysis assumes no stress-induced change in mutation rate and describes only the growth improvement occurring during the process of amplification and subsequent elimination of excess mutant laccopies. The dynamics of the system are described using Monte Carlo simulations and numerical integration of the deterministic equations governing the system. The results imply that the amplification model can account for the behavior of the system using biologically reasonable parameter values and thus can, in principle, explain Cairnsian adaptive mutation.
I
n the neo-Darwinistic paradigm (Mayr1982), muta- growing sufficiently to account for the observed re-vertants.tions are thought to occur at random without regard
Three main models have been suggested to explain to selective consequence and their formation is not
these results. The first two, directed mutation and hyper-thought to be purposefully regulated. Thus great
inter-mutable states (described below), assume that revertants est was generated by systems whose behavior suggested
arise as single-step mutations in this nongrowing lawn that selective stress might either direct mutation to sites
of parental cells. The directed mutation model proposes that improve growth (Cairns et al. 1988; Cairns and
(Cairns et al.1988;Cairns andFoster 1991;Foster Foster1991) or increase the undirected general
muta-andCairns1992) that mutations are somehow directed tion rate (Torkelsonet al.1997). The system generally
to sites that improve growth or to the F⬘-plasmid that used (CairnsandFoster1991) employsEscherichia coli
carries thelacmutation. This model became less attrac-cells with thelacoperon deleted from the chromosome
tive after it was found thatlacrevertants (but not the parent orSalmonella entericacells, whose genome does not
in-lawn) had experienced general (undirected) mutagenesis clude alacregion (GalitskiandRoth1995;
Anders-under selective conditions (Torkelsonet al. 1997).
An-sonet al.1998;Hendricksonet al.2002;Slechtaet al.
other model, the hypermutable state model (Hall1990), 2003). These cells carry, on plasmid F⬘128, a copy of the
suggests that a small fraction of cells under stress enter
lacoperon with a ⫹1 frameshift mutation that leaves
a hypermutable state that is characterized by a high cells phenotypically Lac⫺. When spread on plates with
random mutation rate. This model was supported super-only lactose as a carbon source, these cells yield Lac⫹
ficially by the observation that at least somelacrevertants revertant colonies at a rate several orders of magnitude
had an average 20- to 50-fold increase in the probability faster than expected. The lawn of parental cells
(be-of carrying associated unselected mutations (
Torkel-tween visible revertant colonies) is neither dying nor
sonet al.1997;Rosche andFoster1999;Slechtaet al.2002b). The nonrevertant parent population showed very little increase in the frequency of associated
muta-1Corresponding author:Department of Molecular Evolution, Uppsala
tions (Bullet al. 2001). Recent calculations (Roth et University EBC, Norbyva¨gen 18C, SE-75236 Uppsala, Sweden.
E-mail: [email protected] al.2003), however, show that the hypermutable state
model cannot explain the number of revertants arising cell, selection will strongly favor cells with increasing copy number and such cells will accumulate in microcol-in Cairns’ experiment without an microcol-increase microcol-in mutation
rate (ⵑ105-fold), much greater than that observed (20- onies and provide an increasing target for reversion
(added cells, each with multiplelaccopies), explaining to 50-fold). The hypermutable state model became even
more problematic when it was found that mutagenesis the high number of revertants. The model presumes that while amplification of lac improves growth, other genes was uneven and might affect as few as 10% of the
re-vertants; that is, 90% seem to arise with little or no that may be included are deleterious when amplified. Therefore, once a lac⫹ reversion event has occurred in general mutagenesis.
A third model (amplification mutagenesis) assumes onelaccopy, selection will favor retention of that copy and loss of nonrevertant copies.
that reversion does not occur in the non-growing parent
population, but rather within growing clones, initiated The two aspects of the amplification model that are hardest to visualize intuitively are (1) the origin of thelac
by cells with a duplication of the mutant lac region,
which retains some weak functionality (Andersson et duplications in the unselected preselection population and (2) how the complicated process of amplification,
al.1998;Hendricksonet al.2002;Slechtaet al.2003).
In this model, growth improves as unequal recombina- reversion, and segregation can be completed within as few as 20 cell generations. It has been proposed that tion adds morelaccopies and, concomitantly, the
proba-bility of a reversion (⫺1 frameshift) event increases due the process is accelerated because thelacoperon used in the Cairns system is located on an F⬘plasmid whose to an increase in lac copy number within developing
clones. Importantly, this model requires no change in conjugational replication origin produces DNA ends that stimulate recombination and thereby make the un-either specificity or rate of mutagenesis but relies on
standard genetic events. The phenomenon requires that derlying events more frequent (Slechtaet al.2002a). the particularlacmutation is slightly leaky (Andersson
et al.1998) and that lactose be present in the selection
MODELS
medium (FosterandCairns1992). Evidence that
am-plification and growth precede reversion in the Cairns We have formalized the amplification model into a mathematical framework. Our models cover the process experiment has been presented elsewhere (
Hendrick-sonet al.2002;Slechtaet al.2002a,b). of forming a colony from a single cell. This allows quanti-tative assessment of the amplification model and shows It should be noted that the amplification model
de-scribed here shares features with two previous theoreti- which requirements must be fulfilled under the condi-tions present in the Cairns system. The models used are cal explanations for directed mutation (Lenski et al.
1989): (1) Counterselection of revertants prior to plat- described in detail below.
Preexisting mutations:Two parameters affect the fre-ing is included in the sense that duplications are
unsta-ble and therefore are present in low frequency in the quency of neutral duplications in a population, the rate at which new duplications occur and the rate at which absence of selection and (2) existence of intermediate
states prior to actual reversion is included in the form they are lost due to recombination. The formation of the first duplication is based on the exchange between of cells carrying an amplified lac region. The model
described here adds to those suggestions a succession short repeats and is a relatively low probability event. Further increases in copy numbers as well as loss occur of increasingly fit intermediates, which appear along
the way to full reversion. much more readily by recombination between extensive perfect sequence repeats. In an unselected growing pop-Genome-wide general mutagenesis, which occurs in
the course of reversion, was interpreted as support for ulation, the frequency of neutral duplications is ex-pected to come to quasi-equilibrium, where formation the hypermutable state model. However, this associated
mutagenesis makes a small (4-fold) contribution to lac and loss due to recombination balance out. Thus, the duplications will not be subject to Luria-Delbruck fluc-revertant number—a minor factor compared to growth
and amplification (a 104-fold effect). This mutagenesis tuation, which assumes no loss of mutations. Fixation
of a duplication is all but impossible because the loss occurs only in clones (10 or 20% of the total) whose
lacamplification includes thedinBgene, which encodes rate significantly exceeds the formation rate.
Previous estimates suggest that the steady-state dupli-an error-prone DNA polymerase (RoscheandFoster
1999;Slechtaet al.2003). In the modeling presented cation frequency for a typical particular chromosomal locus isⵑ10⫺3but frequencies vary widely from one site
here, this mutagenesis is largely ignored, since it is
nei-ther necessary nor sufficient to explain the behavior of to another (AndersonandRoth1981). The amplifica-tion model predicts that if no new duplicaamplifica-tions arise in the system. That is, the basic amplification model is
tested. the nongrowing parent population, the frequency in the plated population will set an upper limit on the In the amplification model, cells with a duplication
of the frameshift mutant allele allow very slow growth number of revertant colonies that can appear under selection. However, since the haploid population often on lactose. Because growth rate will be essentially
Fos-terandCairns1992;Foster1994), it is possible that a few new duplications could be added after plating. Furthermore, it is currently uncertain whether all dupli-cations are suitable for amplification; it appears likely that the process will be affected by which surrounding genes are included in the duplication.
Adaptive amplification: The formalized model
in-cludes two types of genetic events occurring in growing cells within developing colonies: increase or decrease in the number oflaccopies by recombination and cor-rection of the mutantlacallele (i.e., reversion tolac⫹) by a frameshift mutation. It should be stressed that the copy number actually refers to the number oflaccopies
per plasmid in each cell, and thus the fundamental Figure1.—The fitness of cells plotted against copy number,
under different load models. The first pair of curves uses a
event in the model is replication of one plasmid. In
linear load (x ⫽ 1) and the second pair a high-order load
most cases, it makes no difference whether there is more
(x⫽5). All curves usey⫽0.03 andl⫽0.005.
than one plasmid in each cell, as they replicate sepa-rately. However, plasmid growth is determined by the growth rate of the cell, which is, in turn, determined
plasmid,n, and the rate of mutation (lac⫺tolac⫹) per by the total number oflac copies present in the cell.
laccopy,krev: Thus, the contribution to cell growth from eachlaccopy
should be multiplied by the F⬘copy number. Also, the
vrec(n)⫽ prec· (n⫺1)
1⫹prec· (n⫺ 1) (1) reversion probability calculated per cell, rather than per
plasmid, requires the reversion rate to be scaled in the
vrev(n)⫽krev·n. (2)
same way.
Recombination is assumed to be equally probable The fitness,w, of a mutant cell depends on itslaccopy between all repeated units and to occur at a constant number, a selection parameter,y, and two load parame-intrinsic recombination rate. The probability of a rever- ters,landx, which combine to reflect the cost of carry-sion event (frameshift mutation) is, similarly, propor- ing excess copies. The y term reflects the amount of tional to the copy number of the mutantlacallele per -galactosidase produced by a mutant copy, multiplied plasmid; this rate constant is the probability of mutation by the copy number of the F⬘-plasmid. This parameter perlaccopy per cell division. does not affect reverted cells, which are given a fitness This is put in a framework of an exponentially growing of 1 minus the load from excess mutant copies, should population, starting with a single duplication-bearing they be present. Thus, the fitness for mutant and re-cell. This starting condition follows from the way bacte- vertant cells is, respectively,
rial colonies form on plates. Since the initial culture is
spread out and immobilized on a selective plate, every w(n)⫽ y·n
1⫹y·n⫺(l·n)
x
colony is derived from a single ancestor cell. Because initial formation of a duplication is very slow, and
mech-wrev(n)⫽1⫺(l·n)x. (3)
anistically different, the relevant cells are those carrying
a duplication when put on the plate. The fitness of any The shape of these fitness curves as a function of copy number is shown in Figure 1.
given cell is a function of its number of the (partially
functional) mutantlac copies. Also noteworthy, death Recombination events will often, although not always, yield daughter cells with copy number different from is not explicitly modeled in the system. This
simplifica-tion is justified by the low likelihood of cell death in an that of the mother. In the present model, the copy number of one daughter cell remains unchanged. If exponential population and the typically large number
of cells present (Foster 1994). When its rate is low, recombination is treated as reciprocal, every recombina-tion event causing a change will yield one cell with death would have a major influence only if the original
cell, or the first revertant, died before giving rise to any higher copy number than the original (which will im-prove growth in the early stages) and one with lower descendants, either of which is very unlikely.
The recombination rate per cell division, vrec, is a copy number (which will grow less well). However, simu-lations show that this is essentially the same as using a function of the copy number,n, and the intrinsic
proba-bility of recombination between two copies, prec. The higherprec. Thus, for simplicity, we consider the mother cell to remain constant after recombination in all mod-form of this function (Equation 1) is chosen so that
the rate of recombination never exceeds one per cell els used. Given that the original copy number is m, the resulting copy number,n, after recombination is a division. Similarly, the rate of reversion per cell division,
of the systemat any particular time can be specified by the numbers of cells,Nm, that carrym(m⫽1, 2, 3 . . .)lac
copies. The simulation is a random walk through state space, where the direction of movement is governed by the relative rates away from the current state. These rates are calculated from the model formulas described above. The walk proceeds for a given number of steps, and the states visited along the way provide the output of the method. Each simulated walk gives one possible realization of the process. The expected behavior of the Figure2.—Possible recombination events for a three-copy
system can be determined by studying a number of such
cell. The solid arrows show the possible events that result in
realizations. For each step in the walk, one new cell is
a three- to four-copy transition. The shaded arrows show the
added and the kind of event that occurs is determined
remaining seven possible events. Together, they cover all nine
possibilities. From the solid arrows it can be seen that the as follows:
sequence of the four-copy cell will be either a-b/a⬘-b⬘-c⬘ or
a-b-c/b⬘-c⬘. 1. One cell from the population is chosen for replica-tion. This is achieved by calculating the fraction of the total population fitness possessed by each cell, which is then equal to the probability that that cell
p(n|m)⫽(2m⫺ n)
m2 ifn ⱖm (4) will be the replicant. The probability that the
replicat-ing cell hasn copies is
p(n|m)⫽ n
m2 ifn⬍m. (5)
prep(n)⫽ Nn·w(n)
兺
i⫽nmaxi⫽1 Ni·w(i)
, (7)
These equations represent the number of paths of
length n that can be obtained when combining two whereNnis the current number of cells withncopies
strings of lengthmwith a single link placed at any step on andnmaxis the highest copy number present. either string, divided by the total number of obtainable 2. Then the features of the newly created daughter cell paths. As an example, consider a transition from three to are calculated. The probability of recombination is four copies (Figure 2). Obviously, two paths are possible equal to vrec(n) from Equation 1, nbeing the copy (solid arrows), and it is readily realized that there is one number of the mother cell. If recombination occurs, path for a three- to five-copy recombination, there are the resulting copy number is sampled from the distri-two paths for a three-to-distri-two transition, etc. It is also bution given by Equations 4 and 5.
obvious that there are nine possible events, as there are 3. Finally it is determined whether or not a reversion three targets for each of the three starting positions has occurred. The probability for this event is propor-(shaded arrows). A generalization of this example will tional to the number, n, of laccopies and given by yield the Equations 4 and 5 above. Using this, the total Equation 2.
rate of changein the number,Nn(t), of cells that carryn
The process above is then repeated for as long as the
laccopies due to recombination events in all cells can
simulation runs, adding a new cell each round. be calculated as
Numerical integration:Numerical calculations can be performed in several ways. Here we use a simple Euler
rrec(n,t)⫽
兺
m⫽n
m⫽(n/2) orm⫽(n/2)⫹(1/2) Nm(t) ·
(2m⫺n) · vrec(m)
m2 scheme, calculating the population state in the next
time step as the previous state plus the time step times the derivative, or rate of change. That is, the number
⫹ m
兺
⫽∞m⫽n⫹1 Nm(t) ·
n·vrec(m)
m2 . (6)
of cells in classn,i.e., withn lac copies, at timet⫹ ⌬t
will be
rrec(n, t) is the weighted sum of the contributions from all cells. Cells with copy number lower than or equal to
Nn(t⫹ ⌬t)⫽Nn(t)⫹
dNn(t)
dt ·⌬t. (8)
n (m ⱕ n) must have more than n/2 copies, or they cannot contribute a daughter cell withn copies. Thus
the summation starts at the first productive state. The The time derivative will include a term for growth and another term for recombination. The growth term is summation to infinity may look problematic, but,
be-cause of the load constraints put upon the system (Fig- based on the fitness formula (Equation 3) used in the Monte Carlo simulations. The recombination term de-ure 1), all terms above a limit given by the constants
will be zero, eliminating the problem. pends on the intrinsic recombination rate, the number of cells in other classes, and the probabilities that
recom-Monte Carlo simulations: Monte Carlo methods in
a daughter cell withncopies after a recombination event to a relevant time measure, to understand the behavior of the model. Two types of timescales have been used: follows Equations 4 and 5. Finally there is a mutational
flow from the mutant to the wild type, slowly seeding
Generation timescale: The most natural timescale is to the revertant population.
measure the number of cells present in the popula-The fully deterministic approach has the drawback
tion, as the number of divisions that have occurred of producing fractional cells, in particular fractional
is central to both recombination and reversion events. revertant cells, which can seriously disrupt the
calcula-However, the raw number of cells is not very intuitive tions. Because of its rapid growth, such a fractional
and it quickly becomes unwieldy. Instead the 2-loga-revertant cell could quickly overtake the population even
rithm of the number of cells is used, as that is the though the probability that a reversion really has
oc-same as the number of generations the colony would curred may be very small. This can be alleviated in a
have passed through, had all cells grown equally fast. quasi-deterministic description by adding a simulation
This is not the case, of course, but it is a representation element that uses the rate of production of revertants
of the average age of the cells. as the probability to stochastically yield a “real” revertant
Real timescale: While it is very convenient to allow the as well as imposing some restrictions to allow growth
number of cells in the colony to constitute the time-only in states containing at least one cell. Thus, one
scale, it has drawbacks when the model needs to be can use the numerical analysis as a way to calculate the
correlated with experimental data. One can trans-probability of reversion as a function of time.
Further-form the generation timescale into a real timescale more, this can be used to obtain the probability that
by introducing a wild-type growth rate, 0
(genera-reversion has occurred at a given time point.
tions per day), and using this to scale the fitness for-Since the probability that reversion occurs during
mula, Equation 3. Thus, the growth rate of a cell with division of a cell with a given copy number is constant
n copies can be expressed as (per copy) throughout the simulation, it is
straightfor-ward to calculate the total reversion probability over (n)⫽
0·w(n) . (13)
each time step; all that needs to be determined is the
On the other hand, it would also be possible to do the number of cells that replicated during the step, for each
reverse. By slightly changing the experimental setup, copy number. The reversion probability, over a given
one could measure the number of cells in revertant step, for the class withn copies, where⌬Nncells
repli-colonies and use such data to correlate to the model. cate, is
This would be preferable, as it eliminates some
unneces-qrev(n)⫽ ⌬Nn·krev·n; ⌬Nn·krev·n Ⰶ1 . (9) sary assumptions and parameters that are difficult to
estimate. The total reversion probability during that time step is
Parameter choice:It is not easy to obtain an accurate 1 minus the probability that no reversion has occurred
estimate of the intrinsic recombination rate,prec, but a in any of the classesn,
value in the range of a few percent seems reasonable since this has been experimentally estimated for tandem
prev(T)⫽ 1⫺
兿
n⫽∞
n⫽0
(1⫺qrev(n)) , (10)
duplications on the F⬘plasmid (E.Kugelberg,J.Roth
and D. I. Andersson, unpublished data) and slightly where T is the time at the end of the time step in
lower rates have been observed in the chromosome question. Thus, the probability that the first reversion
(AndersonandRoth1977;ReamsandNeidle2003;
occurs at or before this time is
R. DawsonandJ. Roth, unpublished data). The rate of reversion (back-mutation) of thelacframeshift
muta-Prev(T)⫽ 1⫺
兿
t⫽T
t⫽0
(1⫺prev(t)) . (11)
tion used iskrev⫽10⫺8, a rate estimated from unselected
growth. Strictly, this should be scaled by the F⬘ copy And, finally, the probability that the first reversion
oc-number. However, this scaling is left out since the system curs during the time step ending atTis
is very insensitive to the value ofkrevand 10⫺8is already
a rough estimate. In some cases, though, the average
Qrev(T)⫽ prev(T) ·
兿
t⫽T⫺1
t⫽0
(1⫺ prev(t)) . (12)
mutation rate, and consequently the reversion rate, is further increasedⵑ35-fold by an induction of the SOS The resulting distribution of reversion events can then
response (Rosche andFoster 1999;Hendricksonet
be compared to the Monte Carlo simulations, which
al.2002). directly represent the possible outcomes with no
ap-The growth rate contribution from each copy is essen-proximations other than those inherent in the
formula-tially equivalent to the-galactosidase activity yielded by tion of the underlying model.
one copy of the frameshift mutant, which has been
experi-Timescale: The calculations themselves proceed in
mentally shown to beⵑ1% of the wild type (Andersson
meta-time, which is not directly related to the evolution
et al.1998). Thusy⫽0.01, in the standard case. How-of the system; it is simply a succession How-of growth events.
contribu-tion from each copy should be multiplied by the F⬘ plasmid copy number, which is between 2 and 3. The real-time calculations show that this is necessary to com-plete the process within the duration of the experiment. The load parameters,landx, reflect the cost of main-taining and expressing many copies of lacZand other genes included in the duplication, as well as the increas-ing risk of deletion events where a part of the array is looped out and lost. These are more difficult to estimate from experimental data; fortunately the exact choice of load parameters is not crucial for the behavior of the system. As long as the expression follows the assumption of the model, which is that fitness increases with
increas-Figure3.—Monte Carlo simulation of colony formation. A
ing copy number up to some sufficiently large (⬎50)
run with elevated rates,prec⫽0.2,krev⫽10⫺6,l⫽0.005,x⫽
optimum value, the system is robust to changes in these
5, andy⫽0.05, is shown to illustrate the rise of revertant cells
parameters. The main function of the load, in combina- and the corresponding drop in average copy number. This tion with the selection expression, is to determine which will typically occur three to four apparent generations after
the original revertant was born.
copy number gives maximal fitness and therefore is optimal with respect to growth. Furthermore, the load expression determines the maximum copy number that
eters, becomes much more important for the shape of can actually grow, as well as the general shape of the
the process. fitnessvs.copy number curve (Figure 1). The simplest
possible (i.e., linear withx⫽1) load expression in
Equa-tion 3 gives a broad fitness curve, where the optimum RESULTS
is far below the maximum. By using a higher-order
ex-Two variants of the model have been analyzed: a com-pression (x ⬎ 1), the effect of the load sets in much
plete Monte Carlo simulation and the quasi-determinis-more sharply near the maximum copy number, thus
tic description, which is a stochastic-deterministic hy-allowing the positive contribution of the high copy
num-brid. The pros and cons of each approach are discussed bers to make its presence felt without having to include
below. a large number of nonproductive states by increasing
Monte Carlo simulations: This is perhaps the best the maximum. If the same maximum copy number is
approach, as it completely obeys the proposed rules, used, there will also be a distinct effect on the fitness
without requiring any extra assumptions or adaptations. relative to revertant cells. This is of less importance,
However, as each cell is modeled individually, it be-since the main part of the dynamics takes place in a
comes unmanageable for large population sizes. Due population without revertants present. It will, however,
to its closeness to the thought model, it can be, and has affect the rate with which the duplications are lost after
been, used as a control of the other variants.
a reversion has occurred. It should be noted that even The simulations show that after a period of slow a neutral duplication will tend to segregate. This is be- growth of cells with low copy number, the average copy cause copy numbers can change rapidly, also down to number takes off quickly. This is expected, as variation
n ⫽ 1, due to frequent recombination. However, the must be generated before selection can take effect. process is asymmetric, as discussed above; once excess Once variation in copy number is present, the ability copies are lost, they will be recreated only slowly. In of recombination to quickly distribute the population principle, the load affects the absolute growth rate and over many copy-number states provides an excellent would be an experimentally accessible quantity. template for selection. In this aspect all simulation runs For real-time calculations, the system is more sensitive are more or less the same. The key event is the appear-to parameter values. In this case, the selection parame- ance of the first revertant. In the revertant population ter and the fitness expression become critical to the the duplication or amplification loses its selective advan-magnitude of the timescale. However, there are also tage and is even counterselected, due to the load pen-qualitative effects that are insensitive to this and are alty. As expected, this subpopulation quickly loses the thus of genuine interest. The general effect of the real- extra copies, and stable (single-copy) revertants appear time transformation is to extend the early generations a few generations later and start rising rapidly in the of the colony, as mean fitness is low at that stage and, population (Figure 3).
naturally, growth is slow. Late generations are corre- The Monte Carlo simulations are to some extent lim-spondingly compressed, due to their high mean fitness. ited by the exponential population growth, making it Thus, by switching to real time, the formulation of the difficult to follow the colony to the end, in the range of 108–109cells. Therefore, to get a reversion event within a
param-reasonable calculation time, the simulations displayed in Figure 3 were run with an elevated reversion rate. With a more realistic rate, the first reversion is likely to happen in the last or second to last generation simu-lated, too late to follow the development.
Quasi-deterministic description: This approach has the advantage of implicitly modeling the cells, by calcu-lating the total change in each copy-number class. This means that the number of calculations required does not scale with the number of cells present in the popula-tion. On the other hand, the nature of cells as discrete entities is partially lost, which forces some artificial con-straints to be put on the system. The deterministic na-ture of these calculations is only a minor drawback, mainly because there is no death in the system, which removes one important source of random variation. Fur-thermore, by including the first appearance of a re-vertant as a stochastic event, according to Equation 9, the main contribution to random variation is accounted for ( jackpots).
The full development of the system is shown in Figure 4. Figure 4, a and b, shows how the copy numbers of the mutantlacallele quickly increase, driven by selection, until a stationary distribution is reached. The shape of this distribution will be governed by the fitness equation (Equation 3). Thereafter, this distribution for the nonre-vertants retains essentially the same shape throughout, although the relative contribution will decrease once revertants have appeared (Figure 4, c and d). Figure 4b shows that the first revertant is likely to appear in some high-copy-number class, as expected from the model. Once their growth starts, revertant cells will swiftly lose copies, and low-copy-number classes will increase in fre-quency (Figure 4c) and eventually dominate the colony (Figure 4d). The rate at which revertants take over the population is dependent on the relative fitness of the revertants and the best of the nonrevertant cells; this relation, in turn, depends on the fitness equation (Equa-tion 3).
In fact, since the timing of the first reversion event Figure4.—The copy-number distribution at chosen time is so crucial to the history of the clone and its probability points. Mutants are plotted on the lefty-axis, revertants on the right. Note the differences in scales as the colony develops.
can be analytically calculated, it is possible to answer
(a) Ten generations. The population has started to spread
many questions without actually performing the
stochas-out across the available copy numbers, reversion has not
oc-tic step at all, but rather by just following the
develop-curred. (b) Twenty generations. The mutant population has
ment of the reversion probability, as shown in Figure reached the shape dictated by the fitness curve and will remain 5. This figure shows the complete development of the essentially unchanged throughout the experiment. The first revertants have appeared, evident as spikes in the curve.
Sur-system, until reversion is all but inevitable. Since it is
rounding these peaks is some numerical noise, due to the
not certain that all cells initially carrying a duplication
very low frequencies present at this stage, which have
negligi-will give rise to a revertant colony within the time of
ble impact on system behavior. (c) Twenty-two generations.
the experiment, it is of interest to examine also the Revertants are growing, and losing excess copies, rapidly. The region where reversion is a low probability event (Figure peak of the distribution is at two to three copies, with also single-copy cells being abundant. (d) Twenty-six generations.
5, inset).
The shape of the curves is largely unchanged, but the scale
Fortunately, the added resolution of the analytic
prob-shifts and the single-copy cells have increased further in
fre-ability calculation makes it possible to examine the de- quency. Revertants are now dominant. Parameters used are pendence on the recombination rate, which allows esti- p
rec⫽0.05;krev⫽35⫻10⫺8,r⫽0.01,l⫽0.005,x⫽5.
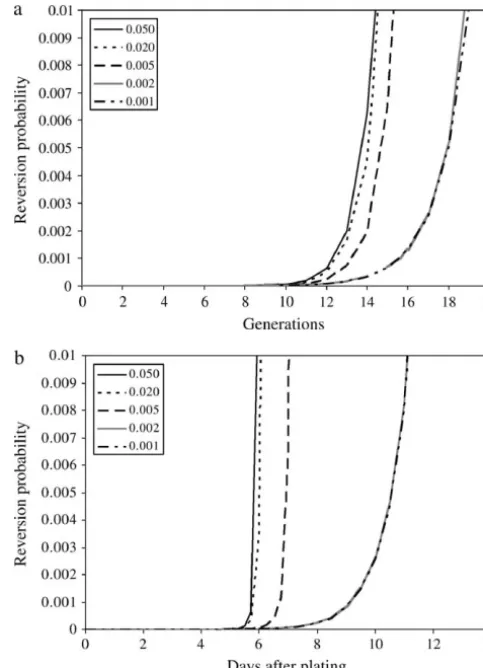
Figure 5.—Analytic curves for the cumulative reversion probability over time forprec⫽0.05,y⫽0.03,0⫽30
genera-tions/day, and other parameters as in Figure 4.The solid line is the probability of reversion having occurred at or before a given time, withkrev⫽ 10⫺8(Equation 11). The dashed line
follows the same equation, but withkrev⫽35⫻10⫺8.
Figure 6. Here, it is interesting to note that there is a qualitative difference between the real-time and genera-tion-scale behavior. When measured in generations, the recombination rate has very little impact, until it be-comes so small that there is essentially no recombination occurring during the entire process. If the measure is real time, however, there is a much more noticeable effect of semi-low recombination rates. This is due to
lower fitness in early generations, which accounts for a Figure 6.—The probability that reversion has occurred, large part of the total time of colony evolution. according to Equation 11, plotted as a function of time. (a) Figures 6 and 7 show the relation between reversion The generation timescale, (b) the real timescale. The different lines are calculated with different recombination rates (prec),
and recombination rate. There is a threshold value
which are shown in the insets. Other parameters are the same
where recombination is too slow to have any real impact
as in Figure 5.
on the system. In this case, reversion occurs only at a colony size of a few times 107 cells, which is what one
would expect if the average copy number of the colony
mainly because cells that grow faster in the beginning remains at two. At the other extreme, when
recombina-are more likely to produce a revertant colony in real tion is as frequent as one per division (the maximum),
time. In terms of the generation in which the first re-reversion occurs at a frequency that is not very different
vertant appears, the effect is limited. This is because from a recombination rate of a few percent. This is not
the population usually reaches optimal copy numbers unexpected as the probability of reversion depends on
before reaching a size where reversion is likely even the total number oflaccopies in the colony. Thus even
with just two initial copies. As an example, shifting the if the optimal copy number is reached quickly, the
popu-initial copy number from two to eight moves the average lation must be large before reversion is likely.
reversion time less than half a generation (data not
Alternative model variants: The calculations above
shown). However, due to the increased growth rate of are all based on the same principal model as described.
the initial cells, the real timescale can be substantially However, some aspects could be treated equally well in
shortened by such a shift. slightly different ways. The following is an exploration
Loss of revertants:Not included in the model is the of some alternative choices and variants of the model.
possible loss of the actual reverted copy through
recom-Different initial conditions: While all colonies are
initiated by a single cell, it is not necessary that this cell bination events between flanking nonrevertant copies. has exactly two lac copies. Distributions from calcula- This might slow down the process. Given the assumption tions on neutral duplications (Figure 8) indicate that, that all recombination events are equally likely, the while most cells with multiple gene copies have only probability of this event is
two copies, there is a thin but long tail of cells with
higher copy numbers. Starting at a higher state may of ploss⫽ z
n ·
(n⫺z)
n , (14)
Figure8.—The stationary distribution of a neutral duplica-tion where the rate of initial duplicaduplica-tion formaduplica-tion is1⁄
100of
the recombination rate per copy.
preventing SOS induction or eliminating the required
dinBgene) the revertant number drops only by a factor of 4. It has been suggested that mutagenesis allows rever-sion to occur earlier in the history of each clone. That is, without mutagenesis, reversion still occurs but only after longer growth or higher amplification to compen-sate (with target number increases) for the lower muta-tion rate.
However, the situation is complicated by the fact that not all cells may experience the same reversion rate. Recent experiments (Slechta et al. 2003) show that detectable general mutagenesis occurs only if the ampli-Figure 7.—The time where reversion has occurred with fied unit includes thedinBgene, which is situated near probability 0.01 plotted as a function of the recombination lacon the strains used in the experiment. About 10% rate (prec). The solid line is with the normal reversion rate
of detected revertants arise in colonies whoselac
ampli-10⫺8, and the dashed line is with the elevated rate 35⫻10⫺8.
fication includesdinB, but this may not represent the
(a) Timescale in generations, (b) real timescale (days).
Con-stants other thanprecare the same as in Figure 5. fraction of initial clones with adinBduplication. That
is because mutagenesis allows reversion to occur earlier in clones with amplifieddinBso that they will be over-represented among the revertants that appear during wherenis the number of copies, and zis the position
any particular time period. The probability of reversion of the reverted copy. It is obvious that this probability
for microcolonies with and without an elevated muta-is maximal when the reversion muta-is in the middle copy
tion rate is shown in Figure 5. This figure shows that (z ⫽ n/2) and that this maximum is 25%. Thus, even
it is likely that a much larger fraction of duplications in a worst-case scenario, 75% of all deletions are allowed,
including dinB will result in revertant colonies, com-and the process is unlikely to be very much affected.
pared to whendinBis not included. The final result will Calculations done for this situation (25% of all deletions
be a weighted superposition of the two curves. yield nonrevertant cells) support this expectation.
Reversion rate variations: This analysis has modeled the reversion process without using any increase in
mu-DISCUSSION
tation rate (per gene copy). This puts the maximum
reversion within the timescale of the experiment. ation 13 (ⵑ104 cells), even if the population starts at
optimal copy numbers. Equally important is that to the genetic system can
ac-Second, as the optimal copy number is reached, a temp-commodate copy numbers on the order of 102, or the
orary stable state appears. At this point a fairly uniform process will not be quick enough. Minimal estimates
population of cells is growing, with their copy numbers of copy number show experimentally that this can be
distributed around the optimum (cf. Figure 4), in some attained in the Cairns system (Slechta et al. 2003).
sense waiting for the appearance of the first revertant. These requirements might well explain why this
phe-Once a revertant is formed, the colony enters the final nomenon is observed only on a plasmid.
stage. In this stage, fitter cells will constantly be created Of course, the exact nature of these restrictions will
by loss of excess gene copies, until a stable single-copy depend on some particulars of the model. If, for
exam-revertant appears and takes over the population. ple, the reversion rate is higher than the standard
unse-Relation to experiments: Current estimates suggest lected rate of 10⫺8/copy/generation, the required
re-that only a small fraction (ⵑ10⫺2) of duplication-bearing
combination rate and achievable copy number drop. In
cells succeed in generating a revertant clone on selective fact, the average rate is 30- to 50-fold higher due to
medium by day 6. This appears surprising, as there is induction of the SOS response (Hendrickson et al.
an inherent inevitability in the amplification model; 2002). However, this is achieved by a 10-fold higher
once the process starts, reversion is the only possible increase inⵑ10% of the population, the ones withdinB
outcome. However, other experimental evidence (E. included in the duplication. Also other duplications
Kugelberg and D. I. Andersson, unpublished data) may have some effect on the mutation rate, which could
offers an explanation. Experiments using only cells that explain why the appearance of revertant colonies is spread
are known to carry a duplication show that virtually all out over several days rather than in one distinct burst.
cells give rise to colonies within 10 days, with the first Also of some importance is the fitness equation (Equation
ones appearing by day 4 or 5. Between days 4 and 10, the 3 and Figure 1), since it will dictate what copy number
number of revertant colonies increases nearly linearly, is optimal with respect to growth. This will be roughly
until the number of plated cells is reached. This would equivalent to the average of the population, since cells
indicate that the original duplication is modified, lead-with copy numbers close to the optimum grow best.
ing to a different efficiency of amplification. If it re-However, given the costs of maintaining and translating
mained exactly the same, a more coherent appearance genes, some of which may have toxic effects when
over-would be expected, with the majority of the colonies expressed, it seems unlikely that the optimum copy
num-showing up during 1 day. Around day 5,ⵑ1/100 cells ber should be much larger than the number needed to
have given rise to a colony. These are ones that either achieve approximately wild-type levels of-galactosidase
picked up a reversion very early or gained a duplication activity, while the fundamental need for lactose
metabo-that was amplified with very high efficiency. It is only lism inherent in the system will ensure that it is not
these colonies that will appear in the Cairns system, in much smaller. This implies that the probable range of
which experiments cannot be extended to 10 days, due optimal copy numbers is not very broad, which limits
to the conditions used. the impact of which expression is used to calculate the
One more factor that could affect the number of re-fitness of cells. vertants is that two copies might not be enough to sustain
Model behavior: According to the model, develop- growth, implying that only cells with even higher copy
ment of a revertant colony can be divided into three numbers can enter the amplification process. This will steps. The first is a start up phase where averagelaccopy have a limited effect, however, as the ratio between cells number per cell increases, slowly at first but constantly with two and, say, four copies will initially not be larger accelerating, until the average copy number approaches than about fourfold (Figure 8).
an optimum (limited by the loss rate and the general The main reason that prevents extension of the Cairns growth cost of the amplification). The length of this system experiments in time is interference from sur-phase will be weakly dependent on the recombination rounding cells, both scavengers and more successful am-rate. This is because even with recombination at every plifying clones. It is not unreasonable to propose that cell division, the maximum, accumulation will still be this external competition will prevent growth of would-limited by the small initial step size and low number of be revertant colonies that were not among the lucky cells early in development. In the case of low recombina- few to pick up a reversion, or improved amplification tion rates, the exponential growth of the colony will efficiency, at an early stage in growth. Relating to Figure compress events, since what really matters is the recom- 5, this would mean that only the leftmost tail will actually bination rate times the number of cells. Also, the race contribute, and the rest of Figure 5 is relevant only as is not to infinity, but rather to the optimal copy number. an illustration of the model or in experiments with The probability of reversion will remain small until the duplication-carrying cells only.
gener-and DNA polymerase IV dependence. Proc. Natl. Acad. Sci. USA
constant flux of incorporating and losing duplications.
98:8334–8341.
Most of these duplications are probably neutral or dele- Cairns, J., andP. L. Foster, 1991 Adaptive reversion of a frameshift
mutation inEscherichia coli.Genetics128:695–701.
terious and are lost fairly quickly. The classical model
Cairns, J., J. OverbaughandS. Miller, 1988 The origin of
mu-for the evolution of new gene function relies on gene
tants. Nature335:142–145.
duplication followed by adaptation of one the copies. Foster, P. L., 1994 Population dynamics of a Lac⫺strain of
Esche-richia coliduring selection for lactose utilization. Genetics138:
The problem with this idea is that the redundant gene
253–261.
copy is much more likely to be removed or inactivated
Foster, P. L., andJ. Cairns, 1992 Mechanisms of directed mutation.
rather than adapted. Duplication patterns and age dis- Genetics131:783–789.
Galitski, T., andJ. R. Roth, 1995 Evidence that F plasmid transfer
tribution of paralogous genes in microbial genomes
replication underlies apparent adaptive mutation. Science268:
suggest that duplications that survive are under
selec-421–423.
tion from the start (HooperandBerg2003). This could Hall, B. G.,1990 Spontaneous point mutations that occur more
often when advantageous than when neutral. Genetics126:5–16.
be the case for a duplicated sequence that carries some
Hendrickson, H., E. S. Slechta, U. Bergthorsson, D. I. Andersson
weak or ancillary function that is beneficial. A weak
andJ. R. Roth, 2002 Amplification-mutagenesis: evidence that
function would be one that is not optimized but more “directed” adaptive mutation and general hypermutability result
from growth with a selected gene amplification. Proc. Natl. Acad.
accidental; perhaps an enzyme that is specific for a certain
Sci. USA99:2164–2169.
substrate can also deal with another similar substrate,
Hooper, S. D., andO. G. Berg, 2003 On the nature of gene
innova-though not very efficiently. If the new substrate becomes tion: duplication patterns in microbial genomes. Mol. Biol. Evol.
20:945–954.
abundant, further duplications of this sequence could
Lenski, R. E., M. Slatkinand F. J. Ayala, 1989 Mutation and
be driven by a gene dosage effect, which in turn will
selection in bacterial populations: alternatives to the hypothesis
produce a larger target for adaptive mutations. Thus, a of directed mutation. Proc. Natl. Acad. Sci. USA86:2775–2778.
Mayr, E., 1982 The Growth of Biological Thought: Diversity, Evolution
gene that carries some ancillary function that can be
and Inheritance. Harvard University Press, Cambridge, MA.
selectively amplified stands a much larger chance of
Reams, A. B., andE. L. Neidle, 2003 Genome plasticity in
Acineto-being retained and adapted (Hendricksonet al.2002; bacter: new degradative capabilities acquired by the spontaneous amplification of large chromosomal segments. Mol. Microbiol.
HooperandBerg2003).
47:1291–1304.
Conclusion:The combined evidence of the analyses Rosche, W. A., andP. L. Foster, 1999 The role of transient hyper-used shows that the adaptive duplication mechanism is mutators in adaptive mutation inEscherichia coli.Proc. Natl. Acad.
Sci. USA96:6862–6867.
quantitatively sound and can explain the high reversion
Roth, J. R., E. Kofoid, F. P. Roth, O. G. Berg, J. Segeret al., 2003
rate phenomenon observed without proposing the exis- Regulating general mutation rates. Examination of the hypermu-tence of any new and unproven molecular processes. table state model for Cairnsian adaptive mutation. Genetics163:
1483–1496.
This work was supported by the National Graduate School in Scien- Slechta, E. S., J. Harold, D. I. AnderssonandJ. R. Roth, 2002a tific Computing (M.P.) and by the Swedish Research Council (O.G.B., The effect of genomic position on reversion of alacframeshift D.I.A.). mutation (lacIZ33) during non-lethal selection (adaptive
muta-tion). Mol. Microbiol.44:1017–1032.
Slechta, E. S., J. Liu, D. I. AnderssonandJ. R. Roth, 2002b Evi-dence that selected amplification of a bacterial lac frameshift
LITERATURE CITED allele stimulates Lac⫹reversion (adaptive mutation) with or with-out general hypermutability. Genetics161:945–956.
Anderson, R. P., andJ. R. Roth, 1977 Tandem genetic duplications Slechta, E. S., K. L. Bunny, E. Kugelberg, E. Kofoid, D. I. Anders-in phage and bacteria. Annu. Rev. Microbiol.31:473–505. sonet al., 2003 Adaptive mutation: general mutagenesis is not
Anderson, R. P., andJ. R. Roth, 1981 Spontaneous tandem genetic a programmed response to stress, but results from rare co-ampli-duplications inSalmonella typhimuriumarise by unequal recombi- fication ofdinBwithlac.Proc. Natl. Acad. Sci. USA100:12847– nation between ribosomal RNA (rrn) cistrons. Proc. Natl. Acad. 12852.
Sci. USA78:3113–3117. Torkelson, J., R. S. Harris, M.-J. Lombardo, J. Nagendran, C.
Andersson, D. I., E. S. SlechtaandJ. R. Roth, 1998 Evidence Thulinet al., 1997 Genome-wide hypermutation in a subpopu-that gene amplification underlies adaptive mutability of the bacte- lation of stationary-phase cells underlies recombination-depen-riallacoperon. Science282:1133–1135. dent adaptive mutation. EMBO J.16:3303–3311.
Bull, H., M.-J. LombardoandS. Rosenberg, 2001 Stationary-phase