Computational Modelling of Wire Biosensor with
Competitive Substrates Conversion
Vytautas Aˇseris
Member, IAENG
Abstract—Glucose biosensors are analytical devices used mainly for the recognition of glucose in blood. A wire biosensor utilizing a competitive substrates conversion is analysed in this paper. Two substrates (oxygen and glucose) are competing over the single enzyme (Aspergillus niger glucose oxidase) in the analysed reactions. However, oxygen concentration is not of any importance in this case and it is considered as disturbance. The purpose of this work was to define the parameter values of the biosensor, at which oxygen concentration does not affect the response of the biosensor. The behaviour of the biosensor is defined by the mathematical model with reaction-diffusion equations of non-linear type. The suggested mathematical model is solved numerically, by using finite difference technique, as the analytical solutions exist only for a very few selected cases because of the non-linearity in the reaction term. The simulations showed complex biosensor dynamics at various values of enzymatic membrane thickness and concentration. The calibration curves signifying the effective range of the biosensor operation were provided.
Index Terms—Biosensor, modelling, competitive substrates conversion, glucose, oxygen.
I. INTRODUCTION
B
IOSENSORS are reliable sensing devices used for the detection of a specific substance (substrate) in the analysed solution [1]. During the biosensor action, biosensor-specific product appears which is detected and transmitted to the biosensor output device with a help of transducer element. According to the transducer type, biosensors are classified into electrochemical, electrical, optical, piezoelec-tric, thermometric [2]. Various biosensors are constantly being developed and applied in point-of-care testing, home diagnostics, environmental monitoring, research laboratories, process industry, security and biodefense and others [3], [4]. In the medical field, a majority of biosensors are included in glucose meters, blood gas analysers, electrolyte analysers, metabolite analysers and various drug detectors [1], [5], [6], [7].The creation of new biosensors or the optimization of the existing ones by means of physical experiments is troublesome and tedious process. Part of the experiments can be replaced by using mathematical modelling [8], [9]. In most cases a biosensor is modelled as a reaction-diffusion system [4]. However, such systems usually include non-linear reaction term, which complicates the solving of the model, as the exact analytical solutions exist only for a specific set of parameter values [10]. To simulate biosensor operation in wide ranges of parameter values a digital simulations are employed [11].
Manuscript received March 14, 2014; revised April 09, 2014. This research is funded by the European Social Fund under the Global Grant measure, Project No. VP1-3.1- ˇSMM-07-K-01-073/ MTDS-110000-583.
V. Aˇseris, PhD, is with the Department of Software Engineering, Faculty of Mathematics and Informatics, Vilnius University, LT-08303, Vilnius. e-mail: [email protected].
Glucose biosensors occupy more than 85% of all the biosensor market [12]. This type of biosensor is a compact instrument with an exceptional technology for the accurate and rapid diagnoses of blood glucose level. Various glucose biosensors were developed and analysed by using mathemat-ical modelling as long as since 1976 [13]. Consideration of insulin ”age structure” for modelling blood glucose dynamics is analysed in [14]. The dual use of horseradish peroxidase and glucose oxidase for the glucose biosensor is analysed in [15]. The effect of membrane permeability and selectivity on the performance of such sensor is analysed in [16].
A layer by layer assembling of the biosensor model is common for various biosensors, including glucose sen-sors [17]. The same approach is applied in this work to build the mathematical model of the wired biosensor. Biosen-sor with competitive substrates conversion in this work is modelled and targeted as the glucose detection sensor. Two substrates - glucose and oxygen - are capable of binding with one of the more common and relatively cheap enzymes analysed in this paper - Aspergillus niger glucose oxidase. However, only the detection and recognition of glucose is im-portant. The purpose of this work was to analyse biosensors behaviour numerically and to define the configuration of the biosensor, at which the influence of the oxygen concentration is minimal.
II. PROPERTIES OF THE BIOSENSOR
Physical biosensor is considered as a system consisting of wire electrode, which is covered with enzyme layer. The cross-section of this bioelectrode is displayed in Fig. 1. En-zyme (Aspergillus niger glucose oxidase) reacts with oxygen and glucose in the cyclic reaction:
Eox+ GlucoseGGGAEred+δ-glucolactone, (1)
Ered+ O2GGGAEox+ H2O2. (2)
In the terms of substrates and product the reaction scheme (1-2) can be written as follows:
Eox+ Sgl k1 GGGGGGB FGGGGGG
k−1 ES
k2
GGGAEred+ P1, (3)
Ered+ So k3
GGGGGGAEox+ P, (4)
the basic principles of the biosensor operation. To sidestep these problems, the QSSA is often applied [20], [21],
∂eox
∂t ≈
∂ered
∂t ≈
∂es
∂t ≈0. (5)
whereered,eoxandes, are the molar concentrations of the
oxidized enzyme Eox, the reduced enzyme Ered and the enzyme-substrate complex ES, respectively. By applying the quasy-steady state assumption as it is defined in (5), the total reaction ratev can be expressed as follows:
v = e0kcatkredkoxs (2) gl s
(2) o
kredkoxs (2) gl s
(2)
o +kcatkoxs (2)
o +kcatkreds (2) gl
, (6)
where s(2)gl and s(2)o are the concentrations of glucose and
oxygen, respectively,e0 is the total concentration of enzyme in the enzymatic membrane,kcat =k2 is catalytic constant of ES conversion, kred =k1k2/(k−1+k2) is an apparent bimolecular constant of the enzyme and substrate interaction, kox = k3 is a constant of the enzyme interaction with the mediator [22]. The notation of (2) denotes the layer number, in which the concentration is measured (the second layer is the enzymatic membrane, see Fig. 1).
III. MATHEMATICAL MODEL
The biosensor is considered as a thin wire electrode covered with the enzyme layer. A Nernst diffusion layer is considered outside the electrode-enzyme system (see Fig. 1). Since the electrode is much larger in length compared with its diameter, we describe the mathematical model in one dimensional space, which includes the following regions:
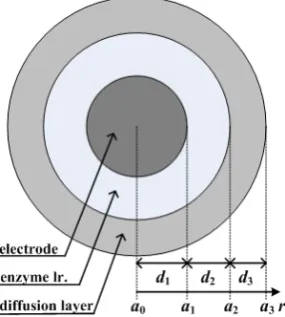
1) An electrode (l= 1, a0< r < a1), where no processes take place. At the boundary of a1 the electrons are collected. The radius of this layer isd0=a1−a0. 2) The enzyme layer (l = 2, a1 < r < a2) where the
biochemical reactions (3) and (4) as well as the mass transport by diffusion takes place. The radius of this layer isd1=a2−a1.
3) A diffusion limiting region (l = 3, a2 < r < a3), where only the mass transport by diffusion takes place. This layer was modelled according to the Nernst ap-proach [9], [1]. The radius of this layer isd3=a3−a2. 4) A convective region (r > a3), where the substrate concentration is maintained constant. Convective re-gion is considered to be much larger in volume than the bioelectrode system, therefore it’s thickness is not defined.
A. Governing equations
No biochemical processes are present in the electrode (a0 < r < a1) and the concentrations of all substances are always equal to zero (t >0),
c(1)(r, t) = 0, c=sgl, so, p, (7)
whererandtstand for the space (as a distance from the elec-trode at a0= 0) and time, respectively,s
(1) gl (r, t),s
(1) o (r, t),
p(1)(r, t) are the molar concentrations of the glucose Sgl, oxygenSo and product P respectively.
[image:2.595.355.498.55.214.2]By coupling the reaction kinetics described in the previous section with the mass transport by the diffusion, we form the
Fig. 1. A cross-section of the electrode
following reaction-diffusion type equations for the enzymatic membrane (a1< r < a2,t >0):
∂s(2)gl
∂t =D
(2) sgl
∂2s(2) gl
∂r2 + 1 r
∂s(2)gl
∂r
!
−v, (8a)
∂s(2)o
∂t =D
(2) so
∂2s(2) o
∂r2 + 1 r
∂s(2)o
∂r
!
−v, (8b)
∂p(2)
∂t =D
(2) p
∂2p(2) ∂r2 +
1 r
∂2p(2) ∂r2
+v, (8c)
where s(2)gl (r, t), s(2)o (r, t), p(2)(r, t) are the molar
con-centrations of the glucose Sgl, oxygen So and product P respectively, Ds(2)gl,D
(2) so , D
(2)
p are the diffusion coefficients
of corresponding substances in the enzyme layer. All forms of enzyme are considered to be immobilized, and therefore there are no diffusion terms in the corresponding equations. The reaction product P1 has no influence to the biosensor response and therefore it is not described in the mathematical model.
Outside of the enzyme layer only the mass transport by diffusion of glucose, oxygen and product takes place (enzyme is considered to be non-diffusive). It was assumed that the external mass transport obeys a finite diffusion regime (t >0, a2< r < a3),
∂c(3)
∂t =D
(3) c
∂2c(3) ∂r2 +
1 r
∂c(3) ∂r
, c=sgl, so, p, (9)
wheres(3)gl (r, t), s(3)o (r, t) andp(3)(r, t) stand for the molar
concentrations of the glucose, oxygen and product in the diffusion layer,Ds(lgl), D
(l) so andD
(l)
p are the diffusion
coeffi-cients of glucose, oxygen and product in the diffusion layer, which is treated as the Nernst diffusion layer [9]. According to the Nernst approach the thicknessd3=a3−a2 remains unchanged with time. Away from it (r > a3) the buffer solution is in motion and uniform in concentration.
B. Initial conditions
(l= 2) and diffusion (l= 3) layers,
c(l)(r,0) = 0, c=sgl, so, p, al−1< r < al, (10a)
s(2)gl (a1,0) = 0, s (3)
gl (a3,0) =s0,gl, (10b)
s(2)o (a1,0) = 0, so(3)(a3,0) =s0,o, (10c)
p(2)(a1,0) = 0, p(3)(a3,0) = 0, (10d)
where s0,gl and s0,o are the concentrations of the glucose
and oxygen, respectively, in the bulk solution,l is the layer number according to the numbering in Fig. 1.
C. Boundary and matching conditions
During the biosensor operation the concentrations of the glucose, oxygen and product in the bulk solution remain constant, as the bulk solution is considered to be much larger in volume compared to the analysed biosensor system. The concentration p(2) of the reaction product at the electrode surface (r=a1) is being permanently reduced to zero due to the electrode polarization. Following the scheme (3)-(4), the substrate is an electro-inactive substance. This is described by the following boundary conditions (t >0):
D(2)c
∂c(2) ∂r
r=a
1
= 0, c(3)(a3, t) =c0, c=sgl, so,
(11a)
p(2)(a1, t) = 0, p(3)(a3, t) = 0. (11b)
On the boundary between two adjacent regions having different diffusivities, the matching conditions are defined (t >0),
D(2)c ∂c (2)
∂r
r=a
2
=D(3)c ∂c (3)
∂r
r=a
2
, c=sgl, so, p,
(12a)
c(2)(a2, t) =c(3)(a2, t), c=sgl, so, p.
(12b)
These conditions mean that fluxes of the glucose, oxygen and product from enzymatic membrane are considered to be equal to the corresponding fluxes entering the surface (r = a2) of the diffusion layer and vice versa. The parti-tion coefficients of both substrates and product in between enzymatic and diffusion layers are considered to be equal and therefore are not introduced in the mathematical model.
D. Biosensor response
The electric current is measured as a response of the biosensor in a physical experiment. The density i(t)of the current at timetis proportional to the gradient of the product P concentration p at the electrode surface (r = a1) and is obtained according to Fick’s and Faraday’s laws [5],
i(t) =neF D(2)p
∂p(2) ∂r
r=a
1
, (13)
where F is Faraday’s constant (F = 96.485 × 10⁶ CM−1m−3), ne is a number of electrons involved in the
electrochemical reaction.
Mathematical model approaches the steady-state as t → ∞,
is= lim
t→∞i(t). (14)
TABLE I
CONSTANT PARAMETER VALUES OF THE BIOSENSOR MODEL.
Description Notation Value Dimen. Nernst diffusion layer
thickness
d3 5×10⁻⁵ m
Diffusion coefficient of glucose in the dialysis membrane
Ds(2)gl 3.4×10
−11 m2s−1
Diffusion coefficient of glucose in the diffusion layer
Ds(3)gl 6.3×10
−10 m2s−1
Diffusion coefficient of oxygen in the dialysis membrane
Ds(2)o 1.4×10
−9 m2s−1
Diffusion coefficient of oxygen in the diffusion layer
Ds(3)o 2.12×10
−9 m2s−1
Diffusion coefficient of product in the dialysis membrane
Dp(2) 3.1×10⁻¹⁰ m2s−1
Diffusion coefficient of product in the diffusion layer
Dp(3) 1.4×10⁻⁹ m2s−1
Reaction rate of catalyt-ic constant of ES con-version
kcat 8.8×10² M−1
Reaction rate of the en-zyme and glucose inter-action
kred 1.2×10⁴ M−1s−1
Reaction rate of the en-zyme interaction with the oxygen
kox 1.5×10⁶ M−1s−1
Number of electrodes ne 1
-TABLE II
CHANGED PARAMETER VALUES OF THE BIOSENSOR MODEL.
Description Notation Interval D. Radius of the electrode d1 [5×10⁻⁵; 5×10⁻⁴] m
Enzyme layer thickness d2 [10−5; 10−4] m
Glucose concentration s0,gl [10−3; 2×10⁻²] M
Oxygen concentration s0,o [5.5×10⁻⁵; 2.74×10⁻⁴] M
Enzyme concentration e0 [10−7; 10−4] M
IV. DIGITAL SIMULATION
In general case, a presented mathematical model can be solved numerically with analytical solutions existing only for a specific set of parameter values [9], [10]. In our investiga-tion we used the finite difference method by introducing a uniform grid in space (with a total of number of 800 points) and time directions. An explicit finite difference scheme has been built to solve a problem [8], [11]. The software of the digital simulator has been programmed in C++ language. In the digital simulation the steady state timetr was assumed
when the change of the current is relatively small during the relatively large time,
tr= min i(t)>0
t: t i(t)
di(t) dt
< ε
, i(tr)≈is. (15)
The decay rateεhighly influences the response time: when ε→0,tr→ ∞. In our calculations we used= 10−3.
A. Parameter values
Fig. 2. Biosensor response in time at three different concentrations of oxygenso:6.85×10⁻⁵ (1),1.37×10−4 (2) and2.74×10−4M (3).
Electrode radius wasd1= 5×10⁻⁵m, enzymatic membrane thickness was
d2= 10−5m. Other parameter values as defined in Table I.
B. Model validation
By increasing the radius of the electrode, the mathematical model described in this paper approaches the model used in [22], which is described in Cartesian space. By usingd1= 0.01m and by changing the other parameter values as defined in Table II, the relative current difference between the model described in this work and the one described in [22] was less than 1%.
Additionally, validation of concentrations was carried out by checking if the concentration values do not contain any sudden spikes in the inner sections of the layers.
The solution starts by applying initial conditions at time moment t = 0. Mesh points at the initial time row are calculated according to the discretized initial conditions of the mathematical model. Time step is increased, and new row of the concentration values is calculated according to the approximated governing, boundary and matching conditions. When the concentrations for all the compounds at all mesh points of the new time step are calculated, validation of the concentrations is executed.
If the validation of concentrations does not fail (as it is a mandatory requirement), the calculations are continued. If they fail, the time step is decreased repeatedly, while the time step reaches such size, that the calculations would proceed long enough without any failure for the condition (15) to be satisfied.
C. Biosensor response
Biosensor response in time at three different glucose concentrationsso(6.85×10−5,1.37×10−4,2.74×10−4M)
of oxygen is displayed in Fig. 1. Electrode radius was d1 = 5 ×10⁻⁵m, enzymatic membrane thickness was d2 = 10−5m. Other parameter values were the same as defined in Table I.
As one can see from Fig. 2, the responseiis monotonically increasing function of timet. By increasing oxygen concen-tration four times from s0,o = 6.85×10⁻⁵M (curve 1) to
s0,o = 2.74×10⁻⁴M (curve 3), the steady state response
[image:4.595.81.261.55.197.2]increases from i ≈ 3.93µA to i ≈ 6.38µA (an increase of 62.3%). Such a large sensitivity to the concentration of oxygen is unsuitable when constructing real life glucose biosensors. By measuring the maximal gradient of the current
Fig. 3. Maximal gradient of the current versus enzymatic mem-brane thickness at four different values of enzyme concentration e0:
10−7(1,5),10−6(2,6),10−5(3,7),10−4(4,8)M and at two different
concentrations of oxygen s0,o : 5.5×10⁻⁵(1-4),2.74×10−4(5-8)M.
Radius of the electrode wasd1 = 5×10⁻⁵m. Other parameter values
were as defined in Table I.
as the response, as it is defined in (16), the biosensor sensitivity to oxygen can be reduced,
gmax= max t>0
di(t)
dt . (16)
In the analysed case, a quadruple increase in oxygen concen-tration increases the maximal gradient value only by 32.2% (from2.14×10−6µAs−1 in curve 1 to 2.83×10⁻⁶µAs−1 in curve 3) - approximately two times lower relative differ-ence than in case of the steady state current. The use of maximal gradient value instead of the steady state current is perspective in another point of view, as the final measured response is reached several times faster - a result attractive when designing medical biosensors. Therefore, in all the following simulations we used maximal gradient value (16) as the final response of the biosensor instead of the steady state response (14).
V. RESULTS
A. The influence of enzymatic membrane
Enzymatic membrane thickness is known to be very im-portant when designing new biosensors [3], [4]. The impact of the enzyme membrane thickness d2 at four different concentrations e0 (10−7,10−6,10−5,10−4M) of enzyme is displayed in Fig. 3. The calculations were carried out at two different concentrations of oxygen (minimum value ofs0,o =
5.5×10⁻⁵M and maximum value ofs0,o= 2.74×10⁻⁴M),
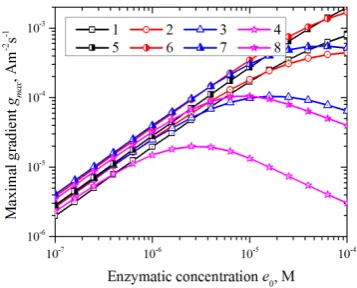
Fig. 4. Maximal gradient of the current versus the enzyme concen-tration at four different values of enzymatic membrane thickness d2:
10−5(1,5),2.16×10−5(2,6),4.65×10−5(3,7)and10−4(4,8)m and
at two different concentrations of oxygens0,o: 5.5×10⁻⁵(1-4),2.74×
10−4(5-8)M. Electrode radius wasd
1 = 5×10⁻⁵m. Other parameter
values were as defined in Table I.
As it was noticed in Fig. 3, the enzyme concentration e0 has a high impact on the biosensor response as well as sensitivity to oxygen concentration. Therefore, the impact of the enzymatic concentration on the biosensor response is analysed in Fig. 4 at four different enzyme membrane thicknessesd2(10−5,2.16×10−5,4.65×10−5and10−4m). The boundary values of the oxygen concentration were the same as in Fig. 3, all the other parameter values as defined in Table I.
For the relatively small enzymatic membrane thicknesses (d2 < 3 × 10⁻⁵m, curves 1 and 5, 2 and 6, Fig. 4), the maximal gradient of the current is steadily increasing function of enzymatic concentration e0. However, for the larger enzymatic membrane thickness (d2 > 3 ×10⁻⁵m, curves 3 and 7, 4 and 8), the response decreases with an increase of enzymatic concentration. However, the small-est difference between two responses for different oxy-gen concentrations is at the smallest values of enzymatic concentration (e0 = 10−7M). The enzymatic membrane thickness affects the influence of enzymatic concentration on the response - the larger enzymatic membrane thickness corresponds to the larger difference between the responses of different oxygen concentration. The smallest enzymatic membrane thickness (curves 1 and 5, Fig. 4) corresponds for the smallest sensitivity to oxygen concentration - a result reaffirming the results displayed in Fig. 3. Ate0 = 10−7M andd0= 10−5m, the response ofgmax= 1.99×10⁻⁶µAs−1
at the smallest oxygen concentration (s0,o = 5.5×10⁻⁵M)
and the response of gmax = 2.83 ×10⁻⁶µAs−1 at the
largest oxygen concentration (s0,o = 2.74×10⁻⁴M) is the
smallest (relative difference being 42%). Therefore, in all the following calculations we use the valued2= 10−5m for the enzymatic membrane thickness and the value e0 = 10−7M for the enzyme concentration.
B. The impact of the diffusivity
The sensitivity to oxygen concentration can be decreased down to 42%, however, the diffusivity can be employed to further eliminate the influence of oxygen. The impact of the diffusion coefficient D(2)sgl on the sensitivity to oxygen concentration at various values ofD(2)so andD
(2)
p is analysed
Fig. 5. Oxygen increase versus diffusivity of glucose in the enzymatic membrane at five different combinations of oxygen and product diffusivities: Ds(2)o : 1.4×10
−10(1,2),5×10−10(5),2.12×10−9(3,4)m2s−1 and
Dp(2): 3.1×10⁻¹¹(1,3),2×10−10(5),1.4×10−9(2,4)m2s−1. Radius
of the electrode wasd1 = 5×10⁻⁵m, enzymatic membrane thickness
d2= 10−5m, enzyme concentratione0= 10−7M. Other parameter values
were as defined in Table I.
in Fig. 5. The value of D(2)sgl was changed between tenfold smaller than the one provided in Table I and up to the value of Ds(3)gl. At the largest value ofD
(2)
sgl, the glucose would diffuse through the boundary ofr=a2 without any resistance. The parameters of Ds(2)o and D
(2)
p were changed in the similar
manner. The impact of oxygen is measured as the following ratio:
∆g=gmax(so,max)/gmax(so,min), (17)
where gmax(so,max) and gmax(so,min) stand for the
re-sponses of the biosensor at maximum (s0,o= 2.74×10⁻⁴M)
and minimum (s0,o = 5.5 × 10⁻⁵M) concentrations of
oxygen. The best previously determined values of enzymatic membrane thickness (d2 = 10−5m) and enzyme concentra-tion (e0= 10−7M) were used, while other parameter values were as defined in Table I.
As one can see from Fig. 5, the impact of oxygen is monotonically increasing function ofDs(2)gl. The dynamics of oxygen impact are virtually identical at the smallest ratio (curve 2) and largest ratio (curve 3) between D(2)so and Dp(2). The impact of oxygen is largest, when the diffusion
coefficients D(2)so and D
(2)
p are smallest (curve 1). The
smallest values of oxygen impact are achieved at the largest values of Ds(2)o and D
(2)
p (curve 4) - meaning that oxygen
and product would diffuse through the boundary ofr=a2 without resistance. The smallest overall value of∆g= 1.37 is obtained atD(2)sgl = 3.4×10
−11m2s−1 (curve 4).
C. Calibration curves
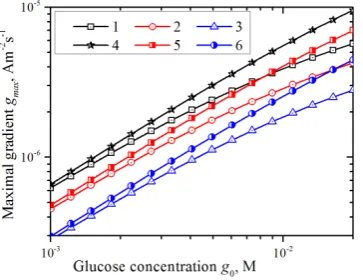
Calibration curves are employed for development of the real-life biosensors, as they are pre-programmed in the electronic parts of these devices [1], [6]. The impact of the response on the glucose concentration at three different electrode radius sizes d1 (5×10−6,10−5,5×10⁻⁵m) and two boundary oxygen concentrationss0,o (5.5×10⁻⁵M and
s0,o= 2.74×10⁻⁴M) is displayed in Fig. 6. The parameters
wereD(2)sgl = 3.4×10
−11m2s−1,D(2)
so = 2.12×10
−9m2s−1,
Dp(2)= 1.4×10⁻⁹m2s−1,d2= 10−5m,e0= 10−7M. Other parameter values were as defined in Table I.
[image:5.595.341.518.51.196.2]Fig. 6. Maximal gradient of the current versus the glucose concen-tration at three different values of electrode radius d1: 10−5(1,4),5×
10−5(2,5),10−4(3,6)m and two different values of oxygens
0,o: 5.5×
10−5(1-3),2.74×10−4(4-6)M. Other parameters wereD(2)
sgl = 3.4×
10−11m2s−1,D(2)
so = 2.12×10
−9m2s−1,D(2)
p = 1.4×10⁻⁹m2s−1,
d2= 10−5m,e0= 10−7M and as in Table I.
curves, as all of them are almost linear (see Fig. 6). Linear calibration curve corresponds to excellent biosensor sensi-tivity to glucose, meaning that the change in glucose con-centration corresponds to the respective change in biosensor response. The impact of oxygen concentration is decreased to minimum, when comparing with previous analysis. The smallest impact of oxygen is for the smallest concentrations of glucose. The radius of the electrode practically does not influence the impact of oxygen, however the radius has a reverse impact on the biosensor response: the smaller radius corresponds to the larger values of the response (curves 1 and 4) and vice versa (curve 3 and 6).
VI. CONCLUSION
The mathematical model provided in this paper can be successfully used for digital simulation of glucose biosen-sor behaviour. The impact of oxygen concentration on the biosensor response can be decreased by using the following recommendations:
1) Use maximal gradient of the response instead of the steady state response, which provides better response times and lower oxygen impact.
2) Smallest enzymatic membrane thickness and smallest enzyme concentrations are recommended, as they de-crease oxygen impact by 5 times, approximately. 3) The smallest possible diffusion coefficient of glucose
and the largest possible diffusion coefficients of oxygen and product in the enzymatic membrane correspond to the further decrease (by approximately 15%) of oxygen impact.
By following these recommendations a more sensitive to glucose biosensor can be developed by using Aspergillus niger glucose oxidase as enzyme.
ACKNOWLEDGMENT
Author thanks to the research group of ”Biomoda” in Vilnius University for the valuable discussions regarding the computational modelling of biosensors. The help from professors Romas Baronas and Juozas Kulys from Vilnius University are greatly appreciated.
REFERENCES
[1] F. Scheller and F. Schubert,Biosensors. Amsterdam, Netherlands: Elsevier, 1992.
[2] R. Monoˇs´ık, M. Stredansk´y, and E. ˇSturd´ık, “Biosensors - classifica-tion, characterization and new trends,”Acta Chimica Slovaca, vol. 5, no. 1, pp. 109–120, Jan. 2012.
[3] J. D. Newman and S. J. Setford, “Enzymatic biosensors,”Molecular Biotechnology, vol. 32, no. 3, pp. 249–268, Mar. 2006.
[4] A. Sadana and N. Sadana,Handbook of biosensors and biosensor kinetics. Amsterdam, Netherlands: Elsevier, 2010.
[5] F. Scheller and J. Fedrowitz, Frontiers in Biosensorics, ser. EXS (Basel). Birkhauser Varloy, 1997.
[6] J. Cooper and A. Cass,Biosensors: A Practical Approach, 2nd ed., ser. Practical Approach Series No 268. Oxford, UK: Oxford University Press, 2004.
[7] A. P. Turner, I. Karube, and G. S. Wilson,Biosensors: fundamentals and applications, ser. Oxford science publications. Oxford, UK: Oxford University Press, 1987.
[8] R. Baronas, F. Ivanauskas, and J. Kulys,Mathematical Modeling of Biosensors, 1st ed., ser. Springer Series on Chemical Sensors and Biosesnsors. Dordrecht, Netherlands: Springer, Apr. 2010. [9] D. Britz,Digital Simulation in Electrochemistry, 3rd ed., ser. Lecture
Notes in Physics. Berlin, Germany: Springer Berlin Heidelberg, 2005. [10] T. Schulmeister, “Mathematical modelling of the dynamic behaviour of amperometric enzyme electrodes,” Selective Electrode Reviews, vol. 12, no. 2, pp. 203–260, 1990.
[11] A. A. Samarskij,The theory of difference schemes. New York, New York, USA: Marcel Dekker, 2001.
[12] G. I. A. Inc., “Biosensors in Medical Diagnostics - a Global Strategic Business Report,” Global Industry Analysts, Inc., Tech. Rep., 2012. [13] L. D. Mell and J. Maloy, “Amperometric response enhancement of the
immobilized glucose oxidase enzyme electrode,”Analytical Chemistry, vol. 48, no. 11, pp. 1597–601, Sep. 1976.
[14] A. Cambiaso, L. Delfino, M. Grattarola, G. Verreschia, D. Ashworth, A. Maines, and P. Vadgama, “Modelling and simulation of a diffu-sion limited glucose biosensor,”Sensors and Actuators B: Chemical, vol. 33, no. 1-3, pp. 203–207, 1996.
[15] D. Mackey, A. J. Killard, A. Ambrosi, and M. R. Smyth, “Optimizing the ratio of horseradish peroxidase and glucose oxidase on a bienzyme electrode: Comparison of a theoretical and experimental approach,”
Sensors and Actuators B: Chemical, vol. 122, no. 2, pp. 395–402, Mar. 2007.
[16] A. Abd. Aziz, “Mathematical Modeling Of An Amperometric Glucose Sensor: The Effect Of Membrane Permeability And Selectivity On Performance,”Jurnal Teknologi, vol. 51, no. 1, pp. 77–94, Dec. 2009. [17] R. A. Croce Jr., S. Vaddiraju, F. Papadimitrakopoulos, and F. C. Jain, “Theoretical Analysis of the Performance of Glucose Sensors with Layer-by-Layer Assembled Outer Membranes,”Sensors, vol. 12, no. 10, pp. 13 402–13 416, Oct. 2012.
[18] V. Aˇseris and R. Baronas, “Using GRID Computing to Model Biosen-sors Acting in Stirred and Non-Stirred Solutions,” in Proceedings of the 5th European Conference on Computational Fluid Dynamics (ECCOMAS CFD 2010), C. F. Pereira, A. Sequeira, and J. M. C. Pereira, Eds., Lisbon, Portugal, 2010, pp. 14–17.
[19] N. ˇCenas and J. Kulys, “Biocatalytic oxidation of glucose on the con-ductive charge transfer complexes,”Bioelectrochemistry and Bioener-getics, vol. 8, no. 1, pp. 103–113, 1981.
[20] L. A.Segel and M. M. Slemrod, “The Quasi-Steady-State Assumption: A Case Study in Perturbation,”SIAM Review, vol. 31, no. 3, pp. 446– 477, Sep. 1989.
[21] B. Li, Y. Shen, and B. Li, “Quasi-steady-state laws in enzyme kinetics,”
The Journal of Physical Chemistry. A, vol. 112, no. 11, pp. 2311–2321, Mar. 2008.