Lyle, M., Wilson, P.A., Janecek, T.R., et al., 2002
Proceedings of the Ocean Drilling Program, Initial Reports Volume 199
9. S
ITE
1216
1Shipboard Scientific Party
2BACKGROUND AND OBJECTIVES
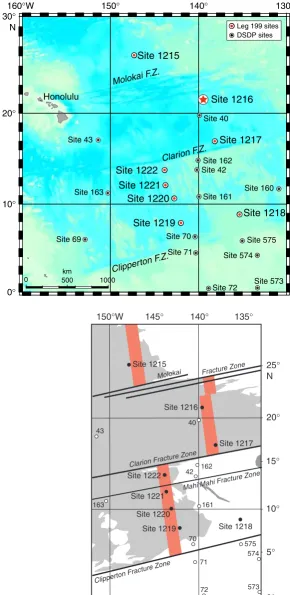
Site 1216 (21°27.16′N, 139°28.79′W; 5152 meters below sea level [mbsl]; Fig. F1) is situated in abyssal hill topography south of the Molo-kai Fracture Zone and two small associated unnamed parasitic fracture zones (Fig. F2). Based on magnetic lineations, Site 1216 appears to be situated on normal ocean crust formed during the C25r magnetic anomaly (~57 Ma; Atwater and Severinghaus, 1989). Site 1216 was cho-sen for drilling because it is near the thickest section of lower Eocene sediments along the 56-Ma transect, which was based upon the seismic stratigraphy of seismic reflection data acquired on site survey cruise EW9709 during transits between the proposed drill sites (Lyle et al.,
this volume; Moore et al., 2002). The Cenozoic history of sedimenta-tion in this region was poorly constrained prior to Leg 199, being largely based on two Deep Sea Drilling Project (DSDP) drill sites (40 and 41) and piston core data (EW9709-3PC) from ~1.5° in latitude to the south. Based on data from these drill sites, we expected the sedimentary sequence at Site 1216 to comprise red clays (a mixture of wind-blown dust and authigenic precipitates) overlying a biogenic sediment section composed of an upper middle Eocene radiolarian ooze and lower car-bonate ooze deposited when the site was near the ridge crest in the late Paleocene and early Eocene.
The broad paleoceanographic objectives of drilling the sedimentary sequence anticipated at Site 1216 are as follows: (1) to help define the shift in the Intertropical Convergence Zone through the Paleogene by following the change in eolian-dust composition and flux through time (red clays) and (2) to help define the latitudinal extent, composition, and mass accumulation of plankton communities in the north equato-rial Pacific region thereby constraining ocean circulation patterns and the extent of the equatorial high-productivity belt in the Eocene ocean.
160°W 150° 140° 130°
0° 10° 20° 30° N
0 500 1000
Site 1215 Site 1216 Site 1217 Site 1218 Site 1219 Site 1220 Site 1221 Site 1222 Site 40 Site 42 Site 43
Site 69 Site 70 Site 71 Site 72 Site 160 Site 161 Site 162 Site 163 Site 573 Site 574 Site 575 Honolulu Molokai F .Z. Clipper ton F.Z.
Clarion F.Z.
Site 1216 Site 1217 Site 1218 Site 1222 Site 1221 Site 1220 Site 1215
Molokai Fracture Zone
Clarion Frac ture Zone
Mahi Mahi Fr acture Zone
Site 1219 Clipperton
Fracture Zone
574 573 575 161 162 163 40 42 43 70 71 72 0° 10° 20° 5° 15° 25° N 150°W 145° 140° 135°
km
Leg 199 sites DSDP sites
F1. Site location map, p. 16.
S N
CDP Site 1216
2.5 km 6500 6700 6600 6800 6900 7000 7100 7200 7300 7400 7500 T w o-w ay tr a veltime (ms) side echo seafloor P2 Basement
F2. Seismic reflection profile,
p. 17.
1Examples of how to reference the
whole or part of this volume.
2Shipboard Scientific Party
addresses.
Results from Site 1216 will also provide important information to test whether there was significant motion of the Hawaiian hotspot with respect to the Earth’s spin axis during the early Cenozoic. At 56 Ma, the backtracked location of Site 1216 based upon a hotspot reference frame (Gripp and Gordon, 1990, for 0- to 5-Ma Pacific hotspot rotation pole; Engebretson et al., 1985, for older poles) is about 9°N, 108°W. If signifi-cant hotspot motion or true polar wander occurred since 57 Ma (Petronotis et al., 1994), this drill site could have been much nearer to the equator.
SUMMARY
Site 1216 (21°27.16′N, 139°28.79′W) is located on abyssal hills just south of the Molokai Fracture Zone at a water depth of 5163 m. The crustal age based on magnetic lineations is ~57 Ma (magnetic Anomaly An25r). The site was chosen for drilling because it is near the thickest section of lower Eocene sediments along the 56-Ma transect. Based on previous coring and drilling ~1° in latitude to the south, we expected to find a moderately thin red-clay section overlying middle Eocene radio-larian oozes and lower Eocene carbonates. Instead, we drilled a 50-m section of red clay overlying thin cherts in sediment and abandoned the site before reaching basement. We recovered only chert in the chert–sediment section. Microfossils are absent until ~40 meters below seafloor (mbsf), where small numbers of middle Eocene radiolarians ap-pear. The cherts are early middle Eocene–early Eocene in age. We aban-doned the site after drilling to 62 mbsf because of the likelihood of large amounts of chert in the section with little sediment recovery and be-cause we could use the saved time to ensure more complete programs at the remaining sites.
The red-clay unit is similar to the red-clay section of Site 1215 but ex-panded (40 m vs. 25 m thick). The upper part of Site 1216 red clays are illite rich (based upon light absorption spectroscopy [LAS]), grading to smectite rich at the base. The transition begins at ~10 mbsf. Fe-Mn oxy-hydroxides are also abundant in the lower part of the red clays, reach-ing a maximum of ~29 mbsf, as shown by bulk-sediment analyses and grain density. A transition from relatively high to low natural gamma ray (NGR) activity occurred at ~25 mbsf. A similar transition in NGR ac-tivity was observed at Site 1215.
The sediments at Site 1216 are surprisingly barren of microfossils. Upper–middle Eocene radiolarian oozes are absent at the site, and lower–middle Eocene radiolarians are not abundant. Calcareous micro-fossils are absent in the drilled section. Only agglutinated benthic fora-minifers were found, but none are age diagnostic. The uppermost radio-larians (from Zone RP13; ~44 Ma) occur at ~40 mbsf. The base of the drilled section (62.2 mbsf) is in radiolarian Zones RP9 and RP10, which straddle the middle/early Eocene boundary (~49 Ma). The first cherts encountered downhole occurred at ~50 mbsf. Thus, these upper cherts appear in an interval of slow sedimentation rates, at most 4–5 m/m.y., presumably at the top of more rapidly deposited, lower Eocene sedi-ments with larger amounts of biogenic components. We estimated from the seismic reflection profile that ~60 m of sediments remained to be drilled within the cherty section until basement was reached.
prob-SHIPBOARD SCIENTIFIC PARTY
CHAPTER 9, SITE 1216 3
ably C20n. Magnetic intensity of the red clays is strong, and drilling-induced magnetic overprints are mostly removable by standard proce-dures.
Highlights
Red-Clay Section
The clay section at Site 1216 has several similarities to the clay section cored at Site 1215, although it is 165% thicker. Both red-clay units have a transition from illite to smectite with depth. Both show a significant decrease in NGR activity downcore. The lower parts of each red-clay unit are enriched in Fe-Mn oxyhydroxides. When mul-tisensor track (MST) records are compared, smaller events appear to cor-relate between these two sites. Provided that some age control can be developed, it may prove possible to develop a much more detailed red-clay stratigraphy for the North Pacific than is now available.
Missing Middle Eocene Radiolarian Oozes
One of the major surprises found from drilling Site 1216 is the re-markable lack of late or middle Eocene radiolarian oozes. These are bio-genic sediments that have no modern analog but are prominent sedi-mentary features from piston cores and drill sites only 1° to the south. DSDP Site 40 recovered 140 m of upper–middle Eocene radiolarian ooze beneath ~10 m of red clay. DSDP Site 41 with a thinner sediment col-umn (34 m of sediment above basalt) contains 16 m of radiolarian ooze below 18 m of red clay. Piston core EW9709-3PC, taken on the site sur-vey for the potential Leg 199 drill Site PAT-13 (19°46′N, 138°55′W), also cored 5 m of middle Eocene radiolarian ooze beneath 10 m of red clay. On the basis of this apparent sharp zonation in tropical biotic commu-nities, a major oceanographic boundary must have existed between the paleoposition of Site 1216 and Sites 40 and 41.
OPERATIONS
Transit to Site 1216 (PAT-26D)
Hole 1216A
After the drill string was deployed to a depth of 5100 meters below rig floor (mbrf), a “mudline” core was attempted from 5105.4 mbrfand resulted in a “water core,” indicating that the bit was >10 mbsf. The next attempt was made at 5115.4 mbrf with the same result. A third at-tempt was made with the bit at 5125.4 mbrf and a fourth from 5135.4 mbrf, both of which resulted in water cores. The driller then lowered the bit until the heave compensator appeared to activate, suggesting contact with a firm sea bottom at a bit depth of ~5167 mbrf. The sixth attempt at a mudline core was made with the bit at 5163.0 mbrf, and Hole 1216A finally was spudded with the advanced piston corer (APC) at 1615 hr on 6 November. The seafloor depth, indicated by the recov-ery of the first core, was 5163.3 mbrf, 50 m deeper than the precision depth recorder (PDR) depth. The usual suspects (misreading the PDR, miscounting the drill pipe, applying the wrong Matthew’s table correc-tion, and improper addition) were reviewed, but no culprit could be found. The uncorrected depth obtained during the initial site survey was also consistent with the PDR reading. The only viable reason re-maining for this depth discrepancy appeared to reside in the presence of a very strong side echo that mimicked a seafloor return on the bathy-metric record.
A total of 10 piston cores were taken at Hole 1216A (Table T1). The cores were oriented starting with 3H. The first four piston cores were full-stroke events. All the remaining piston core attempts, however, did not achieve the fully extended 9.5-m stroke of the piston corer, proba-bly because of the prevalence of chert stringers. Cores 5H–10H (37.7– 54.3 mbsf) were obtained using the advance-by-recovery method. With this method, the bit position for the next piston core is advanced only to a depth equal to the recovery of the previous core. No heat flow mea-surements were attempted because of the high probability of damage to the Adara cutting shoe by chert. APC operations in Hole 1216A resulted in 54.3 m cored with 55.11 m recovered (101.5%).
One extended core barrel (XCB) core (11X; 54.3–62.2 mbsf) was ac-quired before the hole was terminated. The XCB core advanced 7.9 m and recovered 1.36 m (17.2%). The total recovery at Hole 1216A was 56.5 m, representing 90.8% of the cored interval (Table T1).
Hole 1216B
After the bit cleared the seafloor, the vessel was offset 10 m east of Hole 1216A, and Hole 1216B was spudded with the APC at 0540 hr on 7 November. This was a single-core attempt made with the bit at 5158.0 mbrf (5 m shallower than the bit position of Core 1H). The single core recovered 9.75 m, or 102.6%.
After coring operations concluded at Site 1216, the drilling equip-ment was secured, and the beacon was successfully recovered. The 24-hr transit to the next site (PAT-19A) began at 1545 24-hr on 7 November.
LITHOSTRATIGRAPHY
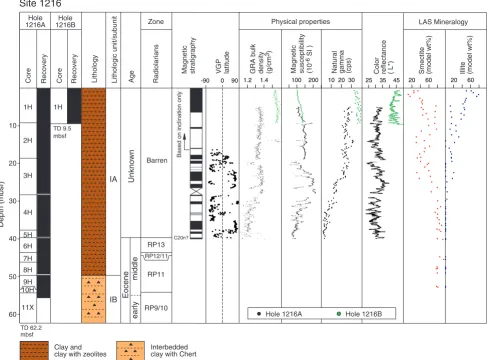
At Site 1216, we sampled a 62-m section composed of pelagic clay and chert (Fig. F3). Fifty meters of pelagic clay of Eocene and younger age overlies 12 m of interbedded pelagic clay and chert. The sedimen-tary section is divided into two lithologic subunits differentiated by the
T1. Coring summary, p. 34.
Core
Depth (mbsf)
RecoveryCore Recovery
Hole 1216AHole 1216B 1H 1H 2H 3H 4H 5H 6H 7H 8H 9H 11X 10H TD 62.2 mbsf TD 9.5 mbsf Lithologic unit/subunit Lithology Age IA Unknown Barren IB Interbedded clay with Chert Clay and clay with zeolites
Magneticsusceptibility(10
-6
SI ) Naturalgamma(cps) GRA bulkdensity(g/cm
3)
Magneticstratigraphy Color reflectance( L*) Smectite(model wt%) Illite(model wt%)
Radiolarians Physical properties Zone RP13 RP11 RP9/10 RP12/11 C20n? middle early Eocene
1.21.4 10020010 20 302535452060 2060
LAS Mineralogy
Based on inclination only
090 -90
VGPlatitude
Hole 1216A Hole 1216B 10 20 30 40 50 60 Site 1216
SHIPBOARD SCIENTIFIC PARTY
CHAPTER 9, SITE 1216 5
ratio of clay concentration vs. chert. The basal section is intensely af-fected by drilling disturbance with recovery largely limited to chert fragments. Only one core was recovered at Hole 1216B; therefore, the following lithologic description refers to the more complete sequence from Hole 1216A.
Unit I
Intervals: Cores 199-1216A-1H through 11X and 199-1216B-1H Depths: 0–62.2 mbsf (Hole 1216A) and 0–9 mbsf (Hole 1216B) Age: Holocene to Eocene
Lithology: clay, clay with zeolites, and chert
Unit I was divided into two subunits based upon the abundance of chert interbedded with clay.
Subunit IA
Intervals: Cores 199-1216A-1H through 8H and 199-1216B-1H Depths: 0–49.8 mbsf (Hole 1216A) and 0–9.5 mbsf (Hole 1216B) Age: Holocene to Eocene
Lithology: clay and clay with zeolites
Subunit IA is composed of pelagic clay. The first two sections of Core 199-1216A-1H contain sediments that alternate between dark brown (10YR 3/3) and brown (10YR 4/3). At the base of Section 199-1216A-1H-2, the color grades to very dark brown (10YR 2/2) and remains this color downcore. Subunit IA is also marked by thin accumulations of altered ash, zeolites, and zeolite clay layers that are yellowish brown (10YR 3/6) in color. Pronounced layers of zeolite accumulations are present in Sec-tions 199-1216A-2H-2 (14 mbsf), 3H-1 (20 mbsf), and 3H-2 (22 mbsf). Zeolites are also abundant in burrow infillings in Core 199-1216A-4H. Both micro- and macromanganese nodules are present in the upper 20 m, and a discontinuous manganese hardground is present at 39 mbsf. Both iron oxide micronodules and black (N1) chert fragments are present in the basal portion of Subunit IA, beginning at 40 and 45 mbsf, respectively.
Subunit IB
Intervals: Cores 199-1216A-9H through 11X Depths: 49.8–62.2 mbsf (Hole 1216A) Age: Eocene
Lithology: interbedded pelagic clay/chert
Subunit IB is differentiated from Subunit IA by the predominance of chert. The chert occurs as gravel-sized black (N1) fragments. Chert frag-ments result from brecciation of layers and/or nodules during drilling. Clay interlayered with the chert is not in situ because of drilling distur-bance and in many instances is completely removed.
Discussion/Summary
Site 1216 consists of a 62.2-m interval of pelagic brown clay and black chert, which have accumulated over the past 52 m.y. (see
“Sili-ceous Microfossils,” p. 6, in “Biostratigraphy”). Core recovery was
increasing frequency of chert. In contrast to Site 1215, there is no pro-nounced evidence for cyclical sedimentation or marked color changes representing critical transitions in Unit I.
BIOSTRATIGRAPHY
The red clays of Site 1216 (Subunit 1A; Fig. F3) are barren of calcare-ous microfossils. Biostratigraphic control was provided by shipboard analysis of sporadic occurrences of silicious microfossils in the lower part of Hole 1216A (Fig. F4). The assemblages encountered indicate an early Eocene–middle Eocene age for these sediments. The fossil content of the upper part of the sequence is limited to ichthyoliths and occa-sional concentrations of agglutinated benthic foraminifers. The single core recovered from Hole 1216B (Core 199-1216B-1H) contained only ichthyoliths.
Siliceous Microfossils
Radiolarians were found in Samples 199-1216A-6H-1, 40–42 cm, through 11H-CC (Table T2). However, they are never common, preser-vation is generally poor, and only in Core 199-1216A-6H are they mod-erately well preserved. It was difficult to disaggregate the clay compo-nent of the samples, and in most cases, NaOH was used in addition to the usual cleaning process (Sanfilippo et al., 1985). Zonal designations are somewhat tentative because the absence of certain species may be a reflection of poor preservation rather than true faunal composition.
Sample 199-1216A-6H-1, 40–42 cm, and slurry from Section 6H-3 contain Eusyringium lagena and an early form of Eusyringium fistu-ligerum, thus placing the samples in middle Eocene Zone RP13 (Sanfil-ippo and Nigrini, 1998). The last occurrence of Thyrsocyrtis hirsuta ap-pears to be in Sample 199-1216A-7H-1, 47–49 cm, suggesting that this sample belongs to either Zone RP12 or RP11. The next relatively reliable datum is the first occurrence of Dictyoprora mongolfieri in Sample 1216A-9H-CC, which requires that all samples between Cores 199-1216A-9H and 7H lie within Zone RP11. The presence of Buryella clinata
in Sample 199-1216A-11X-CC, together with the absence of Thyrsocyrtis rhizodon, places that sample in uppermost Zone RP9 or lowermost RP10. These zones straddle the lower/middle Eocene boundary.
Benthic Foraminifers
Benthic foraminiferal assemblages at Site 1216 are composed of ag-glutinated forms only. Calcareous benthic foraminifers were not found in any of the samples examined. The taxa identified are long ranging (Cretaceous–Holocene) and cosmopolitan and, therefore, of little strati-graphic utility. Species diversity of foraminiferal assemblages is low, and species identification is problematic because of poor preservation and fragmentation of the delicate tests during sample preparation. The dis-tribution of benthic foraminifers is reported in Table T3.
Samples 199-1216A-1H-CC through 3H-CC and 10H-CC through 11X-CC are barren of benthic foraminifers. Samples 199-1216A-4H-CC and 5H-CC are dominated by agglutinated forms. The assemblages are mainly characterized by Amodiscus sp., Bathysiphon sp., Trochammi-noides proteus, and Glomospira gordialis. Miliammina sp. is also frequently present. These taxa indicate bathyal to abyssal paleodepths. Sample
Core
Depth (mbsf)
Recovery Core Recovery 0 10 20 30 40 50 60
Hole 1216A Hole 1216B
1H 1H 2H 3H 4H 5H 6H 7H 8H 9H 11X
10H
TD 62.2 mbsf
TD 9.5 mbsf
Series Radiolarians Not zoned Barren
RP13 RP11 RP9/10 RP12/11
Eocene
middle
early
F4. Distribution of
biostrati-graphic zones for radiolarians, p. 19.
T2. Distribution of radiolarians,
p. 35.
T3. Distribution of agglutinated
SHIPBOARD SCIENTIFIC PARTY
CHAPTER 9, SITE 1216 7
199-1216A-6H-3, 104–106 cm, contains poorly preserved and frag-mented benthic foraminifers. Assemblages from Samples 199-1216A-7H-CC and 8H-CC are less diverse than those from Samples 4H-CC and 5H-CC, but the dominant taxa are the same as in previous samples, in-dicating similar paleodepths. Benthic foraminifers are not found in Sample 199-1216B-1H-CC.
PALEOMAGNETISM
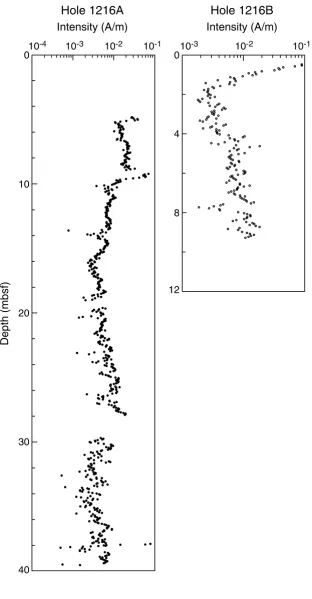
The archive-half core sections from Holes 1216A and 1216B were measured on the shipboard pass-through cryogenic magnetometer, ex-cept sections that were clearly disturbed by drilling in Cores 199-1216A-6H through 10H and 11X. The natural remanent magnetization (NRM) was measured at 5-cm intervals in each core section, followed by alter-nating-field (AF) demagnetization at 5, 10, 15, and 20 mT peak field. No discrete samples were demagnetized at this stage. Most of the measured cores displayed consistent remanent inclination and declination direc-tions. NRM intensities were in the order of 10–1 to 10–2 A/m and de-creased to about 10–3 to 10–2 A/m after partial AF demagnetization at 20 mT (Fig. F5), similar to those of Site 1215. Uncleaned NRM inclinations have steep downward directions of ~80°, indicative of a strong drilling-induced overprint. This overprint was partially removed and typically disappeared after AF demagnetization at 10–15 mT. For the characteris-tic remanent magnetization (ChRM), we have used the directions ob-tained after a blanket demagnetization at 20 mT, although the magnetic directions did not reach a stable point suggesting that the ChRM has been only partially isolated. A more reliable ChRM might be obtained by vector analysis of the measured data and shore-based measurements.
Orientation
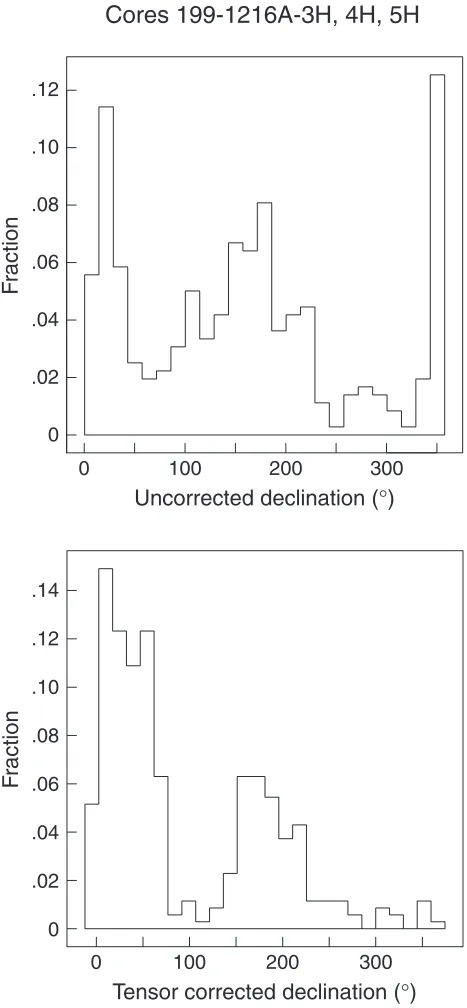
The Tensor tool was used to orient cores collected from Hole 1216A starting with Core 199-1216A-3H. The single core from Hole 1216B was not oriented. The orientation was successful in aligning the declina-tions between most cores as shown in Figure F6. The corrected declina-tions of the magnetic vectors were very useful in assessing polarity changes, otherwise the inclinations by themselves would produce an ambiguous record as a result of the low paleolatitude of this site.
Discrete Sample Analysis
Bulk magnetic susceptibility (MS) was measured on discrete samples taken from Hole 1216A, but no demagnetization was attempted.
Magnetic Polarity Stratigraphy
The magnetic declinations of the oriented cores are relatively well be-haved and are grouped in two antipodal clusters (Fig. F6) with a preva-lence of northward directions. In the measured archive halves of Hole 1216A, the 20-mT AF demagnetization directions have an average incli-nation value around 35° with large scatter (σ = 20). Despite the average inclination value, many samples, especially in the upper 15 mbsf of Hole 1216A, have rather steep inclinations that are not compatible with either the present field inclination or the paleolatitude of the site. We speculate that coring in soft sediment might have affected the
inclina-Hole 1216A Hole 1216B Intensity (A/m) Intensity (A/m)
Depth (mbsf)
10-4 10-3 10-2 10-1 0
10
20
30
40
0 4
8 12
10-3 10-2 10-1
F5. Magnetization intensities after
AF demagnetization, p. 20.
Uncorrected declination (°) Cores 199-1216A-3H, 4H, 5H
F
raction
.10 .08 .06 .04 .02 0 .12
0 100 200 300
.10 .08 .06 .04 .02 0 .14 .12
F
raction
Tensor corrected declination (°) 0 100 200 300
F6. Comparison of uncorrected
tions by physically reorienting the sediment close to the core edges to a nearly vertical direction. In addition, the magnetic field inside the bar-rel produces a secondary overprint on the sediments. These hypotheses need to be further explored in postcruise analyses comparing discrete samples taken from the middle and external parts of the core.
No paleomagnetic record was obtained from the top 5 m in Hole 1216A because of core disturbance. Furthermore, the major change in the inclination record in the upper part of Hole 1216A (at 10 mbsf) can-not be unambiguously interpreted.
In oriented cores below 19 mbsf in Hole 1216A, the magnetic polar-ity has been computed by the virtual geomagnetic pole (VGP) latitude that combines the information from both inclinations and declina-tions. Because of the quality of the declination record in this site, the VGP latitude is very effective in outlining several geomagnetic reversals (Fig. F7) although the interpretation of the magnetic chrons is not un-equivocal. Based on the radiolarian zonation (Zone RP13), we believe that Chron C20n can be found at the base of Core 199-1216A-5H at ~40 mbsf.
COMPOSITE DEPTHS
Hole 1216A extended to a depth of 55.66 mbsf. Cores 199-1216A-5H through 11X were highly disturbed and recovered mostly chert frag-ments. Only one core was recovered from Hole 1216B, after which Site 1216 was abandoned. Therefore, it was not possible to generate com-posite depth or spliced records for Site 1216. Here, we present a compar-ison of cleaned and culled Site 1216 MST and color reflectance data to spliced records from Site 1215.
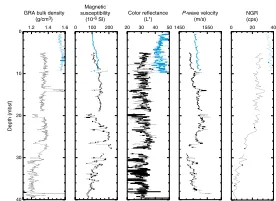
MST and color reflectance data were collected from Holes 1216A and 1216B. MS, P-wave velocity, and color reflectance data were collected at 2-cm intervals and gamma ray attenuation (GRA) bulk density at 4-cm intervals on all cores recovered from Holes 1216A and 1216B (see
“Physical Properties,” p. 12, and “Lithostratigraphy,” p. 4, for details
[image:8.612.434.572.584.685.2]about MST and color reflectance data). Cores 199-1216A-5H through 11X recovered mostly chert fragments, and MST data from these cores are unreliable. Table T4 lists intervals from Holes 1216A and 1216B that are interpreted to be disturbed and are excluded from further discus-sion.
Figure F8 illustrates the MST and color reflectance data from Site 1216 on an mbsf depth scale after culling intervals given in Table T4.
On the basis of MST and color reflectance data alone, it is not possible to reliably determine a depth offset between Hole 1216A and 1216B. The MS data from Hole 1216B have different absolute values, most likely attributable to core disturbance in the upper intervals of both holes. Compressional wave–velocity data from both holes exhibit an apparent 1.5-m cyclicity directly correlatable to the 1.5-m section breaks within the cores. The cyclicity is an artifact of the core-section-ing process that results in a reduction of porosity toward the ends of core sections. Paleomagnetic intensity data suggest, however, that Hole 1216A should probably be offset downward with respect to Hole 1216B by ~3 m (see “Paleomagnetism,” p. 7).
At Site 1216, the MST-NGR data (Fig. F8) have a trend that is very similar to that expressed at Site 1215. Based on the NGR and MS data, an attempt was made to correlate MST data recovered from Site 1216 with those from Site 1215. The correlation of data between Sites 1215
Oriented cores
40 35 30 25 20
Depth (mbsf)
15 10 5
-40 0 40 80 Inclination (°)
-40 -80 0 40 80
VGP latitude (°) Polarity
F7. Magnetic stratigraphy, p. 22.
T4. Core disturbance table, p. 37.
1.2 1.4 1.6
Depth (mbsf)
0 20 40 20 30 40 50 1450 1550 0 100 200
GRA bulk density (g/cm3)
Magnetic susceptibility
(10-6 SI) Color reflectance(L*) P-wave velocity(m/s) NGR(cps) 0
10
20
30
40
F8. GRA bulk density, MS, color
re-flectance, P-wave velocity, and
SHIPBOARD SCIENTIFIC PARTY
CHAPTER 9, SITE 1216 9
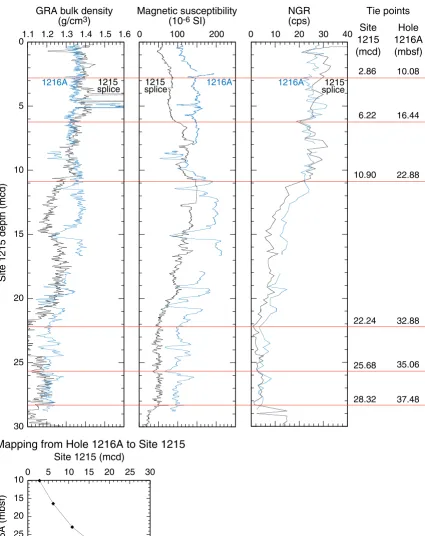
and 1216 was performed using the software package Analyseries (ver-sion 1.2) (Paillard et al., 1996). The strategy chosen was to maximize the fit between the MS data from Site 1216A and the spliced records from Site 1215, also taking into consideration paleomagnetic data that suggest a reversal in polarity at ~10 mbsf in Hole 1216A can also be identified at ~2 mbsf in Hole 1215A (2.8 meters composite depth [mcd]). Data points from Hole 1216A were linearly interpolated be-tween these ties. The resulting match can be evaluated in Figure F9,
which also shows the location of tie points and their corresponding depth. The points at which data from both sites were matched are also given in Figure F9. With respect to the mcd scale of Site 1215, the linear sedimentation rate (LSR) of Hole 1216A (on an mbsf scale) is approxi-mately a factor of 1.6 greater to a depth of 22 mbsf and approxiapproxi-mately similar to that of Site 1215 from 22 to 37.5 mbsf in Hole 1216A (Fig.
F9).
SEDIMENTATION AND ACCUMULATION RATES
Average LSRs at Site 1216 are based primarily on paleomagnetic re-versals and radiolarian zonal boundaries as defined in Hole 1216A (Ta-bles T5,T6, respectively). Because only one core was taken at the top of Hole 1216B, no composite depth for the site was calculated. LSR values are combined with the dry bulk density (DBD) data (from porosity mea-surements on individual samples, averaged over the intervals reported) (see “Physical Properties,” p. 12) (Table T11) to determine the mass ac-cumulation rates (MARs) of the sediments.
The paleomagnetic inclination data (see “Paleomagnetism,” p. 7) (Fig. F7) show one comparatively long normal event at the top of Hole 1216A. The base of this event at 10 mbsf, if it represents the base of Sub-chron C1r.1n (Jaramillo), would have an age of ~1 Ma. The magnetic re-versal data are very compressed because of the low sedimentation rates in the pelagic clay facies; thus, it is difficult to recognize the standard magnetic reversal chronology. However, based on the presence of radio-larians from Zone RP13 in Core 199-1216A-6H (see “Biostratigraphy,”
p. 6) (Table T3), it is thought that the reversal near the base of Core 199-1216A-5H (see “Paleomagnetism,” p. 7) (Fig. F7) may be the top of Chron C20n, and the base of the long normal section above the overly-ing reversed interval may be the base of Chron C19n. These very tenta-tive magnetic reversal identifications are used together with three iden-tified radiolarian zonal boundaries (Tables T5, T6) to establish the sedimentation rates for Site 1216 (Fig. F10).
By combining LSR values with DBD data, we determined the MAR of the total sediment (Table T7). Sediment with an LSR of 1.0 cm/k.y. and a DBD of 1.0 g/cm3 will have a MAR value of 1.0 g/cm2/k.y. The ob-served values are rarely this high, so we report the data in milligrams per square centimeter per thousand years (mg/cm2/k.y.).
Lithologic Subunit IA, pelagic clay, is characterized by two LSR val-ues. DBD values range from 0.3 to 0.55 g/cm3 in this unit. Fluxes are high at the top, averaging ~500 mg/cm2/k.y. for this uppermost 1-m.y. interval, if the uppermost normal paleomagnetic interval does repre-sent Chron C1n through Subchron C1r.1n. These values are signifi-cantly higher than MAR values reported elsewhere for this facies (J.D. Gleason, et al., unpubl. data; Kyte et al., 1993; Janecek and Rea, 1983). MAR values for the bulk of the pelagic clay unit range from 20 to 40 mg/cm2/k.y., a more normal range for pelagic “red” clays.
Site 1215 (mcd)
Site 1215 depth (mcd)
1216A 1215
splice 1215splice 1216A 1216A splice1215 Hole 1216A (mbsf)
0 51015202530 Mapping from Hole 1216A to Site 1215
Site 1215 (mcd)
Site 1216A (mbsf)
2.86 6.22 10.90 22.24 25.68 28.32 10.08 16.44 22.88 32.88 35.06 37.48 Magnetic susceptibility (10-6 SI) NGR (cps) Tie points GRA bulk density
(g/cm3) 0 5 10 15 20 25 30
0 100 200 0 10203040 1.1 1.2 1.3 1.4 1.5 1.6
10 15 20 25 30 35 40
F9. Plot of GRA bulk density, MS,
and natural gamma count data from Hole 1216A, matched to the spliced data from Site 1215, p. 24.
T5. Paleomagnetic events, p. 38.
T6. Radiolarian events, p. 39.
0 10 20 30 40 50 60
0 10 20 30 40 50
Depth (mbsf) Age (Ma) Radiolarians Paleomagnetic reversal 1.14 m/m.y. 9.54 m/m.y. 0.7 m/m.y. 10.0 m/m.y. 480 mg/cm2/k.y. 550 mg/cm2/k.y. 40 mg/cm2/k.y.
25 mg/cm2/k.y. 20 mg/cm2/k.y. (No usable density data)
F10. Plot of biostratigraphic and
paleomagnetic datum levels vs. mbsf, p. 25.
T7. Linear sedimentation rates and
GEOCHEMISTRY
Interstitial Water Geochemistry
We collected interstitial waters from five samples in Hole 1216A at depths ranging from 4.45 to 47.65 mbsf (Table T8; Fig. F11). However, major ion concentrations of the interstitial water sample taken from 47.65 mbsf indicate contamination with seawater, most likely caused by the incomplete core recovery and the resulting contact with sea-water (this sample is not plotted in Fig. F11). Similar to results from Site 1215, chemical gradients in the interstitial waters at this site primarily reflect the limited amount of organic matter diagenesis, the generally nonbiogenic character of the sediments, and possibly a small diffusive signal of chemical reactions in the underlying basalt.
Chlorinity, as measured by titration, increases with depth from val-ues around standard seawater (559 mM) at 4.45 mbsf to valval-ues of 564 mM at 32.65 mbsf (Fig. F11). Sodium concentrations determined by charge balance were, on average, 2% lower than those measured by ion chromatograph. Sodium concentrations as determined by charge bal-ance generally remain steady at values similar to that of average sea-water. Salinity, as measured by a handheld refractometer, did not vary downcore; all interstitial waters were measured as 35.0.
Alkalinity and pH did not vary significantly downcore in noncon-taminated samples at Site 1216. Dissolved silica concentrations increase with depth, from values of around 210 µM at 4.45 mbsf to values of ~610 µM at 32.65 mbsf. Dissolved silica concentrations increase more rapidly with depth than at Site 1215, consistent with the presence of ra-diolarians in deeper cores (from ~40 mbsf).
Interstitial water sulfate concentrations are high (>27 mM) through-out the section, indicating that the amount of labile organic matter available for oxidation is extremely low. Ammonium is a byproduct of organic matter degradation and is present in extremely low levels (<10 µM), consistent with the high sulfate values.
Dissolved manganese concentrations are low throughout the intersti-tial water profile at Site 1216. Manganese concentrations slightly in-crease downcore, from levels of ~1 µM at 4.45 mbsf to levels of ~3 µM at 32.65 mbsf. Strontium concentrations are similar to seawater throughout the pore water profile. The absence of a middepth stron-tium maximum likely reflects the low carbonate content of the sedi-ments. Lithium pore water values are generally low (between 30 and 40 µM) and show a slight increase downcore.
Calcium concentrations in the pore waters from Site 1216 are similar to that of seawater (~10 mM), with a slight increase at 32.65 mbsf to values of ~11 mM. Magnesium concentrations also increase with depth, reaching levels similar to that of seawater at 32.65 mbsf. Magnesium concentrations in the pore waters from the upper three cores from Site 1216 (4.45–23.15 mbsf) are lower than that of seawater, perhaps indi-cating magnesium uptake in the precipitation of authigenic minerals. Potassium concentrations decrease downcore, consistent with chemical alteration of basement rocks, suggesting that the hydrothermal signal in the pore water magnesium and calcium profiles is masked by the ef-fects of additional processes. Dissolved barium concentrations are low (<0.45 µM) and show no systematic variation with depth. Levels of dis-solved boron decrease with depth, from values of ~650 µM at 4.45 mbsf to values of ~530 µM at 32.65 mbsf.
T8. Interstitial water data, p. 41.
550 560 570 0 10 20 30 40
Cl (mM)
Depth (mbsf)
2 2.5 3 Alkalinity (mM)
27 28 29 SO4 (mM)
0 5 10 NH4 (µM)
0 400 800 H4SiO4 (µM)
0 30 60 Ca and Mg (mM)
11 12 13 0 10 20 30 40
K (mM)
Depth (mbsf)
0 0.25 0.5 Ba (µM)
0 2.5 5 Mn (µM)
400 600 800 B (µM)
25 37.5 50 Li (µM)
80 85 90 Sr (µM)
F11. Interstitial water geochemical
SHIPBOARD SCIENTIFIC PARTY
CHAPTER 9, SITE 1216 11
In summary, the pore water profiles from this site primarily reflect the dissolution of biogenic silica, authigenic mineral precipitation, pos-sible alteration of underlying basalt, and subsequent diffusion. High levels of sulfate and concomitant low levels of ammonium suggest a rel-atively oxic environment, consistent with the occurrences of metallifer-ous oxides within the sediment. Silica and alkalinity levels in the inter-stitial waters are higher than seawater values, indicating that biogenic silica was a more important component of the original sedimentary de-posits than is obvious by visual inspection of the cores.
Solid-Phase Geochemistry
We collected bulk-sediment samples adjacent to the interval sampled for physical properties (see “Physical Properties,” p. 12), resulting in a sampling resolution of approximately one per section from 0.72 to 52.79 mbsf in Hole 1216A (Table T9; Fig. F12). We also collected sam-ples from 1.18 to 8.68 mbsf in Hole 1215B (Table T9). We measured sili-con, aluminum, titanium, iron, manganese, calcium, magnesium, phosphorus, strontium, and barium concentrations in the sediment by inductively coupled plasma–atomic emission spectroscopy (ICP-AES). Bulk-sediment geochemistry primarily reflects the predominant red-clay lithology of the sediments.
Silicon varies between ~17 and ~25 wt% (Fig. F12). Silicon decreases from ~25 wt% at 0.72 mbsf to ~17 wt% at 29.22 mbsf and is ~22 wt% at 52.79 mbsf. The exception to this trend is a spike of silicon of ~29 wt% at 39.29 mbsf that corresponds to a relative minimum in all other ele-ments measured, presumably because of dilution by the large amount of silicon. Possibly, the sample at 39.29 mbsf may have included a small fragment or nodule of chert.
Aluminum and titanium in Hole 1216A follow similar trends to one another. Between 0.72 and 39.29 mbsf, aluminum decreases from 8.5 to 1.4 wt% and titanium decreases from 0.51 to 0.07 wt%. After reaching minimum values at 39.29 mbsf, aluminum remains steady at ~2.8 wt%, and titanium remains steady at ~0.12 wt%. The Al/Ti ratio is ~25 and is high relative to the Post-Archean Average Shale value of 16.7 (Taylor and McLennan, 1985) (see Fig. F19, p. 70, in the “Leg 199 Summary” chapter).
Iron contents are relatively constant (~5 wt%) to ~21 mbsf, then in-crease to a peak of 17.89 wt% at 29.22 mbsf. Below this depth, iron re-mains at ~12 wt% in the rest of the hole, except for a low of 7.14 wt% at 39.29 mbsf. Manganese increases from 0.91 wt% at 0.72 mbsf to a peak of 3.76 wt% at 29.22 mbsf and for the rest of the hole varies between 1.78 and 3.6 wt%.
Calcium is <2 wt% in the entire hole, consistent with the lack of car-bonate. Likewise, strontium is low, at ~200 ppm, throughout. Magne-sium decreases from 2.2 wt% at 0.72 mbsf to 1.5 wt% at ~10 mbsf. Sub-sequently, Mg shows a modest increase downcore to values of almost 3 wt% at 52.79 mbsf, with the exception of a low at 39.29 mbsf.
Phosphorus is uniformly low at <0.5 wt% in Hole 1216A. Barium in-creases downcore from ~1090 ppm at 0.72 mbsf to a peak value of 4200 ppm at 52.79 mbsf.
Calcium carbonate (CaCO3; in weight percent) and organic carbon (Corg) (in weight percent) were determined for approximately two sam-ples per core from Hole 1216 (Table T10). CaCO3 measured by coulo-meter is low (less than or equal to ~1 wt%) for all of the sediments from
T9. Bulk-sediment data, p. 42.
0102030 0 20 40 60
Si (wt%)
Depth (mbsf)
0 4 8 Al (wt%)
0 2 4 0 20 40 60
Ca (wt%)
Depth (mbsf)
0 2 4 Mg (wt%)
0 1 2 P (wt%)
0 1000 Sr (ppm)
0 4000 Ba (ppm) 00.20.40.6
Ti (wt%)
01020300 2 4 Mn (wt%) Fe (wt%)
F12. Bulk-sediment geochemical
data, p. 27.
T10. Calcium carbonate and
Site 1216. CaCO3 values calculated from Ca contents (in weight per-cent) yielded similar trends to CaCO3 measured via coulometer, al-though absolute values are negative, indicating a problem with the cali-bration at very low carbonate values (Table T10) (see “Geochemistry,”
p. 20, in the “Explanatory Notes” chapter). Corg is uniformly low (0– 0.09 wt%) for all samples measured (Table T10).
In summary, the bulk geochemistry of the sediments from Site 1216 is very similar to that in the red-clay unit of Site 1215.
PHYSICAL PROPERTIES
Physical properties at Site 1216 were measured on whole cores, split cores, and discrete samples. MST measurements (bulk density, MS, P -wave velocity, and natural gamma radiation) and thermal conductivity comprised the whole-core measurements. Compressional wave velocity measurements on split cores and moisture and density (MAD) analyses on discrete core samples were made at a frequency of one per section. Because the first three sections of Core 199-1216A-1H were significantly disturbed, the corresponding interval in Hole 1216B was sampled. LAS analyses were performed on the MAD samples as well as an additional one sample per section (located ~50 cm from the MAD sample).
Density and Porosity
Two methods were used to evaluate the wet bulk density at Site 1216. GRA provided an estimate from whole cores. MAD samples gave a sec-ond, independent measure of wet bulk density, along with providing DBD, grain density, water content, and porosity from discrete samples (Table T11). MAD wet bulk densities trend ~0.05 g/cm3 higher than the GRA estimated densities in the uppermost 30 m at Site 1216 (Fig. F13). Below 30 mbsf the two bulk density measures coincide more closely. Crossplots of wet bulk densities and DBD vs. interpolated GRA density (Fig. F14) show that despite the offset in the upper section of the site, the overall match between the data sets is very good.
Wet bulk density values are nearly constant about a mean of 1.41 g/ cm3 from the seafloor to 30 mbsf. Between 30 and 35 mbsf, wet bulk density decreases uniformly to 1.19 g/cm3. This shift in density corre-sponds to the transition from illite-rich to smectite-rich clays as indi-cated by the LAS analyses. Below 35 mbsf, wet bulk density is more vari-able and ranges from 1.21 to 1.32 g/cm3. Grain densities are ~2.6 g/cm3 in the uppermost 20 m at Site 1216. Within the interval of 20–29 mbsf, grain density increases downcore to a maximum of ~2.9 g/cm3. This in-crease may be the result of higher concentrations of Fe and Mn in sedi-ments (see “Geochemistry,” p. 10). Below 30 mbsf, there is a large de-crease in grain density that is consistent with a change from illite to smectite dominance in the sediment (as indicated by LAS analyses). Omitting an anomalous value of 2.57 g/cm3 at 39.30 mbsf, grain den-sity averages 2.16 g/cm3 in this interval (smectite has a grain density of ~2.2 g/cm3). Porosity is ~75% from the seafloor to 25 mbsf. From 25 to 32 mbsf, it increases to 83%. Below 32 mbsf, porosity remains high, av-eraging 82%.
T11. Moisture and density, p. 44.
0 10 20 30 40 50 60
50 70 90
Depth (mbsf) Porosity (%) A Water content (%)
1.01.21.41.61.8 Wet bulk density
(g/cm3)
B
GRA bulk density (g/cm3)
2.0 2.4 2.8 Grain density
(g/cm3)
C IA IB Lithologicunit/sub u nit
F13. Moisture and density
mea-surements, p. 28.
1.0 1.2 1.4
1.0 1.2 1.4 y = 0.059 + 1.002x R = 0.92
W
et b
ulk density (g/cm
3) A
0.3 0.5 0.7
1.0 1.2 1.4 y = -1.248 + 1.395x R = 0.91
Dr
y b
u
lk density (g/cm
3)
Interpolated GRA density (g/cm3)
B
F14. Wet and dry bulk density vs.
SHIPBOARD SCIENTIFIC PARTY
CHAPTER 9, SITE 1216 13
LAS
LAS studies were conducted on cores from Hole 1216A at a frequency of two samples per section (see Vanden Berg and Jarrard, this volume, for a discussion of the LAS technique). Semiquantitative mineral con-centrations were calculated from the collected spectra, assuming a four-component system: calcite, opal/silica, smectite, and illite (Table T12). LAS-derived mineralogical data (Fig. F15) show that illite decreases downhole while smectite increases. The illite–smectite transition near 25 mbsf may be the same transition that occurs at 10 mbsf in Hole 1215A. Estimated opal/silica concentrations probably reflect other min-erals, such as zeolites, because very little biogenic opal was present at this site (see “Biostratigraphy,” p. 6). Calcite is probably overestimated because the clays are barren of calcareous microfossils (see
“Bio-stratigraphy,” p. 6) and Ca contents measured by ICP-AES analyses are
relatively low (see “Geochemistry,” p. 10).
Compressional Wave Velocity
Compressional wave velocity was measured by the P-wave logger (PWL) on whole cores from Holes 1216A and 1216B and by the inser-tion and contact probe systems on split cores from Hole 1216A and Hole 1216B (Table T13). Measurements with the insertion probe system were restricted to soft sediments in the uppermost 38 m at Site 1216. The match between the whole-core and split-core measurements is rela-tively good (Fig. F16). The discrete values either coincide with the PWL velocities or are up to 15 m/s higher than whole-core measurements. The general trends in the velocities are an increase from 1485 m/s near the seafloor to 1520 m/s at 23 mbsf, a decrease to ~1505 m/s at 32 mbsf, and higher, more variable velocities below 32 mbsf.
Velocity anisotropy was calculated from longitudinal (z-direction) and transverse (y-direction) measurements provided by the insertion probe system to evaluate burial-induced changes in sediment fabric. The anisotropy ranges from –0.7% to 1.8% (Table T13) and averages 0.9%, with no consistent trend with depth.
Thermal Conductivity
Thermal conductivity was measured on the third section of cores from Site 1216 (Table T14). The thermal conductivity averages 0.77 W/ (m·K). As is the case at Site 1215, there is a general inverse relation rela-tionship between thermal conductivity and porosity at Site 1216.
NGR
NGR was measured on all whole-cores at Site 1216 and displays trends similar to the other physical properties (Fig. F17). Between the seafloor and 24 mbsf, NGR values are high, 20 to 32 counts per second (cps), coinciding with the illite-rich pelagic clay. The NGR values de-crease to ~2 cps at 35 mbsf and remain at this level to the bottom of Hole 1216A. This change is consistent with the transition to more smectite-rich clay.
T12. LAS-based mineralogy, p. 45.
IA
Holocene to Eocene
IB Eocene Depth (mbsf) Age Lithologicunit/sub unit
0255075 100 0255075 100 0255075 100 0255075 100 0 10 20 30 40 50 60 Calcite
(model wt%) (model wt%)Opal/Silica (model wt%)Smectite (model wt%)Illite
F15. LAS mineralogy
determina-tions, p. 30.
T13. Split-core velocity
measure-ments, p. 46.
0 10 20 30 40 50 60 1450 1500 15501600
Depth (mbsf) Velocity (m/s) IA IB Lithologicunit/sub unit
F16. Compressional wave velocity
and transverse velocity, p. 31.
T14. Thermal conductivity, p. 47.
0 10 20 30 40 50 60
0 20 40
Depth (mbsf) Natural gamma (cps) IA IB Lithologicunit/sub u nit
F17. Natural gamma radiation,
MS
Whole-core MS measurements display greater variability than other properties and do not follow the identified changes in lithology (Fig.
F18). The susceptibility increases from 75 × 10–6 SI at the seafloor to ap-proximately 200 × 10–6 SI at 10 mbsf. Between 10 and 20 mbsf, MS val-ues are more uniform in a range of 125 to 165 × 10–6 SI. Below 20 mbsf, the susceptibility is more variable and increases to 215 × 10–6 SI at 28 mbsf. A variable, but consistent decrease to 75 × 10–6 SI coincides with the proposed transition to more smectite-rich clay between 30 and 40 mbsf. Below this depth, measurements are few as a result of coring dis-turbance and the MS values are ~75 × 10–6 SI.
0 10 20 30 40 50 60
0 50 100150200
Depth (mbsf)
Magnetic susceptibility (10-6 SI)
IA
IB Lithologicunit/sub
u
nit
F18. Magnetic susceptibility,
SHIPBOARD SCIENTIFIC PARTY
CHAPTER 9, SITE 1216 15
REFERENCES
Atwater, T., and Severinghaus, J., 1989. Tectonic maps of the northeast Pacific. In
Winterer, E.L., Hussong, D.M., and Decker, R.W. (Eds.), The Eastern Pacific Ocean and Hawaii. Geol. Soc. Am., Geol. of North America Ser., N:15–20.
Engebretson, D.C., Cox, A., and Gordon, R.G., 1985. Relative Motions Between Oceanic and Continental Plates in the Pacific Basin. Spec. Pap.—Geol. Soc. Am., 206.
Gripp, A.E., and Gordon, R.G., 1990. Current plate velocities relative to the hotspots incorporating the NUVEL-1 global plate motion model. Geophys. Res. Lett., 17:1109– 1112.
Janecek, T.R., and Rea, D.K., 1983. Eolian deposition in the northeast Pacific Ocean: Cenozoic history of atmospheric circulation. Geol. Soc. Am. Bull., 94:730–738. Kyte, F.T., Leinen, M., Heath, G.R., and Zhou, L., 1993. Cenozoic sedimentation
his-tory of the central North Pacific: inferences from the elemental geochemistry of Core LL44-GPC3. Geochim. Cosmochim. Acta, 57:1719–1740.
Moore, T.C., Jr., Rea, D.K., Lyle, M., and Liberty, L.M., 2002. Equatorial Ocean circula-tion in an extreme warm climate: Paleoceanography. 10.1029/2000PA000566,13. Paillard, D., Labeyrie, L., and. Yiou, P., 1996. Macintosh program performs time-series
analysis. Eos, 77:379.
Petronotis, K.E., Gordon, R.G., and Acton, G.D., 1994. A 57 Ma Pacific plate paleo-magnetic pole determined from a skewness analysis of crossings of marine mag-netic anomaly 25r. Geophys. J. Int., 118:529–554.
Sanfilippo, A., Westberg-Smith, M.J., and Riedel, W.R., 1985. Cenozoic radiolaria. In
Bolli, H.M., Saunders, J.B., and Perch-Nielsen, K. (Eds.), Plankton Stratigraphy: Cam-bridge (CamCam-bridge Univ. Press), 631–712.
Sanfilippo, A., and Nigrini, C., 1998. Code numbers for Cenozoic low latitude radio-larian biostratigraphic zones and GPTS conversion tables. Mar. Micropaleontol.,
33:109–156.
Figure F1. Location of Site 1216 along the Leg 199 transect. In the lower panel, gray shading = water depths >5000 mbsl, red shading = approximate position of magnetic Anomaly C25, the nominal target crust for the 56-Ma transect. Open circles = location of DSDP drill sites.
160°W 150° 140° 130°
0° 10° 20° 30° N
0 500 1000
Site 1215
Site 1216
Site 1217
Site 1218 Site 1219
Site 1220 Site 1221 Site 1222
Site 40
Site 42 Site 43
Site 69 Site 70
Site 71
Site 72
Site 160 Site 161
Site 162
Site 163
Site 573 Site 574
Site 575
Honolulu
Molokai F.Z.
Clipperton F .Z.
Clarion F.Z.
Site 1216
Site 1217
Site 1218 Site 1222
Site 1221
Site 1220 Site 1215
Molokai Fracture Zone
Clarion Fracture Zone
Mahi Mahi Fracture Zone
Site 1219
Clipperton Fracture Zone
574
573 575 161
162
163
40
42 43
70
71
72
0° 10° 20°
5° 15° 25° N
150°W 145° 140° 135°
km
S
HI
PBO
ARD
S
CI
EN
T
IF
IC
P
ART
Y
C
HA
P
T
E
R
9,
S
IT
E
12
16
[image:17.612.51.698.116.491.2]17
Figure F2. Seismic reflection profile across Site 1216 collected on the EW9709 site survey cruise. The region has thin but continuous sediment cover on abyssal hill topography.
S N
CDP Site 1216
2.5 km 6500
6700 6600
6800
6900
7000
7100
7200
7300
7400
7500
T
w
o-w
a
y
tr
a
v
eltime (ms)
side echo seafloor
P2
Figure F3. Lithologic summary for Site 1216. VGP = virtual geomagnetic pole, GRA = gamma ray attenua-tion, LAS = light absorption spectroscopy, cps = counts per second, TD = total depth.
Core
Depth (mbsf)
Recovery Core Recovery
Hole
1216A 1216BHole
1H 1H
2H
3H
4H
5H
6H
7H
8H
9H
11X 10H
TD 62.2 mbsf
TD 9.5 mbsf
Lithologic unit/subunit
Lithology Age
IA Unknown
Barren
IB
Interbedded clay with Chert Clay and
clay with zeolites
Magnetic susceptibility (10
-6
SI )
Natural gamma (cps) GRA bulk density (g/cm
3)
Magnetic stratigraphy Color reflectance ( L*) Smectite (model wt%) Illite (model wt%)
Radiolarians
Physical properties Zone
RP13
RP11
RP9/10
RP12/11 C20n?
middle
early
Eocene
1.2 1.4 100 200 10 20 30 25 35 45 20 60 20 60
LAS Mineralogy
Based on inclination only
0 90 -90
VGP latitude
Hole 1216A Hole 1216B
10
20
30
40
50
60
SHIPBOARD SCIENTIFIC PARTY
[image:19.612.85.274.92.408.2]CHAPTER 9, SITE 1216 19
Figure F4. Distribution of biostratigraphic zones for radiolarians at Site 1216. TD = total depth.
Core
Depth (mbsf)
Recovery Core Recovery
0
10
20
30
40
50
60
Hole 1216A
Hole 1216B
1H 1H
2H
3H
4H
5H 6H 7H 8H 9H
11X
10H
TD 62.2 mbsf
TD 9.5 mbsf
Series Radiolarians
Not
zoned Barren
RP13
RP11
RP9/10
RP12/11
Eocene
middle
Figure F5. Archive-half magnetization intensities after AF demagnetization at a peak field of 20 mT from Holes 1216A and 1216B.
Hole 1216A
Hole 1216B
Intensity (A/m)
Intensity (A/m)
Depth (mbsf)
10-4 10-3 10-2 10-1 0
10
20
30
40
0
4
8
12
SHIPBOARD SCIENTIFIC PARTY
[image:21.612.85.319.113.618.2]CHAPTER 9, SITE 1216 21
Figure F6. Comparison of uncorrected declinations to declinations corrected using the Tensor orientation
tool after partial AF demagnetization at 20 mT. The clustering of the two groups around two approximately antipodal directions reveals the effectiveness of the azimuthal correction.
Uncorrected declination (
°
)
Cores 199-1216A-3H, 4H, 5H
F
raction
.10
.08
.06
.04
.02
0 .12
0 100 200 300
.10
.08
.06
.04
.02
0 .14
.12
F
raction
Tensor corrected declination (
°
)
Figure F7. Magnetic stratigraphy at Hole 1216A. Magnetic inclinations and virtual geomagnetic pole (VGP) latitudes were obtained after partial AF demagnetization of continuous measurements at a peak field of 20 mT. Polarity column shows interpreted zones of normal (black) and reversed (white) magnetization; gray intervals indicate zones with an uncertain polarity interpretation.
Oriented
cores
40 35 30 25 20
Depth (mbsf)
15 10 5
-40 0 40 80
Inclination (
°
)
-40
-80 0 40 80
VGP latitude (
°
)
S
HI
PBO
ARD
S
CI
EN
T
IF
IC
P
ART
Y
C
HA
P
T
E
R
9,
S
IT
E
12
16
[image:23.612.50.621.142.556.2]23
Figure F8. MST data plotted vs. depth for Holes 1216A and 1216B. Gamma ray attenuation (GRA) bulk density, MS, color reflectance, P-wave
velocity, and natural gamma total count data are shown for Holes 1216A (left curve in each panel) and 1216B (right curve in each panel). The data from Hole 1216B are offset by a constant for illustration purposes. Intervals with obvious flow-in or drilling disturbance were removed from the data sets (see Table T4, p. 37). cps = counts per second.
1.2 1.4 1.6
Depth (mbsf)
0 20 40
20 30 40 50 1450 1550
0 100 200
GRA bulk density
(g/cm
3)
Magnetic
susceptibility
(10
-6SI)
Color reflectance
(L*)
P-wave velocity
(m/s)
NGR
(cps)
0
10
20
30
Figure F9. Plot of gamma ray attenuation (GRA) bulk density, MS, and natural gamma count (NGR) data from Hole 1216A, matched to the spliced data from Site 1215. Horizontal lines = tie points (annotated with their corresponding depth intervals). Note that on this correlation, relative stretching and squeezing of the records from both sites was allowed. The bottom panel shows the variation in apparent sedimentation rate changes between the two sites, expressed by the slope of the mapping plot from Hole 1216A mbsf to Site 1215 mcd. cps = counts per second.
Site 1215 (mcd)
Site 1215 depth (mcd)
1216A 1215
splice splice1215 1216A 1216A splice1215
Hole 1216A (mbsf)
0 5 10 15 20 25 30
Mapping from Hole 1216A to Site 1215
Site 1215 (mcd)Site 1216A (mbsf)
2.86
6.22
10.90
22.24
25.68
28.32
10.08
16.44
22.88
32.88
35.06
37.48
Magnetic susceptibility
(10-6 SI) NGR(cps) Tie points
GRA bulk density (g/cm3)
0
5
10
15
20
25
30
0 100 200 0 10 20 30 40
1.1 1.2 1.3 1.4 1.5 1.6
10
15
20
25
30
35
SHIPBOARD SCIENTIFIC PARTY
[image:25.612.85.492.141.517.2]CHAPTER 9, SITE 1216 25
Figure F10. Plot of biostratigraphic and paleomagnetic datum levels (see Tables T5, p. 38, and T6, p. 39)
vs. mbsf. Individual symbols represent different types of stratigraphic datums: solid triangle = radiolarians, solid diamond = paleomagnetic reversal. Solid line segments = linear regressions of selected data points with the slope of these lines indicating sedimentation rates in m/m.y. as shown next to each segment. MARs are shown as values in mg/cm2/k.y.
0
10
20
30
40
50
60
0 10 20 30 40 50
Depth (mbsf)
Age (Ma)
Radiolarians
Paleomagnetic reversal
1.14 m/m.y.
9.54 m/m.y. 0.7 m/m.y.
10.0 m/m.y. 480 mg/cm2/k.y.
550 mg/cm2/k.y.
40 mg/cm2/k.y.
25 mg/cm2/k.y.
20 mg/cm2/k.y.
Figure F11. Interstitial water geochemical data from Site 1216. Solid circles = Ca, crosses = Mg.
550 560 570
0
10
20
30
40
Cl (mM)
Depth (mbsf)
2 2.5 3
Alkalinity (mM)
27 28 29
SO4 (mM)
0 5 10
NH4 (µM)
0 400 800
H4SiO4 (µM)
0 30 60
Ca and Mg (mM)
11 12 13
0
10
20
30
40
K (mM)
Depth (mbsf)
0 0.25 0.5
Ba (µM)
0 2.5 5
Mn (µM)
400 600 800
B (µM)
25 37.5 50
Li (µM)
80 85 90
SHIPBOARD SCIENTIFIC PARTY
[image:27.612.85.527.86.491.2]CHAPTER 9, SITE 1216 27
Figure F12. Bulk-sediment geochemical data from Site 1216.
0 10 20 30
0
20
40
60
Si (wt%)
Depth (mbsf)
0 4 8
Al (wt%)
0 2 4
0
20
40
60
Ca (wt%)
Depth (mbsf)
0 2 4
Mg (wt%)
0 1 2
P (wt%)
0 1000
Sr (ppm)
0 4000
Ba (ppm)
0 0.2 0.4 0.6
Ti (wt%)
0 10 20 30 0 2 4
Figure F13. Moisture and density measurements at Site 1216. A. Porosity (squares) and water content (cir-cles) for Holes 1216A (closed symbols) and 1216B (open symbols). B. Discrete-sample wet bulk density Holes 1216A (open circles) and 1216B (open squares) and gamma ray attenuation (GRA) bulk density, Holes 1216A (solid line) and 1216B (dashed line). C. Grain density for Holes 1216A (closed symbols) and 1216B (open symbols). Lithologic Subunits IA and IB are noted on the right side of the figure.
0
10
20
30
40
50
60
50 70 90
Depth (mbsf)
Porosity
(%)
A
Water content
(%)
1.0 1.2 1.4 1.6 1.8
Wet bulk density
(g/cm
3)
B
GRA bulk density
(g/cm
3)
2.0 2.4 2.8
Grain density
(g/cm
3)
C
IA
IB
Lithologic
unit/sub
SHIPBOARD SCIENTIFIC PARTY
[image:29.612.86.338.102.620.2]CHAPTER 9, SITE 1216 29
Figure F14. (A) Wet and (B) dry bulk density from discrete samples plotted with gamma ray attenuation
(GRA) bulk density interpolated with a 20-cm-wide Gaussian window.
1.0 1.2 1.4
1.0 1.2 1.4
y = 0.059 + 1.002x R = 0.92
W
et b
ulk density (g/cm
3
)
A
0.3 0.5 0.7
1.0 1.2 1.4
y = -1.248 + 1.395x R = 0.91
Dr
y b
ulk density (g/cm
3
)
Interpolated GRA density (g/cm
3)
Figure F15. LAS mineralogy determinations for Hole 1216A. Lithologic Subunits IA and IB and relative ages are noted to the right of the figure.
IA
Holocene to Eocene
IB
Eocene
Depth (mbsf)
Age
Lithologic
unit/sub
unit
0 25 50 75 100 0 25 50 75 100 0 25 50 75 100 0 25 50 75 100
0
10
20
30
40
50
60
Calcite
(model wt%)
Opal/Silica
(model wt%)
Smectite
(model wt%)
SHIPBOARD SCIENTIFIC PARTY
[image:31.612.86.276.131.658.2]CHAPTER 9, SITE 1216 31
Figure F16. Compressional wave velocity from the PWL (solid line = Hole 1216A, dashed line = 1216B) and
transverse velocity measurements of the insertion (open symbols) and contact probe (solid symbols) sys-tems for Site 1216 (circle = Hole 1216A, square = Hole 1216B). Lithologic Subunits IA and IB are noted on the right side of the figure.
0
10
20
30
40
50
60
1450 1500 1550 1600
Depth (mbsf)
Velocity
(m/s)
IA
IB
Lithologic
unit/sub
Figure F17. Natural gamma radiation for Holes 1216A (solid line) and 1216B (dashed line). Lithologic Sub-units IA and IB are noted on the right side of the figure. cps = counts per second.
0
10
20
30
40
50
60
0 20 40
Depth (mbsf)
Natural gamma
(cps)
IA
IB
Lithologic
unit/sub
SHIPBOARD SCIENTIFIC PARTY
[image:33.612.87.277.110.626.2]CHAPTER 9, SITE 1216 33
Figure F18. MS for Holes 1216A (solid line) and 1216B (dashed line). Lithologic Subunits IA and IB are
noted on the right side of the figure.
0
10
20
30
40
50
60
0 50 100 150 200
Depth (mbsf)
Magnetic susceptibility
(10
-6SI)
IA
IB
Lithologic
unit/sub
Table T1. Coring summary, Site 1216.
Note: The expanded coring summary table is available in ASCII (see the “Supplementary Material” contents list).
Hole 1216A
Latitude: 21°27.1629′N Longitude: 139°28.7904′W
Time on site (hr): 42.25 (2130 hr, 5 Nov–1545 hr, 7 Nov 2001) Time on hole (hr): 31 (2130 hr, 5 Nov–0430 hr, 7 Nov 2001) Seafloor (drill pipe measurement from rig floor, mbrf): 5163.3 Distance between rig floor and sea level (m): 10.8 m
Water depth (drill pipe measurement from sea level, m): 5152.5 Total depth (drill pipe measurement from rig floor, mbrf): 5225.5 Total penetration (meters below seafloor, mbsf): 62.20 Total length of cored section (m): 62.2
Total core recovered (m): 56.47 Core recovery (%): 90.8 Total number of cores: 11 Total number of drilled intervals: 0
Hole 1216B
Latitude: 21°27.1702′N Longitude: 139°28.7859′W
Time on hole (hr): 11.25 (0430 hr, 7 Nov–1545 hr, 7 Nov 2001) Seafloor (drill pipe measurement from rig floor, mbrf) 5158.0 mbrf Distance between rig floor and sea level (m): 10.8
Water depth (drill pipe measurement from sea level, m): 5147.2 Total depth (drill pipe measurement from rig floor, mbrf): 5167.5 Total length of cored section (m): 9.5
Total length of cored section: 9.5 m Total core recovered (m): 9.75 Core recovery (%): 102.6 Total number of cores: 1 Total number of drilled intervals: 0
Core Date (Nov 2001)
Local time
(hr)
Depth (mbsf) Length (m) Recovery (%) Top Bottom Cored Recovered
199-1216A-1H 6 1440 0.0 9.2 9.2 9.19 99.9 2H 6 1535 9.2 18.7 9.5 9.95 104.7 3H 6 1640 18.7 28.2 9.5 9.40 98.9 4H 6 1745 28.2 37.7 9.5 10.04 105.7 5H 6 1845 37.7 39.7 2.0 1.97 98.5 6H 6 2000 39.7 43.7 4.0 4.06 101.5 7H 6 2115 43.7 46.2 2.5 2.44 97.6 8H 6 2245 46.2 49.8 3.6 3.52 97.8 9H 7 0025 49.8 53.3 3.5 3.47 99.1 10H 7 0200 53.3 54.3 1.0 1.07 107.0 11X 7 0345 54.3 62.2 7.9 1.36 17.2 Cored totals: 62.2 56.47 90.8
S HI PBO ARD S CI EN T IF IC P ART Y C HA P T E R 9, S IT E 12 16 35
Table T2. Distribution of radiolarians, Hole 1216A.
Notes: Preservation: M = moderate, P = poor. Abundance: F = few, R = rare, T = trace, X = present, B = barren. Core, section,
interval (cm)
Depth (mbsf) Pres
erv a ti o n Grou p ab und a nce Zone/ Subzone Am ph ic ras p ed um m u rr a yanu m Bur yella c lina ta C a lo cycl a s h isp id a C a lo cycl o m a ca st u m Dic ty o pro ra m o ngo lfie ri Eus yring ium fi st uliger um Eus yring ium la gena La mp to n iu m f a ba ef o rme ch a u n o th o ra x La mp to n iu m f a ba ef o rme co n st ri ct u m La mp to n iu m f a ba ef o rme fa ba ef o rme La m p to niu m s a nfil ippoa e Li tho ch ytr is ve sp er tilio Li tho cyc lia ar is tot elis Li tho cyc lia oc ellu s gp . Lo p h o cyr ti s ja cc h ia Lych n o ca n o ma bel lu m Pho rmoc yrt is s tria ta ex q u is ita Pho rm o cy rt is st ria ta st ria ta Pod oc yrtis ( Lam pt erium ) a ca lles Pod oc yrtis ( Lam pt erium ) fa sc iol a ta Pod oc yrtis ( Lam pt erium ) hel enae Pod oc yrtis ( Lam pt erium ) m it ra Pod oc yrtis ( Lam pt erium ) s inu os a Pod oc yrtis ( Lam pt er ium ) t rac ho de s Pod oc yrtis ( Pod oc yrti s) pa palis Pod oc yrtis ( Pod oc yrto ges ) a m pla Pod oc yrtis ( Pod oc yrto ges ) d iam es a Pod oc yrtis ( Pod oc yrto ges ) d o ru s Pod oc yrtis ( Pod oc yrto ges ) p h yxis S p o n g a tr ac tu s b a lb is S p o n g a tr ac tu s p a ch ys ty lu s T h eo co ty le co n ica Th eo co ty le cr ypt o ceph a la Theo co tyle n igrin iae Theo co tyle ven ez u elens is Theo co tylis sa fic u s Th yr so cy rt is ( P en ta la cor ys ) t en sa T h yr so cy rt is (P en ta lo co ry s) t ri a ca nt h a T h yr so cy rt is (T h yrs oc yr ti s) h ir su ta T h yr so cy rt is (T h yrs oc yr ti s) r h iz od o n T h yr so cy rt is (T h yrs oc yr ti s) r o b u st a
199-1216A-5H-CC, 12–17 39.62 B
6H-1, 40–42 40.10 M R RP13 X ? X X X X X X X X X
6H-3, 104–106 43.74 M F RP13 X X X X X X X X X X X X X X X X
7H-1, 47–49 44.17 P T RP12/11 X X X
7H-2, 47–49 45.67 P T RP11 X X X X X
7H-CC, 0–10 46.04 P R RP11 X X X
8H-1, 45–47 46.65 P R RP11 X X X X X X X X
8H-2, 45–47 48.15 P R RP11 X X X X X X X X X ? X
8H-3, 45–47 49.25 P R RP11 X X X X X
8H-CC, 17–22 49.67 P R RP11 X X X X X X X X X X X
9H-3, 40–42 52.74 R T RP11 ? ? X X X X X ?
9H-CC, 10–20 53.17 P R RP11 X X X X X X X X X X X X
10H-CC, 9–11 54.35 B RP11
Table T3. Distribution of agglutinated benthic foraminifers, Site 1216.
Notes: Preservation: M = moderate, P = poor. Abundance: A = abundant, C = common, F = few, R = rare, T = trace, B = barren. Bathymetry: LA = lower abyssal.
Core, section, interval (cm)
Depth (mbsf) Pres
erv a ti o n Grou p ab und a nce Bath y m e tr y A mmo d isc u s sp . Bat h ys iph o n sp p . Tr oc ha <