JOURNAL OF FOREST SCIENCE, "&, 2002 (3): 100114
Mixed spruce, fir and beech stands are an important forest type of mixed forest complex in higher locations in the Alps and Carpathian Mountains. In Slovakia, the mentioned stands take up the area of one-fourth of the total forest area, i.e. more than 461,000 hectares mainly from the 4th to 6th altitudinal forest zone (HLADÍK 1996). Although a greater attention was paid to mountain for-ests in the last decades, their health condition (damage), natural and artificial regeneration and/or restoration were investigated (VACEK et al. 2000; JURÁSEK 2001; KORPE¼
1996; VACEK 2001; BALCAR 2001; GUBKA 2001). A few
papers also dealt with problems related to the silviculture
of mountain forests (OTT et al. 1995; SLODIÈÁK 2001)
whilst the majority of papers emphasized their tending. Most papers were focused on pure spruce stands but considerably less findings were published about the man-agement of mixed spruce, fir and beech stands and/or long-term effects of tending on their structure,
produc-tion and stability (ASSMANN 1961; MOLOTKOV 1966;
HOCKENJOS 1968; LEIBUNDGUT et al. 1971; TEFANÈÍK
L. 1977a, 1990; PAUMER 1978; HLADÍK 1992; TEFANÈÍK
I. 1999; TEFANÈÍK I., TEFANÈÍK L. 1998, 2001). In Slovakia, research on the tending of mixed spruce, fir and beech stands started at the end of the sixties of the last century. For this reason four permanent research plots (17 partial plots) were established in the 5th and 6th altitu-dinal forest zone, situated in natural areas of mixed spruce, fir and beech forests in Slovakia in the Ve¾ká Fatra Moun-tains and the Low Tatra MounMoun-tains. The first research re-sults of the mentioned problems were published in 1977 (TEFANÈÍK L. 1977a). Permanent research plot (PRP) Ko-rytnica was established as the first object of our research
and the experimental material of this paper was collected in this PRP. This paper is a follow-up of the first two biometric measurements carried out in this plot, and published in the past (TEFANÈÍK L. 1977a,b).
The aim of this study was to find and assess the chang-es in tree specichang-es composition, stand structure, and in qualitative and quantitative production of mixed spruce, fir and beech stand on Korytnica PRP in a 30-year period of its tending.
MATERIAL AND METHODS
The mixed spruce, fir and beech stand at the growth stage of pole-stage stand up to thin high forest on perma-nent research plot (PRP) Korytnica was chosen as an object of our research. This PRP is located inside the zone of Forest District Liptovská Osada, Branch Forest Enter-prise Liptovský Hrádok, and it was established in 1967 for research on the silviculture-production relations in mixed spruce, fir and beech stands. The series PRP Ko-rytnica consists of five partial plots (PP) three with an area of 0.08, 0.10 and 0.12 ha (designated as H), where
free crown thinning is applied (TEFANÈÍK L. 1984). The
other two plots are without any treatment control plots (designated as O) with an area of 0.08 and 0.10 ha. The plots are isolated from each other and from another stand by 10 m wide tree belt. Before the research plots were established in the investigated stand, thinnings were car-ried out only rarely, in case they were realized their in-tensity was very low, focused on removal of thin and/or dying out individuals. A more detailed characteristic of research plots is presented in Table 1.
Assessment of long-term tending in mixed stands of spruce, fir
and beech on research plot Korytnica
I. TEFANÈÍK, L. TEFANÈÍK
Forest Research Institute, Zvolen, Slovak Republic
ABSTRACT: The paper deals with problems of thinnings in a mixed stand (spruce-fir-beech) situated in the sixth altitu-dinal forest zone. Three of the five investigated plots were tended by free crown thinning for a long time, and two were left without any planned silvicultural treatments as control. Dynamic changes in tree species composition, stand structure, qualitative and quantitative production were evaluated for a period of 30 years. The changes were compared with respect to differences between the plot with long-term silvicultural treatments and the control plots (without treatments).
The trees on all plots are numbered and measurement points at a breast height 1.3 m are marked out. The com-plex biometric measurements are carried out at 5-year intervals in accordance with standard methods that were developed for long-term research on
silviculture-produc-tion problems of thinnings (TEFANÈÍK L. 1977a) on all
plots. Within their framework, besides the quantitative parameters (breast height diameter, tree height, crown size at horizontal projection), the trees were also evalu-ated according to the silvicultural and commercial
clas-sification with orientation to the trees of selective quality that are the main bearers of quality. Since the establish-ment of PRP, seven biometric measureestablish-ments have been carried out and simultaneously thinnings have always been performed. From a rationalisation point of view, the method of promising trees and later crop trees (TE
[image:2.595.56.529.74.314.2]-FANÈÍK L. 1984), which is focused on individual tending of the trees of selective quality, was applied on the tend-ed plot (H). Before the research starttend-ed, a model of tree species composition and production target according to Table 1. Basic characteristics of permanent research plot (PRP) Korytnica I, II, III
Characteristic TVP Korytnica I, II, III
Establishment of PRP (year) 1967
Age of stand (years) spruce 58, fir 50, beech 50 Geomorphologic unit Low Tatra Mts. (west part)
Exposition NE
Altitude (m) 930970
Inclination (degree) 3035
Parent rock Triassic Schist
Soil unit Cambisol/Umbric Leptosol
Altitudinal forest zone 6th spruce-beech-fir
Ecological rank B/C
Management complex 65
Management complex of forest types 611 fertile beech-fir sprucewoods Forest type group Fageto-Aceretum(FAc) v. st. Forest type 6402 fern-beech maplewoods v. st. Average annual temperature (°C) 4.2
Average annual precipitation sum (mm/year) 1,200
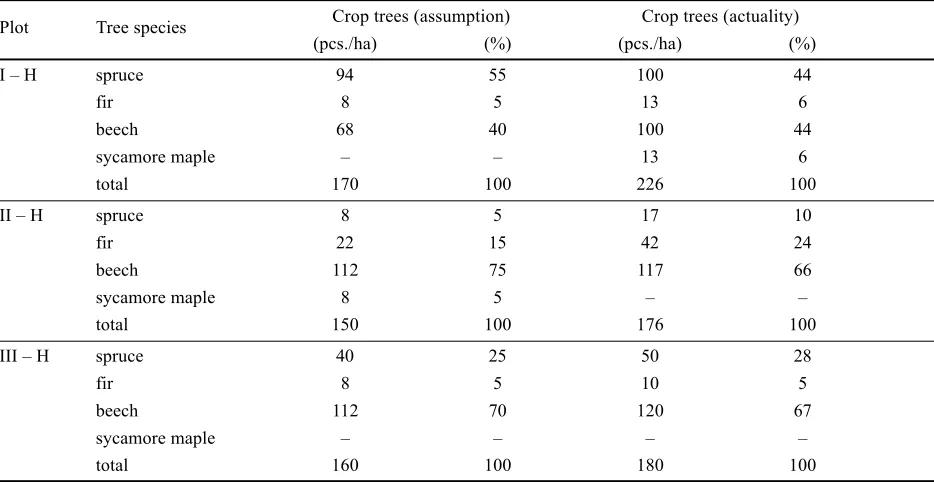
Table 2. The model of assumed and actual number of crop trees in mixed spruce, fir and beech stand on the PRP Korytnica I, II, III
Plot Tree species Crop trees (assumption) Crop trees (actuality)
(pcs./ha) (%) (pcs./ha) (%)
I H spruce 9455 100 44
fir 8 5 13 6
beech 68 40 100 44
sycamore maple 13 6
total 170 100 226 100
II H spruce 8 5 17 10
fir 22 15 42 24
beech 112 75 117 66
sycamore maple 8 5
total 150 100 176 100
III H spruce 40 25 50 28
fir 8 5 10 5
beech 112 70 120 67
sycamore maple
[image:2.595.57.524.513.754.2]TEFANÈÍK L. (1977b) was developed that assumed the number and tree species composition of crop trees (Ta-ble 2). For information integrity we suggest that for all mixed spruce, fir and beech stands a general model of tree species composition and production target was
de-veloped by TEFANÈÍK L. (1990) that was already
pub-lished within the framework of assessment of our 30-year results on Hrable PRP (TEFANÈÍK I., TEFANÈÍK L. 2001).
The experimental material was processed by common biometric and statistical methods according to presented standard methods for research on thinnings. In this paper we assessed the first measurement carried out at the time of PRP establishment in 1968 (at stand age of 5058 years) and the last measurement in 1998 (at stand age of 8088 years) in order to compare dynamic changes in investi-gated parameters on Korytnica PRP for the period of 30 years.
RESULTS AND DISCUSSION
Owing to the fact that we have collected a lot of results during the investigated period of 30 years, as well as due to the limited extent of this paper, only the most impor-tant data are presented. Some of them are presented in tables or in figures, the others are commented only ver-bally.
TREE SPECIES COMPOSITION
Percentage proportions of tree species according to the basal area (G) on Korytnica PRP are presented in Fig. 1.
In the initial stage of our research the proportion of conif-erous trees on the tended plots H was from 29% to 58% while on control plot O 50% and 33%, respectively. Ac-cording to the tree species the highest proportion was found for beech (3761%), followed by fir (1330%), spruce (628%) and sycamore maple (311%). After 30 years, the proportion of coniferous trees on the tend-ed plots rangtend-ed from 27% to 48% while on control plots 47% and 29%, respectively. Within the framework of in-dividual tree species an increase in spruce (by 411%) and also beech (by 311%) proportion was registered on the tended plots. On the other hand, a decrease in fir pro-portion by 522% was found. On control plots there was an increase in spruce proportion by 5% and/or 4% and in the proportion of beech by 2% and 3%. The highest changes in the investigated period of 30 years were reg-istered for fir (decrease by 89%) in favour of the other tree species (spruce, beech, sycamore maple). Compari-son of the tree species composition with developmental
goals according to HANÈINSKÝ (1972) showed that all
plots slightly differed from the required composition, especially by a higher share of beech to the detriment of spruce and on some plots also of fir and valuable broad-leaved trees (sycamore maple, Scotch elm).
The above-mentioned development of tree species composition can be explained by the fact that growth conditions in this PRP (6th altitudinal forest zone, alti-tude 930970 m a.s.l., etc.) are suitable for beech and are getting to optimal for spruce. As for a decrease in fir pro-portion, it was influenced by the fact that the mentioned stands were neglected from a silvicultural point of view at young and middle age, which resulted in crown
reduc-0 10 20 30 40 50 60 70
Year
Percentage
spruce fir beech syc.mapl e other sp.
1968199819681998196819981968199819681998
I H I O II H III H III O
Spruce Fir
Beech
[image:3.595.76.547.475.730.2]Syc. maple Other sp.
Fig. 1. Percentage proportions of tree species according to the basal area (G) on the PRP Korytnica I, II, III 70
60
50
40
30
20
10
0
1968 1998 1968 1998 1968 1998 1968 1998 1968 1998
Percentage
tion and/or reduction of assimilatory organs (TEFANÈÍK
L. 1977b). Well-known is also the fact that fir suffers very much due to tending treatments at later age, espe-cially after previous silvicultural treatment was
neglect-ed, which brings about its increased mortality (KORPE¼,
VIN 1965). Changes found out in the tree species
com-position and in their decrease confirmed the known over-all decline of fir in forest stands during the last decades
(MÁLEK 1983) when its original proportion in the
Slo-vak forests decreased from former 14.1% to 4.5% at
present (HLADÍK 1996; VLADOVIÈ et al. 1998).
Our results related to fir decline in mixed stands also
correspond with those published by KANTOR and PAØÍK
(1998), who assessed changes in the tree species com-position during a 35-year period of investigation in a 65-year mixed spruce, fir, pine, larch and beech stand that was not tended. The authors determined a consider-able decrease in the fir proportion for 20 years from 28% to 17%. On the contrary, an increased proportion for beech and spruce by 5% and 9%, respectively, was found.
STAND STRUCTURE
Stand structure was described by relative frequency according to the growth (tree) classes. We calculated the proportion of trees at a crown level of the stand (1st + 2nd growth class) and suppressed level of the stand (3rd to 5th growth class), which is important from the silvicultu-ral point of view. The results showed that in the initial stage the proportion of spruce at a crown level of the stand on all plots ranged from 21% to 56%, fir 1330%, beech 1950% and sycamore maple 452%. After the 30-year period the proportion of spruce at a crown level of the stand on tended plots ranged from 33% to 89%, fir 1436%, beech 3247% and sycamore maple 2550%. On two control plots the proportion of spruce at a crown level of the stand was 46% and 75%, fir 50% and 60%, beech 32% and 48%, sycamore maple 40% and 45%.
Although the stand structure (classification according to the growth classes) depends on site, tree species, age and tending measures (EBÍK, POLÁK 1990), these results suggest a slight increase in the proportion of the crown level of the stand within the framework of stand structure for all tree species during the period of 30 years. Similar development was also found on other PRP that were
in-vestigated in mixed spruce, fir and beech stands (TE
-FANÈÍK I., TEFANÈÍK L. 1998). It was confirmed that the intensity of shifts within the framework of the relative height position of trees decreases in relation to age, it means that a lower number of trees shifts into lower growth classes (TEFANÈÍK L. 1974; EBÍK, POLÁK 1990).
DEVELOPMENT OF QUALITATIVE PRODUCTION BY THE METHOD OF CROP TREES
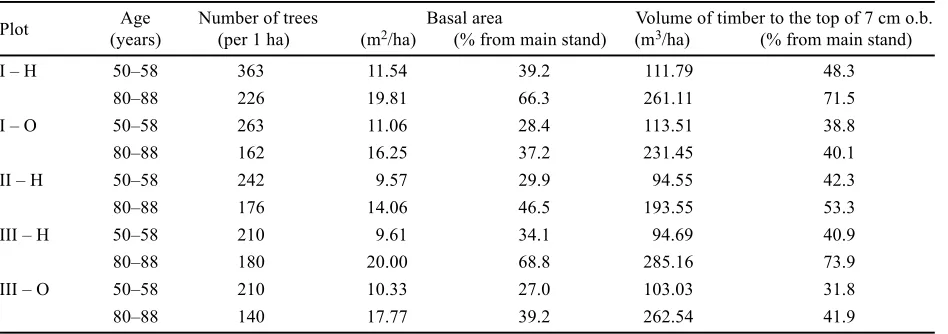
Table 3 presents the development of crop trees, the main bearers of stand quality and quantity. It can be seen that the number of promising trees (future crop trees) ranged from 210 individuals per hectare to 363 individu-als per hectare, with the share of growing stock 3248%. After the 30-year period the number of crop trees de-creased, so their number ranged from 176 individuals per hectare to 226 individuals per hectare on tended plots, while 162 individuals per hectare and 140 individuals per hectare on control plots. The proportion of crop trees in growing stock was from 53% to 74% on tended plots while only 40% and 42% on control plots. As for the tree species composition of crop trees, the proportion of beech was 50% and the remaining 50% included spruce and fir, rarely sycamore maple.
[image:4.595.57.531.572.739.2]Very interesting results were found by a comparison of the actual number of crop trees with that of the expected ones (Table 2). It is clear that the number of crop trees determined before the research started was slightly high-er in comparison with the model afthigh-er the 30-year phigh-eriod of tending. The differences were minimal also according to the percentage share of tree species. It can be assumed
Table 3. Development of crop trees
Plot (years) (per 1 ha) (mAge Number of trees 2/ha) (% from main stand) (mBasal area Volume of timber to the top of 7 cm o.b.3/ha) (% from main stand)
I H 5058 363 11.5439.2 111.79 48.3
8088 226 19.81 66.3 261.11 71.5
I O 5058 263 11.06 28.4113.51 38.8
8088 162 16.25 37.2 231.45 40.1
II H 5058 242 9.57 29.9 94.55 42.3
8088 176 14.06 46.5 193.55 53.3
III H 5058 210 9.61 34.1 94.69 40.9
8088 180 20.00 68.8 285.16 73.9
III O 5058 210 10.33 27.0 103.03 31.8
8088 140 17.77 39.2 262.54 41.9
that within the rotation the number of crop trees will be in accordance with the model. It is to note that the model developed for Korytnica PRP contains a lower number of trees in comparison with the general model developed for spruce, fir and beech stands (TEFANÈÍK I., TE
-FANÈÍK L. 2001), which was a consequence of the lack of silvicultural treatment on PRP during the period be-fore our research started. In the case of both early and systematic tending a higher number of crop trees could be achieved in accordance with the mentioned model. The same development was found on Korytnica PRP as in the mixed spruce, fir and beech stand on Hrable PRP with similar natural conditions (TEFANÈÍK I., TE
-FANÈÍK L. 2001), so that on some plots and/or for some tree species the assumed diameter of crop trees was al-ready achieved at the age 8090 years.
It can be concluded that contrary to delayed tending (at the age of 50 years) the results were always more favourable in comparison with the plot without treatment. Of course, neither quantitative nor qualitative losses could be compensated because of neglected tending. This fact was confirmed by our results from other mixed spruce, fir and beech PRP (Motyèky, Hrable) (TE
-FANÈÍK L. 1990; TEFANÈÍK I., TEFANÈÍK L. 2001).
DEVELOPMENT OF QUANTITATIVE PRODUCTION
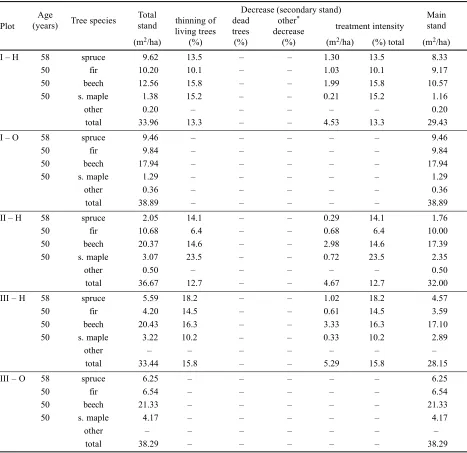
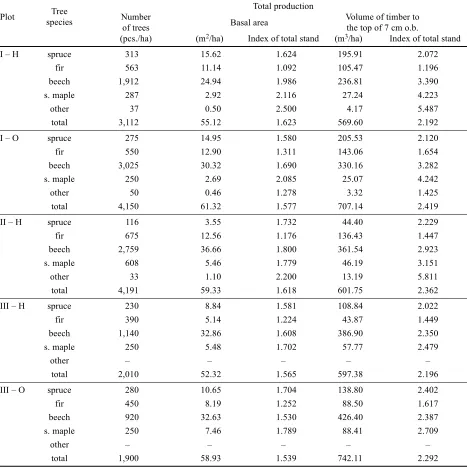
Tables 4 and 5 show the basal area of the whole stand and main stand at the first biometric measurement in 1968 as well as at the last one carried out in 1998. On tended plots H totally for all tree species 13.519.7% of N
(num-Table 4. Development of the basal area and its decrease on the plots in 1968
Decrease (secondary stand)
Plot (years)Age Tree species Totalstand thinning ofliving trees deadtrees decreaseother* treatment intensity Mainstand (m2/ha) (%) (%) (%) (m2/ha) (%) total (m2/ha)
I H 58 spruce 9.62 13.5 1.30 13.5 8.33
50 fir 10.20 10.1 1.03 10.1 9.17
50 beech 12.56 15.8 1.99 15.8 10.57
50 s. maple 1.38 15.2 0.21 15.2 1.16
other 0.20 0.20
total 33.96 13.3 4.53 13.3 29.43
I O 58 spruce 9.46 9.46
50 fir 9.84 9.84
50 beech 17.94 17.94
50 s. maple 1.29 1.29
other 0.36 0.36
total 38.89 38.89
II H 58 spruce 2.05 14.1 0.29 14.1 1.76
50 fir 10.68 6.4 0.68 6.4 10.00
50 beech 20.37 14.6 2.98 14.6 17.39
50 s. maple 3.07 23.5 0.72 23.5 2.35
other 0.50 0.50
total 36.67 12.7 4.67 12.7 32.00
III H 58 spruce 5.59 18.2 1.02 18.2 4.57
50 fir 4.20 14.5 0.61 14.5 3.59
50 beech 20.43 16.3 3.33 16.3 17.10
50 s. maple 3.22 10.2 0.33 10.2 2.89
other
total 33.44 15.8 5.29 15.8 28.15
III O 58 spruce 6.25 6.25
50 fir 6.54 6.54
50 beech 21.33 21.33
50 s. maple 4.17 4.17
other
total 38.29 38.29
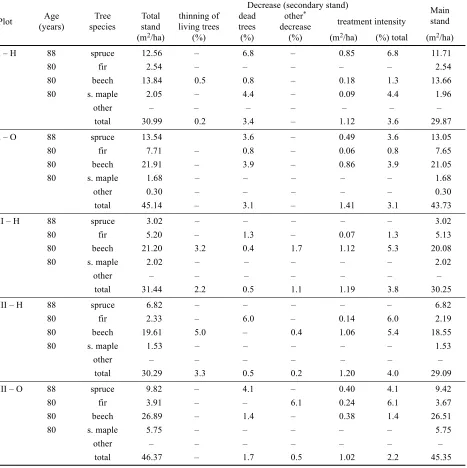
[image:5.595.71.538.286.739.2]ber of trees), 12.715.8% of G (basal area) and 11.015.0% of the volume of timber to the top of 7 cm o.b. (V7b) was removed by the first thinning. Within the framework of the tree species, removal due to thinnings was highest in beech in accordance with its highest proportion on all plots. After 30-year tending 1.51.7% according to N, 0.2
3.3% according to G and 0.13.5% according to V7b was
removed by the 7th thinning.
Similar results were also found on other plots in mixed stands (Motyèky, Hrable) where the intensity of the first treatment (thinning of living trees) according to V7b ranged from 10.216.2% on Motyèky PRP and 24.9%
the Hrable PRP (TEFANÈÍK I., TEFANÈÍK L. 2001).
Our results also correspond with the recommendations by MOLOTKOV (1966), who reported the thinning
inten-sity of 1530% of the growing stock and for later thin-nings 1020% for spruce, fir and beech stands of the Carpathian region in Ukraine.
A reduction in the category another decrease (breaks of stems, windthrows) during 30 years of investigation as-sumed negligible values and ranged from 0 to 1.3%. An
exception was found only for the 6th biometric
measure-ment (1993) when the forest managers mistakenly carried out the treatment on all plots with intensity 4.58.1% on tended plots and 9.1% and 7.8% on control plots.
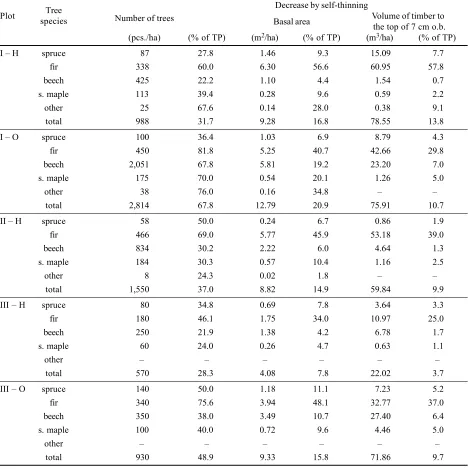
The highest decrease in N by self-thinning (Table 6)
was found on control plots amounting to 67.8% and 48.9% of total production while on tended plots it was 28.337.0%. According to the tree species by an abso-lute expression of the number of trees, the following or-Table 5. Development of the basal area and its decrease on the plots in 1998
Decrease (secondary stand)
Plot (years)Age speciesTree standTotal living treesthinning of treesdead decreaseother* treatment intensity Mainstand (m2/ha) (%) (%) (%) (m2/ha) (%) total (m2/ha)
I H 88 spruce 12.56 6.8 0.85 6.8 11.71
80 fir 2.54 2.54
80 beech 13.840.5 0.8 0.18 1.3 13.66
80 s. maple 2.05 4.4 0.09 4.41.96
other
total 30.99 0.2 3.4 1.12 3.6 29.87
I O 88 spruce 13.543.6 0.49 3.6 13.05
80 fir 7.71 0.8 0.06 0.8 7.65
80 beech 21.91 3.9 0.86 3.9 21.05
80 s. maple 1.68 1.68 other 0.30 0.30
total 45.14 3.1 1.41 3.1 43.73
II H 88 spruce 3.02 3.02
80 fir 5.20 1.3 0.07 1.3 5.13
80 beech 21.20 3.2 0.41.7 1.12 5.3 20.08
80 s. maple 2.02 2.02 other
total 31.44 2.2 0.5 1.1 1.19 3.8 30.25
III H 88 spruce 6.82 6.82
80 fir 2.33 6.0 0.146.0 2.19
80 beech 19.61 5.0 0.41.06 5.418.55
80 s. maple 1.53 1.53 other
total 30.29 3.3 0.5 0.2 1.20 4.0 29.09
III O 88 spruce 9.82 4.1 0.40 4.1 9.42
80 fir 3.91 6.1 0.246.1 3.67
80 beech 26.89 1.4 0.38 1.426.51
80 s. maple 5.75 5.75
other
total 46.37 1.7 0.5 1.02 2.2 45.35
[image:6.595.59.526.77.545.2]der was found: beech, fir, sycamore maple, spruce, others. According to the percentage of total production the high-est decrease was unambiguously registered for fir on all plots but differences between the other tree species were low, so that their order changed from plot to plot. This fact could be explained by the same words presented in the part of this paper related to tree species composition on Korytnica PRP. Moreover, it can be stated that especially during the first thinnings there were cases of fir decline at a crown level of the stand. It applied to intensively released fir individuals with smaller crown size. Due to an acute crown release at old age, their crown was not regenerated but dried up (TEFANÈÍK L. 1977b). The sensitivity of fir trees
to more intensive and more acute release at older age was also reported by KORPE¼, VIN (1965).
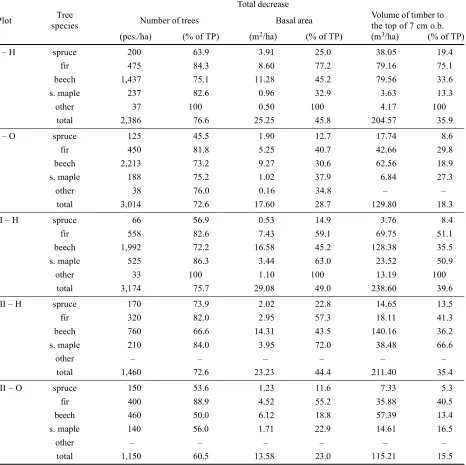
A total decrease (Table 7) over 30 years according to G on tended plots amounted to 44% and 49% of total pro-duction while it was 23% and 29% on control plots. A
total decrease according to V7b on tended plots was 35
40%, and 15% and 18% on control plots.
[image:7.595.71.540.77.546.2]Total production (Table 8) during 30 years of investiga-tion on tended plots ranged from 2,010 to 4,191 individu-als per hectare, 52.32 m2/ha to 59.33 m2/ha (according to G) and 569.6 m3/ha to 601.75 m3/ha. The values on control plots were as follows: 4,150 and 1,900 individuals per hect-are, 61.32 m2/ha and 58.93 m2/ha, 707.14 m3/ha and Table 6. The decrease of trees by self-thinning for 30 years
Decrease by self-thinning
Plot speciesTree Number of trees Basal area Volume of timber to the top of 7 cm o.b. (pcs./ha) (% of TP) (m2/ha) (% of TP) (m3/ha) (% of TP)
I H spruce 87 27.8 1.46 9.3 15.09 7.7
fir 338 60.0 6.30 56.6 60.95 57.8
beech 425 22.2 1.10 4.4 1.54 0.7
s. maple 113 39.40.28 9.6 0.59 2.2
other 25 67.6 0.1428.0 0.38 9.1
total 988 31.7 9.28 16.8 78.55 13.8
I O spruce 100 36.41.03 6.9 8.79 4.3
fir 450 81.8 5.25 40.7 42.66 29.8
beech 2,051 67.8 5.81 19.2 23.20 7.0
s. maple 175 70.0 0.5420.1 1.26 5.0
other 38 76.0 0.16 34.8
total 2,81467.8 12.79 20.9 75.91 10.7
II H spruce 58 50.0 0.246.7 0.86 1.9
fir 466 69.0 5.77 45.9 53.18 39.0
beech 834 30.2 2.22 6.0 4.64 1.3
s. maple 18430.3 0.57 10.41.16 2.5
other 8 24.3 0.02 1.8
total 1,550 37.0 8.82 14.9 59.84 9.9
III H spruce 80 34.8 0.69 7.8 3.643.3
fir 180 46.1 1.75 34.0 10.97 25.0
beech 250 21.9 1.38 4.2 6.78 1.7
s. maple 60 24.0 0.26 4.7 0.63 1.1
other
total 570 28.3 4.08 7.8 22.02 3.7
III O spruce 140 50.0 1.18 11.1 7.23 5.2
fir 340 75.6 3.94 48.1 32.77 37.0
beech 350 38.0 3.49 10.7 27.40 6.4
s. maple 100 40.0 0.72 9.6 4.46 5.0
other
total 930 48.9 9.33 15.8 71.86 9.7
742.11 m3/ha. An expression of total production over 30 years within the framework of tree species brought about the following order: beech, fir, spruce, sycamore maple according to N, but according to V7b it was: beech, spruce, fir and sycamore maple apart from II H plot.
On the whole, more favourable results were determined on all tended plots in comparison with control ones. Total current annual increment according to the tree species was highest for beech and spruce and lowest for fir and sycamore maple. A comparison of total volume produc-tion showed lower values in comparison with Hrable PRP because of its age higher by 24 years. On the other hand, a comparison of total current annual increment with Ko-rytnica PRP showed somewhat higher values on this plot
for beech and spruce but lower values for fir and whole stand.
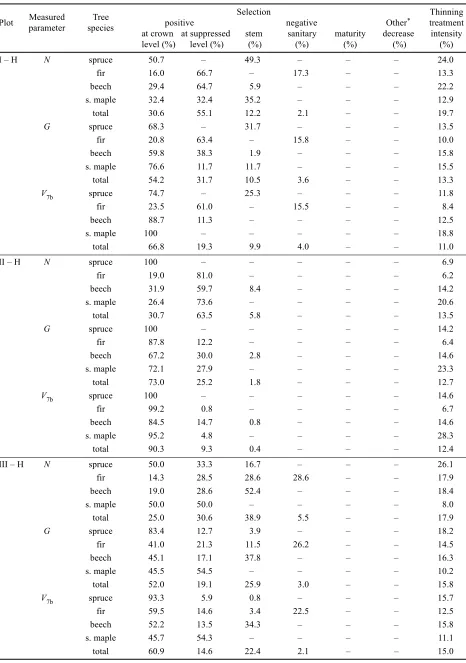
SILVICULTURAL ANALYSIS OF THINNINGS
[image:8.595.60.526.78.543.2]Tables 9 and 10 present a silvicultural analysis of free crown thinning at the first and the last treatment. The results show that by the first thinning the most intensive treatment was carried out at a crown level of the stand (5273% according to G), followed by treatment at a sup-pressed tree level (19.131.7%), negative stem selection (1.825.9%) and finally sanitary selection (3.03.6%). These values unambiguously confirmed that until the es-tablishment of research plot the stand was neglected from Table 7. The total decrease of trees for 30 years
Total decrease
Plot speciesTree Number of trees Basal area Volume of timber tothe top of 7 cm o.b. (pcs./ha) (% of TP) (m2/ha) (% of TP) (m3/ha) (% of TP)
I H spruce 200 63.9 3.91 25.0 38.05 19.4
fir 475 84.3 8.60 77.2 79.16 75.1
beech 1,437 75.1 11.28 45.2 79.56 33.6
s. maple 237 82.6 0.96 32.9 3.63 13.3
other 37 100 0.50 100 4.17 100
total 2,386 76.6 25.25 45.8 204.57 35.9
I O spruce 125 45.5 1.90 12.7 17.74 8.6
fir 450 81.8 5.25 40.7 42.66 29.8
beech 2,213 73.2 9.27 30.6 62.56 18.9
s. maple 188 75.2 1.02 37.9 6.8427.3
other 38 76.0 0.16 34.8
total 3,01472.6 17.60 28.7 129.80 18.3
II H spruce 66 56.9 0.53 14.9 3.76 8.4
fir 558 82.6 7.43 59.1 69.75 51.1
beech 1,992 72.2 16.58 45.2 128.38 35.5
s. maple 525 86.3 3.44 63.0 23.52 50.9
other 33 100 1.10 100 13.19 100
total 3,17475.7 29.08 49.0 238.60 39.6
III H spruce 170 73.9 2.02 22.8 14.65 13.5
fir 320 82.0 2.95 57.3 18.11 41.3
beech 760 66.6 14.31 43.5 140.16 36.2
s. maple 210 84.0 3.95 72.0 38.48 66.6
other
total 1,460 72.6 23.23 44.4 211.40 35.4
III O spruce 150 53.6 1.23 11.6 7.33 5.3
fir 400 88.9 4.52 55.2 35.88 40.5
beech 460 50.0 6.12 18.8 57.39 13.4
s. maple 140 56.0 1.71 22.9 14.61 16.5
other
total 1,150 60.5 13.58 23.0 115.21 15.5
Table 8. Total production of the stand for 30 years
Total production
Plot speciesTree Number Basal area Volume of timber to
of trees the top of 7 cm o.b.
(pcs./ha) (m2/ha) Index of total stand (m3/ha) Index of total stand
I H spruce 313 15.62 1.624195.91 2.072
fir 563 11.141.092 105.47 1.196
beech 1,912 24.94 1.986 236.81 3.390
s. maple 287 2.92 2.116 27.244.223
other 37 0.50 2.500 4.17 5.487
total 3,112 55.12 1.623 569.60 2.192
I O spruce 275 14.95 1.580 205.53 2.120
fir 550 12.90 1.311 143.06 1.654
beech 3,025 30.32 1.690 330.16 3.282
s. maple 250 2.69 2.085 25.07 4.242
other 50 0.46 1.278 3.32 1.425
total 4,150 61.32 1.577 707.14 2.419
II H spruce 116 3.55 1.732 44.40 2.229
fir 675 12.56 1.176 136.43 1.447
beech 2,759 36.66 1.800 361.542.923
s. maple 608 5.46 1.779 46.19 3.151
other 33 1.10 2.200 13.19 5.811
total 4,191 59.33 1.618 601.75 2.362
III H spruce 230 8.841.581 108.842.022
fir 390 5.14 1.224 43.87 1.449
beech 1,140 32.86 1.608 386.90 2.350
s. maple 250 5.48 1.702 57.77 2.479
other
total 2,010 52.32 1.565 597.38 2.196
III O spruce 280 10.65 1.704138.80 2.402
fir 450 8.19 1.252 88.50 1.617
beech 920 32.63 1.530 426.40 2.387
s. maple 250 7.46 1.789 88.41 2.709
other
total 1,900 58.93 1.539 742.11 2.292
a silvicultural point of view. Similarly, it was also found on
Hrable PRP (TEFANÈÍK I., TEFANÈÍK L. 2001) that the
crown level of the stand was most intensively tended by the first thinning (54.8%). The thinning intensity on the mentioned plot was 28.6%, which was almost twice higher in comparison with other treatments performed on this plot as well as on other PRP in mixed spruce, fir and beech
stands (TEFANÈÍK L. 1981). It was caused by the fact
that on Hrable PRP the first treatment was carried out at the age of 80 years while on Korytnica PRP at the age of 50 years. Corresponding thinning intensity of the first
treatment was 12.715.8% according to G and 11.0
15.0% according to V7b, which is in accordance with the
statement of MOLOTKOV (1966). He recommended the
thinning intensity of the first treatment performed in mixed
spruce, fir and beech stands to be
1530% of growing stock and the following ones with intensity 1020%. On Korytnica PRP the thinning inten-sity of the following treatments ranged from 2.714.5% of basal area and from 2.214.7% of growing stock.
The intensity of the 7th thinning (Table 10) was from
0.2% to 3.5%, especially due to another decrease (break of stems). These values are the same as those found on Hrable PRP, where the intensity of the 7th thinning amounted to 3.5%.
Table 9. Silvicultural analysis of the free crown thinning (felling of living trees) on treated plots H by the first thinning in 1968
Selection Thinning
Plot Measured Tree positive negative Other* treatment parameter species at crown at suppressed stem sanitary maturity decrease intensity
level (%) level (%) (%) (%) (%) (%) (%)
I H N spruce 50.7 49.3 24.0
fir 16.0 66.7 17.3 13.3
beech 29.464.7 5.9 22.2
s. maple 32.432.435.2 12.9
total 30.6 55.1 12.2 2.1 19.7
G spruce 68.3 31.7 13.5
fir 20.8 63.4 15.8 10.0
beech 59.8 38.3 1.9 15.8
s. maple 76.6 11.7 11.7 15.5
total 54.2 31.7 10.5 3.6 13.3
V7b spruce 74.7 25.3 11.8
fir 23.5 61.0 15.5 8.4
beech 88.7 11.3 12.5
s. maple 100 18.8
total 66.8 19.3 9.9 4.0 11.0
II H N spruce 100 6.9
fir 19.0 81.0 6.2
beech 31.9 59.7 8.4 14.2
s. maple 26.473.6 20.6
total 30.7 63.5 5.8 13.5
G spruce 100 14.2
fir 87.8 12.2 6.4
beech 67.2 30.0 2.8 14.6
s. maple 72.1 27.9 23.3
total 73.0 25.2 1.8 12.7
V7b spruce 100 14.6
fir 99.2 0.8 6.7
beech 84.5 14.7 0.8 14.6
s. maple 95.2 4.8 28.3
total 90.3 9.3 0.4 12.4
III H N spruce 50.0 33.3 16.7 26.1
fir 14.3 28.5 28.6 28.6 17.9
beech 19.0 28.6 52.4 18.4
s. maple 50.0 50.0 8.0
total 25.0 30.6 38.9 5.5 17.9
G spruce 83.412.7 3.9 18.2
fir 41.0 21.3 11.5 26.2 14.5
beech 45.1 17.1 37.8 16.3
s. maple 45.5 54.5 10.2
total 52.0 19.1 25.9 3.0 15.8
V7b spruce 93.3 5.9 0.8 15.7
fir 59.5 14.6 3.4 22.5 12.5
beech 52.2 13.5 34.3 15.8
s. maple 45.7 54.3 11.1
total 60.9 14.6 22.4 2.1 15.0
Explanatory notes: N number of trees per 1 ha, G basal area, V7b volume of timber to the top of 7 cm o.b. per 1 ha, * stem break or
Table 10. Silvicultural analysis of the free crown thinning (felling of living trees) on treated plots H by the seventh thinning in 1998
Selection Thinning
Plot Measured Tree positive negative Other* treatment parameter species at crown at suppressed stem sanitary maturity decrease intensity
level (%) level (%) (%) (%) (%) (%) (%)
I H N spruce
fir
beech 100 2.5
s. maple
total 100 1.5
G spruce
fir
beech 100 0.5
s. maple
total 100 0.2
V7b spruce
fir
beech 100 0.1
s. maple
total 100 0.1
II H N spruce
fir
beech 25.0 25.0 50.0 4.1
s. maple
total 25.0 25.0 50.0 3.1
G spruce
fir
beech 59.3 6.3 34.4 4.9
s. maple
total 59.3 6.3 34.4 3.3
V7b spruce
fir
beech 68.1 2.6 29.3 5.2
s. maple
total 68.1 2.6 29.3 3.4
III H N spruce
fir
beech 50.0 50.0 5.0
s. maple
total 50.0 50.0 3.3
G spruce
fir
beech 93.4 6.6 5.4
s. maple
total 93.4 6.6 3.5
V7b spruce
fir
beech 97.8 2.2 5.4
s. maple
total 97.8 2.2 3.5
carried out on Korytnica PRP (TEFANÈÍK L. 1977a,b) it was stated that the second treatment with thinning inter-val of 5 years was urgent only for beech on plots I H and III H while for other tree species it was not urgent. It is clear from our long-term results that as for the thin-ning intensity and interval, one more intensive treatment could be done (1525%) for a period of 7 to 10 years. These results are also in accordance with recommenda-tions by OTT et al. (1995), who suggested that almost all pure spruce or mixed spruce stands situated in the 6th al-titudinal forest zone with thinning intensity lower than 15% were intensively destroyed. On the contrary, stands with the intensity of treatment higher than 25% were damaged less significantly. The mentioned authors rec-ommended a thinning interval of 7 to 10 years.
CONCLUSIONS
Evaluation of 30-year changes in the tree species com-position, stand structure, qualitative and quantitative pro-duction of more than 80-year mixed spruce, fir and beech stand, located in the 6th altitudinal forest zone, at a fertile site brought about the following results:
In the initial stage, the proportion of coniferous trees on tended plots H was from 29% to 58% while on control plots O it was 50% and 33%. According to the tree species the highest proportion was found for beech (3761%), followed by fir (1330%), spruce (628%) and sycamore maple (311%). After 30 years, a de-crease in the proportion of coniferous trees was found on tended plots, the values ranged from 27% to 48% while on control plots they were 47% and 29%.
With-in the framework of With-individual tree species an With-increase in the spruce (by 411%) and also beech (by 311%) proportion was registered on tended plots. On the oth-er hand, a decrease in the fir proportion by 522% was found. On control plots there was an increase in the spruce proportion by 5% and/or 4%, and in the proportion of beech by 2% and 3%. The greatest changes in the investigated period of 30 years were registered for fir (decrease by 89%) in favour of the other tree species (spruce, beech, sycamore maple). In the initial stage the proportion of spruce at the
crown level of the stand on all plots ranged from 21% to 56%, fir 1330%, beech 1950% and sycamore maple 452%. After the 30-year period the propor-tion of spruce at the crown level of the stand on tend-ed plots rangtend-ed from 33% to 89%, fir 1436%, beech 3247% and sycamore maple 2550%. On two con-trol plots the proportion of spruce at the crown level of the stand was 46% and 75%, fir 50% and 60%, beech 32% and 48%, sycamore maple 40% and 45%. At the time of Korytnica PRP establishment, the number of promising trees (future crop trees) ranged from 210 individuals per hectare to 363 individuals per hectare, with the share of growing stock 3248%. After the 30-year period the number of crop trees de-creased, their number ranging from 176 individuals per hectare to 226 individuals per hectare on tended plots while there were 162 individuals per hectare and 140 individuals per hectare on control plots. The pro-portion of crop trees in growing stock was from 53% to 74% on tended plots, and only 40% and 42% on control plots.
0 2 4 6 8 10 12 14 16 18
Order of treatment
Percentage
1 2 3 4 5 6 7 1 2 3 4 5 6 7 1 2 3 4 5 6 7
[image:12.595.83.487.474.726.2]I H II H III H
Fig. 2. Comparison of thinning intensity (according to the basal area) during the 30-year period of investigation on treated plots in PRP Korytnica I, II, III
Order of treatment
Percentage
On tended plots H for all tree species 13.519.7% of N (number of trees), 12.715.8% of G (basal area) and 11.015.0% of the volume of timber to the top of 7 cm o.b. (V7b) was removed totally by the first thinning. Within the framework of the tree species the removal of beech by thinnings was highest in accordance with its highest proportion on all plots.
Reduction in the category another decrease (breaks of stems, windthrows) assumed negligible values during 30 years of investigation and ranged from 0 to 1.3%. The highest decrease in N by self-thinning was found on control plots 67.8% and 48.9% of the total pro-duction while on tended plots it was 28.337.0%. Ac-cording to the tree species expressed by an absolute number of trees, the following order was found: beech, fir, sycamore maple, spruce, others. According to the percentage in total production the highest decrease was unambiguously registered for fir on all plots but differences between the other tree species were low, so that their order changed from plot to plot.
The total decrease according to G over 30 years on
tended plots was from 44% to 49% of total production while it was 23% and 29% on control plots. Total
de-crease according to V7b on tended plots was 3540%,
and 15% and 18% on control plots.
Expression of total production during 30 years within the framework of tree species brought about the fol-lowing order: beech, fir, spruce, sycamore maple ac-cording to N, but acac-cording to V7b it was: beech, spruce, fir and sycamore maple apart from II H plot. The silvicultural analysis showed that the most
inten-sive treatment was carried out by the first thinning at the crown level of the stand (5273% according to G), followed by a treatment at the suppressed tree level (19.131.7%), negative stem selection (1.825.9%) and finally sanitary selection (3.03.6%).
It is clear from our long-term results that as for the thin-ning intensity and interval one more intensive treatment could be done (1525%) for a period of 7 to 10 years.
R e f e re n c e s
ASSMANN E., 1961. Waldertragskunde. München-Bonn-Wien, BVL Verlagsgesellschaft: 490.
BALCAR V., 2001. Umìlá obnova lesních porostù v horských podmínkách. In: Souèasné otázky pìstování horských lesù. Opoèno, VS VÚLHM: 135138.
GUBKA K., 2001. Uplatnenie prirodzenej a umelej obnovy v ochranných lesoch 7. lvs v Nízkych Tatrách. In: Souèasné otázky pìstování horských lesù. Opoèno, VS VÚLHM: 221 230.
HANÈINSKÝ L., 1972. Lesné typy Slovenska. Bratislava, Príroda: 307.
HLADÍK M., 1992. Vývoj truktúry a produkcie zmieaného smrekovo-jed¾ovo-bukového porastu pri uplatòovaní zásad výberného hospodárskeho spôsobu. In: Acta Fac. For. Zvolen., 34: 205220.
HLADÍK M., 1996. Prírodné podmienky hospodárenia, súèas-ná truktúra lesného fondu. In: Klimatické zmeny a lesy Slo-venska. Bratislava, MP SR a SHMÚ: 1218.
HOCKENJOS F., 1968. Waldbauliche Erfahrungen im Fich-ten-Tannen-Buchenwald des Westschwarzwaldes. Allg. Forst- Jagdztg, 139: 1318.
JURÁSEK A., 2001. Pìstování sadebního materiálu pro zalesòování v horských polohách. In: Souèasné otázky pìs-tování horských lesù. Opoèno, VS VÚLHM: 6164. KANTOR P., PAØÍK T., 1998. Produkèní potenciál a
ekolo-gická stabilita smíených lesních porostù v pahorkatinách I. Jehliènatý porost s pøímìsí buku na kyselém stanoviti LP Køtiny. Lesnictví-Forestry, 44: 488505.
KORPE¼ ., 1996. Prirodzená obnova horských smreèín. In: Ved. práce LVÚ vo Zvolene, 41. Bratislava, SAP: 143152. KORPE¼ ., VIN B., 1965. Pestovanie jedle. Bratislava, SVPL:
340.
LEIBUNDGUT H., AUER C., WIELAND C., 1971. Ergeb-nisse von Durchforstungsversuchen 19301965 im Sihlwald. In: Mitt. Schweiz. Anst. forstl. Vers.-Wes, 47: 257389. MÁLEK J., 1983. Problematika ekologie jedle bìlokoré a
je-jího odumírání. Studie ÈSAV è.11/83. Praha, Academia: 112. MOLOTKOV P.I., 1966. Bukovyje lesa i chozjajstvo v nich.
Moskva, Izd. Lesn. Prom.: 224.
OTT E. et al., 1995. Pestovanie horských lesov vajèiarska a Slovenska. Zvolen, ÚVVP LVH SR: 127.
PAUMER V., 1978. Výkové a hrúbkové èlenenie jed¾ovo-smrekovo-bukových hútin. In: Ved. práce VÚLH vo Zvo-lene, 27. Bratislava, Príroda: 143158.
SLODIÈÁK M., 2001. Souèasné problémy výchovy lesních porostù v horských podmínkách. In: Souèasné otázky pìs-tování horských lesù. Opoèno, VS VÚLHM: 277280. EBÍK L., POLÁK L., 1990. Náuka o produkcii dreva.
Bra-tislava, Príroda: 322.
TEFANÈÍK I., 1999. Vplyv snehovej kalamity na vývoj zmie-anej smrekovo-jed¾ovo-bukovej rïoviny na výskumnej ploche Stará Píla. Lesn. Èas. Forestry Journal, 45: 181 204.
TEFANÈÍK I., TEFANÈÍK L., 1998. Zhodnotenie vplyvu výchovy na zachovanie biodiverzity zmieaných smrekovo--jed¾ovo-bukových porastov. Lesn. Èas. Forestry Journal,
44: 485501.
TEFANÈÍK I., TEFANÈÍK L., 2001. Assessment of tend-ing effect on stand structure and stability in mixed stands of spruce, fir and beech on research plot Hrable. J. For. Sci.,
47: 114.
TEFANÈÍK L., 1974. Prebierky bukových rïovín. Lesn. túd. è.18. Bratislava, Príroda: 141.
TEFANÈÍK L., 1977a. Preèistky a prebierky v zmieaných smrekovo-jed¾ovo-bukových porastoch. Lesn. túd. è. 25. Bratislava, Príroda: 92.
TEFANÈÍK L., 1977b. Pestovná analýza prebierok v zmieanom smrekovo-jed¾ovo-bukovom poraste na vý-skumnej ploche Korytnica. Lesnictví, 23: 633650. TEFANÈÍK L., 1981. Prebierky v buèinách s osobitným
TEFANÈÍK L., 1984. Úrovòová vo¾ná prebierka metóda biologickej intenzifikácie a racionalizácie selekènej výcho-vy bukových porastov. In: Ved. práce VÚLH vo Zvolene,
34. Bratislava, Príroda: 69112.
TEFANÈÍK L., 1990. Vplyv prebierok na truktúru a stabili-tu zmieaných smrekovo-jed¾ovo-bukových porastov. In: Ved. práce VÚLH vo Zvolene, 39. Bratislava, Príroda: 111 128.
VACEK S. et al., 2000. Vývoj pokození lesních ekosystémù Orlických hor. In: Lesnické hospodaøení v imisní oblasti Orlických hor. Opoèno, VS VÚLHM: 3964.
VACEK S., 2001. Pøirozená obnova lesních porostù v horských oblastech. In: Souèasné otázky pìstování horských lesù. Opoèno, VS VÚLHM: 205208.
VLADOVIÈ J. et al., 1998. Prehodnotenie cie¾ového zloenia lesných drevín s dôrazom na vyuívanie prirodzenej obnovy. [Závereèná správa.] Zvolen, LVÚ: 53.
Received 24 January 2002
Zhodnotenie dlhodobej výchovy v zmieanom smrekovo-jed¾ovo-bukovom poraste
na výskumnej ploche Korytnica
I. TEFANÈÍK, L. TEFANÈÍK
Lesnícky výskumný ústav, Zvolen, Slovenská republika
ABSTRAKT:Príspevok sa zaoberá problematikou prebierok v zmieanom (sm-jd-bk) poraste 6. lesného vegetaèného stup-òa. Tri z piatich sledovaných plôch sa dlhodobo vychovávali úrovòovou vo¾nou prebierkou, resp. dve plochy sa ponechali bez úmyselného zásahu ako kontrolné. Vyhodnotili sa dynamické zmeny drevinového zloenia, porastovej truktúry, kvali-tatívnej a kvantikvali-tatívnej produkcie za obdobie 30 rokov. Zistené zmeny sa porovnali aj z h¾adiska rozdielov medzi dlhodobo vychovávanými plochami a kontrolnými plochami (bez zásahu).
K¾úèové slová:horské lesy;prebierky; zmieané porasty; smrek jed¾a buk
Cie¾om práce bolo zisti a zhodnoti zmeny v drevino-vom zloení, porastovej truktúre, v kvalitatívnej a kvan-titatívnej produkcii zmieaného smrekovo-jed¾ovo--bukového porastu na výskumnej ploche Korytnica za 30-roèné obdobie výchovy.
Objektom výskumu bol zmieaný smrekovo-jed¾ovo--bukový porast v rastovej fáze rïoviny a tenkej kmeòoviny na trvalej výskumnej ploche (TVP) Korytnica, ktorá sa nachádza v obvode Lesnej správy Liptovská Osa-da, Odtepný závod Liptovský Hrádok. TVP bola zaloená v roku 1967 na výskum problematiky pestovno-pro-dukèných vzahov v zmieaných smrekovo-jed¾ovo-bu-kových porastoch. Sériu TVP Korytnica tvorí pä èiast-kových plôch tri s výmerou 0,08, 0,10 a 0,12 ha (oznaèené
ako H), kde sa aplikuje úrovòová vo¾ná prebierka (TE
-FANÈÍK L. 1984), dve sú kontrolné (oznaèené ako O) s vý-merou 0,08 a 0,10 ha. Plochy sú medzi sebou i od ostatného porastu oddelené 10 m irokými pásmi stromovia, tzv. izolaèným pásom. Pred zaloením výskumných plôch sa v sledovanom poraste len zriedkavo vykonávali prebier-kové zásahy, aj to slabé, zamerané na odstraòovanie ten-kých, resp. hynúcich jedincov.
Na plochách sú stromy oèíslované s oznaèením meriska hrúbky vo výke 1,3 m. Na kadej ploche sa vykonávajú kompletné biometrické merania oèíslovaných stromov v päroèných intervaloch v súlade so tandardnými me-todikami, ktoré sú vypracované pre dlhodobý výskum
pestovno-produkèných otázok prebierok (TEFANÈÍK L.
1977a). V rámci nich sa okrem kvantitatívnych znakov (hrúbka d1,3, výka stromu, rozmery koruny pri horizontál-nej projekcii) hodnotili stromy aj pod¾a pestovhorizontál-nej a hos-podárskej klasifikácie s orientáciou na pestovanie stromov výberovej kvality, ktoré sú jej hlavným nosite¾om. Od zaloenia TVP sa tu vykonalo sedem biometrických me-raní a súèasne s meraniami sa vdy vykonal aj prebier-kový zásah.
Z h¾adiska fytotechniky sa na zasahovaných plochách (H) aplikovala metóda nádejných a neskôr cie¾ových stro-mov (TEFANÈÍK L. 1984), ktorá sa zameriava na individuál-nu výchovu tzv. stromov výberovej kvality. Pred zapo-èatím výskumu bol pre TVP Korytnica vypracovaný
mo-del drevinového a produkèného cie¾a (TEFANÈÍK L.
V príspevku sme vyhodnotili prvé meranie (v roku 1968) vykonané pri zaloení plochy a posledné meranie (v roku 1998), aby sme porovnali dynamické zmeny sledovaných znakov na èiastkových TVP za obdobie 30 rokov.
Vyhodnotenie 30-roèných zmien v drevinovom zloení, porastovej truktúre, v kvalitatívnej a kvantitatívnej pro-dukcii vye 80-roèného zmieaného smrekovo-jed¾ovo--bukového porastu, v 6. lesnom vegetaènom stupni na ivnom stanoviti prinieslo nasledujúce výsledky: Pri východiskovom stave bol podiel ihliènanov na
vy-chovávaných plochách (H) od 29 % do 58 %, kým na kontrolných plochách (O) 50 % a 33 %. Pod¾a drevín mal najvyie zastúpenie buk (3761 %), potom jed¾a (1330 %), smrek (628 %), a napokon javor horský (311 %). Za 30 rokov dolo k zníeniu podielu ihliènanov na vychovávaných plochách na 2748 %, kým na kontrolných plochách na 4729 %. V rámci jednotlivých drevín sa na zasahovaných plochách zvýilo zastúpenie smreka (o 411 %) a tie buka (o 311 %). Na druhej strane sa zníilo zastúpenie jed-le o 522 %. Na kontrolných plochách sa zvýilo zastúpenie smreka o 5 %, resp. 4 %, a tie zastúpenie buka o 2 % a 3 %. K najväèím zmenám za sledované 30-roèné obdobie dolo u jedle (redukcia o 89 %) v prospech ostatných drevín (smrek, buk, javor horský). Pri východiskovom stave sa zastúpenie smreka v úrov-ni porastu na vetkých plochách pohybovalo v rozpätí 2156 %, jedle 1330 %, buka 1950 % a javora hor-ského od 4 % do 52 %. Po 30-roènom období bol na zasahovaných plochách smrek zastúpený v úrovni od 33 % do 89 %, jed¾a od 14 % do 36 %, buk od 32 % do 47 % a javor horský od 25 % do 50 %. Na dvoch kontrolných plochách bolo zastúpenie smreka v úrov-ni porastu 46 % a 75 %, jedle 50 % a 60 %, buka 32 % a 48 %, javora horského 40 % a 45 %.
Pri zaloení TVP sa poèet nádejných stromov (bu-dúcich cie¾ových stromov) pohyboval od 210 stromov na ha do 363 stromov na ha, prièom na zásobe porastu sa podie¾ali v rozpätí 3248%. Po 30-roènom období sa poèet cie¾ových stromov zníil, take na zasaho-vaných plochách sa ich poèet pohyboval od 176 stro-mov na ha do 226 strostro-mov na ha, kým na kontrolných plochách to bolo 162 stromov na ha a 140 stromov na
ha. Na zasahovaných plochách sa cie¾ové stromy podie¾ali na zásobe porastu v rozpätí od 53 % do 74 %, kým na kontrolných plochách to bolo iba 40 % a 42 %.
Na zasahovaných plochách H sa prvou prebierkou súhrnne za vetky dreviny odstránilo z celkového
poè-tu stromov N 13,519,7 %, z celkovej kruhovej
základne G 12,715,8 % a z celkového objemu
hru-biny V7b 1115 %. V rámci drevín sa zásahom
odstrá-nilo najviac buka, èo súvisí s tým, e bol aj drevinou s najväèím zastúpením na vetkých plochách. Zmeny poètu stromov z h¾adiska iného úbytku (zlomy,
vývraty) dosahovali poèas 30 rokov sledovania zaned-bate¾né hodnoty a pohybovali sa od 0 do 1,3 %. Najväèí úbytok poètu stromov samoprerieïovaním
sme zistili na kontrolných plochách, a to 67,8 % a 48,9 % z CP, kým na zasahovaných plochách to bolo 28,337,0 % z CP. Pod¾a drevín pri absolútnom vy-jadrení z poètu stromov bolo poradie buk, jed¾a, ja-vor, smrek, ostatné, ale pri vyjadrení pod¾a percenta z CP bol jednoznaène najväèí úbytok zaznamenaný u jedle na vetkých plochách, rozdiely medzi ostat-nými drevinami neboli ve¾ké, prièom ich poradie sa menilo z plochy na plochu.
Pri vyhodnotení celkového úbytku za 30 rokov sme zistili, e na zasahovaných plochách pod¾a G tvoril 4449 % z celkovej produkcie (CP), kým na kontrol-ných plochách 2329 %. Pri vyjadrení celkového
úbytku pod¾a V7b to èinilo na zasahovaných plochách
3540 %, resp. na kontrolných plochách 15 % a 18 %. Pri vyjadrení celkovej produkcie za 30 rokov pod¾a drevín je poradie nasledovné: buk, jed¾a, smrek,
ja-vor pod¾a poètu stromov, ale pod¾a V7b je to: buk,
smrek, jed¾a, javor (okrem plochy II H).
Pestovná analýza prebierok ukázala, e pri prvom zá-sahu sa najviac zasahovalo v úrovni porastu (52 73 % pod¾a kruhovej základne), ïalej nasleduje pod-úrovòový zásah (19,131,7 %), potom negatívny tvarový výber (1,825,9 %) a nakoniec zdravotný vý-ber (3,03,6).
Z naich dlhodobých výsledkov vyplýva, e èo sa týka prebierkového intervalu, postaèoval by jeden silnejí zásah (1525 %) za obdobie 710 rokov.
Corresponding author: