Original Article
CD21 and CD23 expression differences in small B-cell
lymphomas: comparative analysis in follicular dendritic
cells and tumor cells
Yunfei Shi, Xianghong Li, Yumei Lai, Ling Jia
Key Laboratory of Carcinogenesis and Translational Research (Ministry of Education/Beijing), Department of Pathology, Peking University Cancer Hospital & Institute, Beijing, China
Received March 30, 2016; Accepted June 11, 2016; Epub August 1, 2016; Published August 15, 2016
Abstract: Objective: Different follicular dendritic cells (FDCs) meshwork patterns were observed in small B-cell lym-phomas (SBL) specimens. However, the accurate CD21 and CD23 expression differences in both follicular dendritic cells (FDCs) and tumor cells in SBLs were not sufficiently investigated. Methods: CD21 and CD23 immunostainings were performed on our surgically resected SBL samples to compare their differences in detecting of FDC meshwork immunoarchitectural patterns (FDC patterns), three parameters were introduced for accurate description and com-parison of FDC patterns: including the ratio of FDC meshwork outlined area to total tumor area (ROT), staining inten-sity, and major patterns type (I, expanded follicles with sharp margin; II, contracted follicles with moth-eaten margin; III, ill-defined expanded nodules; IV, absent). The exact expression frequencies of CD21 and CD23 in all SBL groups was also evaluated and compared using double immunohistochemistry (D-IHC). Results: 103 nodal SBL cases, including 32 follicular lymphoma (FL), 28 marginal zone lymphoma (MZL), 23 mantle cell lymphoma (MCL), and 20 chronic lymphocytic leukemia/small lymphocytic lymphoma (CLL/SLL) cases were examined for more accurate data of FDC pattern parameters, including the mean of ROTs, the percentages of cases exhibiting strongly positive staining and the most common distribution patterns. For CD21 and CD23 they were (46.3% and 39.2%), (81.3% and 78.1%) and (type I, accounting for 93.8% and 81.3%) of all cases respectively in the FL group, (21.4% and 16.8%), (56.5% and 82.6%) and (type III, accounting for 47.8% and 52.2%) in the MCL group, (23.7% and 28.6%), (71.4% and 92.8%) and (type II, accounting for 50% and 67.9%) respectively in the MZL group, and (2.2% and 0.3%), (20% and 5%) and (type IV, accounting for 60% and 95% cases) respectively in the CLL/SLL group. No significant differ-ence was seen in CD21 and CD23 labeling of the FDC pattern parameters. Based on the results of D-IHC, CD21 was detected in 28.1%, 60.9%, 60.7% and 55% of the tumor cells from the FL, MCL, MZL and CLL/SLL samples, respectively, and CD23 was detected in 34.4%, 21.7%, 28.6% and 95% of the respective samples. Conclusion: The most common distribution pattern of FDC patterns was identical between these two markers. Both displayed pattern I in FL, III in MCL, II in MZL and IV in CLL/SLL. The D-IHC results showed that both CD21 and CD23 were expressed in partial cases from each SBL subtype. CD21 expression was much less abundant in FL tumor cells, and CD23 expression was much more abundant in CLL/SLL tumor cells.
Keywords: B cell lymphoma, follicular dendritic cell, biomarker, comparative study, double immunohistochemical staining
Introduction
Small B-cell lymphomas (SBL) is not a specific type of B cell non-Hodgkin lymphoma [1, 2], they are often small in cell size, grow in a dif-fuse/nodular pattern and all express CD20 [1]. In this study, we focused on the four most com-mon subtypes of SBL: low-grade follicular lym-phoma (FL, grade 1/2), mantle cell lymlym-phoma (MCL), marginal zone lymphoma (MZL) and
chronic lymphocytic leukemia/small lymphocyt-ic lymphoma (CLL/SLL). There are differences in their clinical presentation, pathobiology, prognosis, as well as specific treatment options, in accordance with their heterogeneous origin of neoplastic cells, thus, their accurate classifi-cation is important.
immunophenotypic examination, fairly specific markers existed in differential diagnosis of SBL subtypes, for example, Cyclin D1 in MCL [3, 4], LEF1 in CLL/SLL [5] and germinal center mark-ers in follicular lymphoma [1]. However, accu-rate diagnosis for several instances of SBLs with borderline histopathology/immuno-pheno-types might still be difficult. Resent works revealed reliable microenvironmental findings including follicular dendritic cells (FDC) pat-terns could be used as additional markers of differential diagnosis [6-10].
MCL, MZL and FL are follicle-derived lympho-mas (FDLs) [9], excluding CLL/SLL. Fakan and our previous study [11, 12] also confirmed that there were significant differences in the distri-bution of follicular dendritic cell immunoarchi-tectural patterns (FDC patterns) among types of SBLs on formalin fixed paraffin embedded (FFPE) tissue, which also demonstrated that alterations in FDC patterns provided supple-mental assistance in the identification of spe-cific SBL subtypes.
CD3d receptor (CD21) and low affinity IgE receptor (CD23) were two most frequently mak-ers used to reveal FDC patterns with immuno-histochemistry [3, 13, 14], for FFPE lymphoid tissues. Troxell’s group [15] reported that CD21 was more sensitive than CD23 for labeling FDCs in AITL, and Jin et al. [16] reported that CD23 expression by FDCs was decreased in FL, MCL and AITL relative to healthy controls, but the alterations in CD21 expression, compari-son with CD23 expression and CD21 and CD23 expression frequencies on SBL tumor cells were not fully studied, and traditional IHC meth-od would not be sufficient because expression of FDC patterns would be mixed with tumor cells, for example, CD23 expression was seen in 94% of the CLL/SLL [17].
This study would like to present a distinctive new characteristic: it was carried out on SBL samples collected from our department, in an attempt to accurately identify the differences in FDC patterns labeled by CD21 and CD23 in all SBL subtypes. Double immunohistochemistry of CD21/PAX5 and CD23/PAX5 were also per-formed to determine whether the PAX5-positive SBL tumor cells truly express CD21 and/or CD23 and the exact frequencies. The value to
evaluate these staining results in differential diagnosis was further discussed.
Materials and methods Specimen collection
Excisional specimens diagnosed as SBL were collected at our department from November 2008 to August 2014. The pathological diagno-sis was reviewed by at least two hematopathol-ogists according to the WHO 2008 lymphoma classification.
Hematoxylin & eosin staining
Specimens were fixed in 10% neutralized for-malin, embedded in paraffin, and cut into 4-μm thick tissue sections. Morphological character-istics were observed via hematoxylin & eosin staining under an Olympus BX43 microscope. Immunohistochemical staining
IHC for CD21 (EP3093, Abcam, Cambridge, UK) and CD23 (SP23, Thermo Fisher, Rockford, USA) was performed using a BenchMark ULTRA automated IHC/ISH staining instrument (Tu- cson, VENTANA-Roche, USA) and a ultraVIEW kit (Tucson, VENTANA-Roche, USA). Dilution of CD21 and CD23 in IHC were 1:100.
Double immunohistochemical staining
Briefly, heat-induced epitope retrieval was per-formed by heating slides in EDTA buffer at pH 8.0 using a stainless pressure cooker for 90 seconds, and all antibodies applied were incu-bated overnight in a moist chamber at 4-8°C. Settings for experimental controls
Reactive lymph nodes were used as positive controls: In reactive germinal centers (GC), IHC for FDC markers showed sharply dense FDC meshwork by both CD21 and CD23, meshed FDCs of the light zone were much denser than those in the dark zone, which was in accor-dance with polarization of GC. Signals were located on the cell membrane, in the cytoplasm and dendritic processes at high magnification. The positive D-IHC signals of CD21 and CD23 on FDCs were red, whereas those of PAX5 were brown, as detected in mature B lymphocytes. A negative control was also established for IHC or D-IHC staining (primary antibodies omitted). Pathological interpretation
The following parameters were assessed for accurate comparisons between those two mak-ers: (1) ratio of FDC meshwork outlined area to total tumor area(ROT): observed the entire slide at low magnification (20 ×); (2) FDC staining intensity, which was categorized as strongly positive (uniform and complete surface stain-ing of FDC as strong as the ‘positive control’ sample), weakly positive (uneven or moderate surface staining, appeared light brown) or neg-ative (faintly expressed or no reaction); and (3) FDC staining distribution pattern types were classified according to the most evident (>80%) distribution pattern in each sample, they were recorded as: I (abnormal expanded follicles, sharp margin), type II (contracted follicular meshwork, moth-eaten margin), type III (loosely arranged, ill-defined, and irregularly expanded nodules;) or type IV (absent FDC meshwork), D-IHC interpretation
CD21 and CD23 antibodies were used to exam-ine the membrane and cytoplasm expression in FDCs and tumor cells (Fast Red); PAX5 exhibit-ed nuclear staining in tumor cells (DAB). This approach can assist in confirming that malig-nant B cells (PAX5-positive cells) also expressed CD21 and/or CD23. CD21 or CD23 was consid-ered positive by the PAX-positive tumor if more than 10% of the cells are positive.
Statistical analysis
SPSS 17.0 statistical software was used to per-form χ2 tests for comparisons of measurement data between two antibodies staining and cor-relation analysis and to perform t tests for com-parisons of the mean values of measurement data.
Results
Ultimately, 103 patients were selected. There were 32 cases of FL, 23 cases of MCL, 28 cases of MZL and 20 cases of CLL/SLL. Given that differential pathological diagnosis is usu-ally difficult for SBL located in lymph nodes (here after referred to as “nodal cases”), only nodal cases were included to increase the con-sistency of the results.
Histological features and tumor growth pattern of the various SBL subtypes
FL: Most FL (Low-grade) samples exhibited fol-licular distribution pattern (90.6%, 29/32), while 3 of them had additional diffuse areas (10.3%, 3/29); other FL cases showed diffuse tu- mor growth (9.4%, 3/32). Most of the tumor ce- lls were small centrocytes, which were accom-panied by varying amounts of larger, scattered centroblasts.
MCL: These samples typically displayed a dif-fuse tumor cell distribution (12/23, 52.2%), but a subset of cases exhibited vaguely nodular patterns (9/23, 39.1%), and 1 with mantle zone pattern (nodular growth pattern with residual GCs, 1/23, 4.3%), 1 with diffuse patterns (1/23, 4.3%). Tumor cells were often ob- served to contain dispersed chromatin, incon-spicuous nucleoli, thickened nuclear mem-brane, and hyalinized small vessels were com-monly detected.
CLL/SLL: 50.0% (10/20) cases typically exhib-ited diffuse infiltration, others (10/20, 50.0%) grew in pseudo-follicular pattern (regularly dis-tributed pale areas corresponding to “prolifera-tion centers”). The small tumor B-cells exhibit-ed round nuclei with small nucleoli. The “proliferation center” usually contained larger cells in a dark background of small cells. In summary, the tumor morphology of all four SBL subtypes exhibited many common fea-tures: Their tumor cells were small in size, 52.4% (54/103) of them could grow in follicle-like pattern (that is, nodular/follicular/pseudo-follicular, and 29 FL, 9 MCL, 9 MZL, 10 CLL/ SLL). 29.1% (30/103) of them would have dif-fuse areas (3 FL, 12 MCL, 5 MZL, 10 CLL/SLL), thus, the differential diagnosis based solely on morphology would be difficult.
Analysis of the IHC staining results in different SBL subtypes
Multi-parameter analysis of FDC patterns by CD21 and CD23 IHC staining in different SBL subtypes
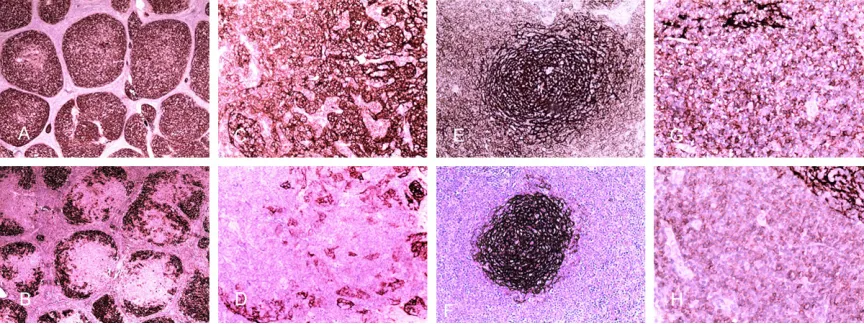
FL: The ROT for CD21 (Figure 1A) ranged from 10% to 70%, with a mean value of 46.3%.
Approximately 81.3% (26/32) of the samples showed strongly positive CD21 staining, and 93.8% (30/32) of all samples were classified as type I. For CD23 (Figure 1B), the ROT ranged from 5% to 80%, with a mean value of 39.2%. Approximately 78.1% (25/32) of the samples showed strongly positive staining; whereas the most common distribution pattern was also type I, which accounted for 81.3% (26/32) of all cases. Compared with CD23, CD21 showed sig-nificantly higher staining intensity and greater proportion of type I (P=0.003 and P<0.001, respectively). Although the ROT was higher for CD21 than for CD23, this difference was not significant (P=0.051).
MCL: The ROT for CD21 ranged from 0% to 60% (Figure 1C), with a mean value of 21.4%. Ap- proximately 56.5% (13/23) of all cases showed strongly positive CD21 staining. The type III dis-tribution of CD21 was the most common, accounting for 52.2% (12/23) of all cases. The ROT for CD23 ranged from 0% to 60% (Figure 1D), with a mean value of 16.8%. Additionally, 82.6% (19/23) of the cases showed strongly positive staining, and CD23 staining primarily exhibited a type III distribution (47.8% of all cases, 11/23). The staining intensity was
[image:4.612.90.522.72.234.2]nificantly higher for CD23 than for CD21 (P= 0.011) based on statistical analysis. The ROT and the proportion of samples displaying a type III distribution were higher for CD21 than for CD23, but these differences were not signifi-cant (P=0.128 and P=0.182, respectively). MZL: The ROT for CD21 ranged from 0% to 70% (Figure 1E), with a mean value of 23.7%. Approximately 71.4% (20/28) of all samples showed strongly positive staining. The most common distribution of CD21 staining was type II (50% of all cases, 14/28). The ROT for CD23
[image:5.612.92.522.85.239.2]ranged from 0% to 80% (Figure 1F), with a mean value of 28.6%. Strongly positive staining was observed in 92.8% (26/28) of all cases, and the type II distribution of CD23 labeling accounted for 67.9% (16/28) of all cases. Based on statistical analysis, CD23 staining intensity was significantly higher than CD21 (P=0.001). Additionally, the ROT and the pro-portion of samples displaying a type II distribu-tion were higher for CD23 than for CD21, but these differences were not significant (P=0.213 and P=0.054, respectively).
Table 1. Main parameters for FDC-IP stained by CD21 and CD23 in small B-cell lymphoma Ratio of FDC-IP covered area
to tumor area FDC-IP staining intensity FDC-IP distribution pattern Range (%) Mean (%) P value Positive (No.)Strongly Strongly posi-tive ratio (%) Most com-mon type Number (%)
FL (n=32) CD21 10%-70% 46.3% 0.051 26 81.3 I 30 (93.8%)
CD23 5%-80% 39.2% 25 78.1 I 26 (81.3%)
MCL (n=23) CD21 0%-60% 21.4% 0.128 13 56.5 III 12 (52.2%)
CD23 0%-60% 16.8% 19 82.6 III 11 (47.8%)
MZL (n=28) CD21 0%-70% 23.7% 0.213 20 71.4 II 14 (50%)
CD23 0%-80% 28.6% 26 92.8 II 19 (67.9%)
CLL/SLL (n=20) CD21 0%-10% 2.5% 0.029 4 20.0 IV 12 (60%)
CD23 0%-5% 0.3% 1 5.0 IV 19 (95%)
Abbreviations: FDC-IP: follicular dendritic cell immunoarchitectural patterns; FL: follicular lymphoma; MCL: mantle cell lym-phoma; MZL: marginal zone B-cell lymlym-phoma; CLL/SLL: chronic lymphocytic leukemia/small lymphocytic lymlym-phoma; Type I: FDC-IP follicular hyperplasia; Type II: residual FDC-IP eroded peripherally; Type III: FDC-IP with patches and clusters of irregular shape; Type IV FDC-IP disappeared.
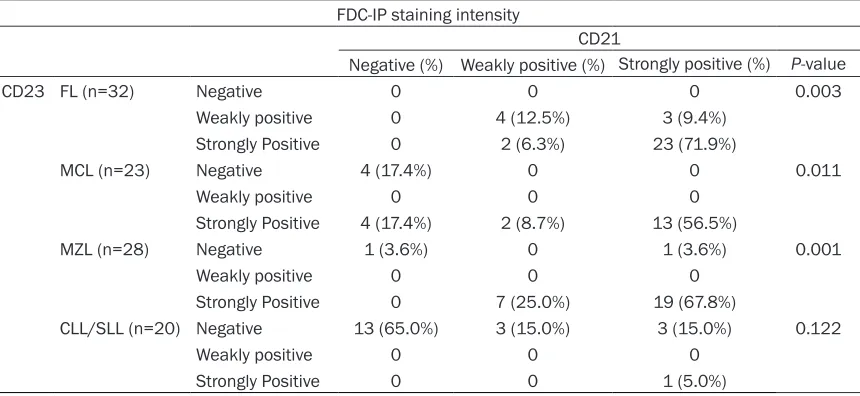
Table 2. The relationship between the SBL histopathologic type and the intensity of FDC-IP stained by CD21 or CD23
FDC-IP staining intensity
CD21
Negative (%) Weakly positive (%) Strongly positive (%) P-value
CD23 FL (n=32) Negative 0 0 0 0.003
Weakly positive 0 4 (12.5%) 3 (9.4%)
Strongly Positive 0 2 (6.3%) 23 (71.9%)
MCL (n=23) Negative 4 (17.4%) 0 0 0.011
Weakly positive 0 0 0
Strongly Positive 4 (17.4%) 2 (8.7%) 13 (56.5%)
MZL (n=28) Negative 1 (3.6%) 0 1 (3.6%) 0.001
Weakly positive 0 0 0
Strongly Positive 0 7 (25.0%) 19 (67.8%)
CLL/SLL (n=20) Negative 13 (65.0%) 3 (15.0%) 3 (15.0%) 0.122
Weakly positive 0 0 0
Strongly Positive 0 0 1 (5.0%)
[image:5.612.92.522.328.526.2]CLL/SLL: The ROT for CD21 (Figure 1G) ranged from 0% to 10% (mean 2.2%). Strongly positive CD21 staining was detected in 20% (4/20) of all cases. The most common staining distribu-tion was type IV, which accounted for 60% (12/20) of all cases. The ROT for CD23 ranged from 0% to 5% (Figure 1H), with a mean value of 0.3%. Strongly positive staining was detect-ed in 5% (1/20) of all cases. The most common distribution of CD23 staining was type IV, accounting for 95% (19/20) of all cases. Based on statistical analysis, the ROT was significantly higher for CD21 than for CD23 (P=0.029).A higher staining intensity and fewer cases dis-playing a type IV distribution (disappearance of FDC patterns) were observed for CD21 than for CD23, although these differences were not sig-nificant (P=0.122 and P=0.051, respectively). All details are presented in Tables 1-3.
Grading of ROT and Comparison of all param-eters in different types of SBL
ROT was further graded as low (<5%), moderate (5-30%) or high (>30%) to facilitate statistical analysis and application to pathological
diagno-sis. The percentages of ROT scored as “high” were as follows: for CD21 and CD23, 90.6% (29/32) and 68.8% (22/32) in FL, 28.1% (9/23) and 28.1% (9/23) in MCL, 39.3% (11/28) and 46.4% (13/28) in MZL, and 5% (1/20) and 5% (1/20) in CLL/SLL, respectively.
Further statistical analysis revealed significant differences (all P<0.001) for all examined parameters of CD21 and CD23 staining, includ-ing the ROT classification, the staininclud-ing intensity grade, and the distribution pattern classifica-tion, among all four pathological types of SBL (all with P value <0.01, Table 4).
Comparison of CD21 and CD23 expression in SBL tumor cells based on D-IHC
D-IHC staining for CD21/PAX5 and CD23/PAX5 was successfully performed, and the analyses of these results were combined with the mor-phological and classical IHC staining results. The percentages of CD21-positive tumor cells were as follows: FL (28.1%), MCL (60.9%, see Figure 2), MZL (60.7%), and CLL/SLL (55%, Figure 2A and 2B). The percentages of CD23-Table 3. The relationship between the SBL histopathologic type and the FDC distribution pattern labeled by CD21 and CD23
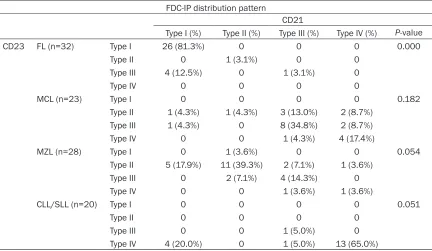
FDC-IP distribution pattern
CD21
Type I (%) Type II (%) Type III (%) Type IV (%) P-value
CD23 FL (n=32) Type I 26 (81.3%) 0 0 0 0.000
Type II 0 1 (3.1%) 0 0
Type III 4 (12.5%) 0 1 (3.1%) 0
Type IV 0 0 0 0
MCL (n=23) Type I 0 0 0 0 0.182
Type II 1 (4.3%) 1 (4.3%) 3 (13.0%) 2 (8.7%)
Type III 1 (4.3%) 0 8 (34.8%) 2 (8.7%)
Type IV 0 0 1 (4.3%) 4 (17.4%)
MZL (n=28) Type I 0 1 (3.6%) 0 0 0.054
Type II 5 (17.9%) 11 (39.3%) 2 (7.1%) 1 (3.6%)
Type III 0 2 (7.1%) 4 (14.3%) 0
Type IV 0 0 1 (3.6%) 1 (3.6%)
CLL/SLL (n=20) Type I 0 0 0 0 0.051
Type II 0 0 0 0
Type III 0 0 1 (5.0%) 0
Type IV 4 (20.0%) 0 1 (5.0%) 13 (65.0%)
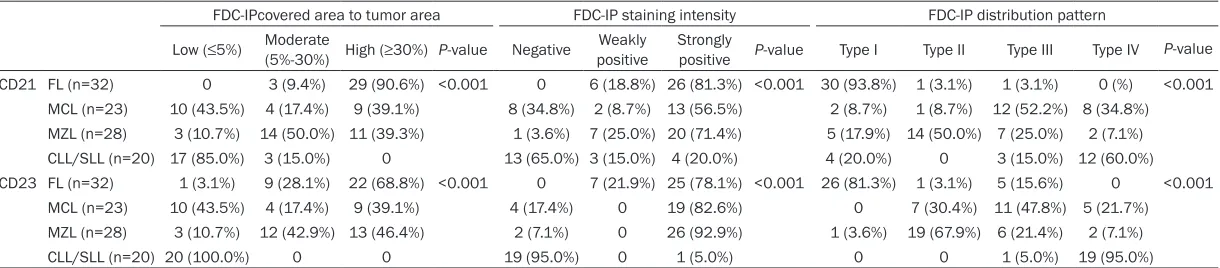
[image:6.612.90.522.96.347.2]Table 4. Differences among the different pathological types of small B-cell lymphomas with respect to the characteristic parameters of the FDC-IP revealed by immunohistochemical staining with CD21 and CD23
FDC-IPcovered area to tumor area FDC-IP staining intensity FDC-IP distribution pattern
Low (≤5%) Moderate (5%-30%) High (≥30%) P-value Negative positiveWeakly Strongly positive P-value Type I Type II Type III Type IV P-value CD21 FL (n=32) 0 3 (9.4%) 29 (90.6%) <0.001 0 6 (18.8%) 26 (81.3%) <0.001 30 (93.8%) 1 (3.1%) 1 (3.1%) 0 (%) <0.001
MCL (n=23) 10 (43.5%) 4 (17.4%) 9 (39.1%) 8 (34.8%) 2 (8.7%) 13 (56.5%) 2 (8.7%) 1 (8.7%) 12 (52.2%) 8 (34.8%) MZL (n=28) 3 (10.7%) 14 (50.0%) 11 (39.3%) 1 (3.6%) 7 (25.0%) 20 (71.4%) 5 (17.9%) 14 (50.0%) 7 (25.0%) 2 (7.1%) CLL/SLL (n=20) 17 (85.0%) 3 (15.0%) 0 13 (65.0%) 3 (15.0%) 4 (20.0%) 4 (20.0%) 0 3 (15.0%) 12 (60.0%) CD23 FL (n=32) 1 (3.1%) 9 (28.1%) 22 (68.8%) <0.001 0 7 (21.9%) 25 (78.1%) <0.001 26 (81.3%) 1 (3.1%) 5 (15.6%) 0 <0.001
MCL (n=23) 10 (43.5%) 4 (17.4%) 9 (39.1%) 4 (17.4%) 0 19 (82.6%) 0 7 (30.4%) 11 (47.8%) 5 (21.7%) MZL (n=28) 3 (10.7%) 12 (42.9%) 13 (46.4%) 2 (7.1%) 0 26 (92.9%) 1 (3.6%) 19 (67.9%) 6 (21.4%) 2 (7.1%) CLL/SLL (n=20) 20 (100.0%) 0 0 19 (95.0%) 0 1 (5.0%) 0 0 1 (5.0%) 19 (95.0%)
positive tumor cells were as follows: FL (34.4%), MCL (21.7%), MZL (28.6%), and CLL/SLL (95%). Statistical analysis showed that the percentag-es of SBL tumor cells exprpercentag-essing CD21 and CD23 were significantly different between all pathological subtypes (P=0.034 and P<0.001, respectively, Table 5).
Discussion
FDCs are physiologically confined to the GC of lymphoid follicles and they were generally believed to be derived from mesenchymal stem cells in bone marrow [20-22]. FDCs are impor-tant antigen-presenting cells that stimulate the activation of “T helper cells” and “B effector cells” to mediate humoral immune responses [21, 22]. In addition, FDCs directly influence the selection, differentiation and proliferation of B cells [10, 15, 23].
The interaction of FDCs with GC-B cells were mediated by Fc fragment-binding proteins (CD23, CD32), complement receptors (CD21 and CD35) and binding factors (CD54, CD106 and CD44) that form an immune complex [23]. Due to the interaction between FDCs and B cells, the FDC meshwork in the GC could also be divided into a “light zone” and a “dark zone”. FDCs in the “light zone” primarily involved in presenting immune complexes and stimulating B cell-selective differentiation, which induce the B cells to produce a high-affinity immuno-globulin directed against the antigen presented
by FDCs. Therefore, in the FDC light zone, strong expression of Fc fragment-binding pro-teins (such as CD23 and CD32) and comple-ment receptors (CD21 and CD35) can be observed. The FDCs in the “dark zone” express CD21 and CD23 at low levels, and it was sug-gested that the main function of FDCs in the dark zone was not to present immune complex-es but rather to promote the selection and dif-ferentiation of B cells, which may be related to the stimulation of B cells [8, 15, 23].
[image:8.612.90.524.73.222.2]FDC meshwork can be detected in reactive and neoplastic lymphoid tissues [3, 6, 10], includ-ing certain types of presumed FDLs, including nodular lymphocyte predominant Hodgkin lym-phoma and several B cell lymphomas, such as FL, MCL, and MZL, as well as angioimmuno-blastic T cell lymphoma (AITL) [7, 9, 10]. The degree of proliferation and the distribution pat-tern of FDCs vary among these lymphomas based on IHC staining for FDC-related markers [7, 10, 15]. The most common distribution of FDC patterns in FL, MCL, MZL, and CLL/SLL in our study were type I, type III, type II, and type IV, respectively. This FDC patterns was repro-ducible and were consistent with by previous findings [10-12].
Our characteristic results were the systemic comparison between CD21 staining and CD23 staining, which revealed that in FL, the percent-age of samples displaying “strongly positive” staining and a “type I” pattern were
ly higher for CD21 than for CD23. According to the literature, CD23 antigen expression by FDCs is believed to decrease in FL [16], so when FDC pattern was applied as an imple-ment differentiating method for FL, CD21 stain-ing might be more helpful. Similar to AITL, FL induces FDC hyperplasia in a follicular pattern because of the activities of malignant B cells from the GC [15, 16], and FL was associated with a clear decrease in the intensity of CD23 staining. In contrast to the reactive GC, centro-cytes and centroblasts in FLs were randomly distributed, resulting in the loss of the “polari-ty” of the type I “follicular” meshwork.
In MCL, The staining intensity for CD23 by FDC meshwork was significantly stronger, and it might be more helpful in immunostaining for FDCs in the differential diagnosis. In MCL sam-ples, Type III (nodular meshwork with irregular margin) meshwork was often observed. The characteristic hyalinized vascular proliferation commonly detected may stimulate FDC hyper-plasia in MCL, although further study is needed to corroborate this hypothesis. In MZL, The staining intensity for FDC meshwork by CD23 staining was also significantly stronger, so it might be more helpful to utilize CD23 staining FDC pattern (contracted follicles with less evi-dent margin) in assisting MZL differential diag-nosis [11, 12, 24].
In CLL/SLL, the ROT for CD21 was significantly higher than for CD23, but the mean ROT were both <5%. The above results further support
the inhibition and atrophy of FDCs in CLL/SLL, this finding was consistent with recent report that CLL/SLL was not follicle-derived B cell, and this characteristic “absence” pattern could also be used for SBL differential diagnosis. Overall, there were sensitivity differences between CD21 and CD23 staining in FDCs in each type SBLs, however, no definitive advan-tage was identified. It seemed that CD21 was a more suitable marker of FDCs in FL, and CD23 appeared to be a more sensitive in MZL and MCL. The decrease in expression of CD21/ CD23 might be similar to the function of FDCs in the dark area of the GC, which might involve the stimulation of malignant B cell proliferation [23].
The differential diagnostic value of FDC pat-terns in SBL subtypes would also be confirmed by analysis of more cases and by further inves-tigations, in the hope of our previous conclu-sions would be enriched. The ROT and the staining intensity of FDC markers maybe useful as new indices in a helpful way in differential diagnosis of SBL subtypes, especially when other key makers on tumors were atypical or ambiguous.
[image:9.612.91.521.109.241.2]For both CD21 and CD23 staining, the graded ROT of FDCs significantly decreased in the fol-lowing sequence: FL>MZL>MCL>CLL/SLL. In FL, FDC hyperplasia was most evident and the tumor cells were most closely associated with the follicles. In CLL/SLL, the proliferation of Table 5. Comparison of the expression of CD21 and CD23 on SBL tumor cells and their relationships with histopathologic types (confirmed by CD21/PAX5 and CD23/PAX5 double immunohistochemical staining)
Expression in tumor cells CD21 P-value
CD23 total
positive rate Negative (No.) Positive (No.)
CD21 Total positive rate CD23 FL (n=32) 34.4% Negative (No.) 17 (53.1%) 4 (12.5%) 28.1% 0.115
Positive (No.) 6 (18.8%) 5 (15.6%)
MCL (n=23) 21.7% Negative (No.) 7 (30.4%) 11 (47.8%) 60.9% 0.964 Positive (No.) 2 (8.7%) 3 (13.0%)
MZL (n=28) 28.6% Negative (No.) 1 (3.6%) 10 (35.7%) 60.7% 0.066 Positive (No.) 1 (3.6%) 7 (25.0%)
CLL/SLL (n=20) 95% Negative (No.) 1 (5.0%) 0 55.0% 0.257 Positive (No.) 8 (40.0%) 11 (55.0%)
FDCs was suppressed or even lost, and these results confirmed that CLL/SLL is generally not a form of FDL [9].
The percentage of samples displaying strongly positive for CD21 labeling in FDCs significantly differed in the following order: FL>MZL>MCL> CLL/SLL; but for CD23, the order was MZL> MCL>FL>CLL/SLL. This discrepancy may be related to differences in the levels of CD21 and CD23 expression between the SBL subtypes. Moreover, these results confirmed that CD21 for FDCs was much more sensitive in the FL group (ROT and staining intensity).
Although due to variant histologic patterns as stated in results part 1, the utility in quantifying ROT metric or staining intensity of the me- shwork alone seemed not really helpful in diag-nosis of small B-cell lymphomas, and it would be much better to make the diagnosis of a lym-phoma with FDC meshwork pattern based on other specific tumor makers into making a diagnosis.
It was reported that both CD21 and CD23 can also be expressed in mature B cells and mature B cell lymphomas [6, 14], and CD23 expression in CLL/SLL has been used as an important diagnostic tumoral indicator [3, 13]. D-IHC staining for CD21/PAX5 and CD23/PAX5 were successfully performed to confirm and syste- mically study the CD21 and CD23 expression in SBL tumor cells. The frequency of positive CD21 expression in tumor specimens in each pathological SBL subtype was as follows: MCL> MZL>CLL/SLL>FL; for CD23 expression, this order was CLL/SLL>FL>MZL>MCL. Significant differences in the expression of CD21 and CD23 were observed among these histological SBL subtypes. However, only CD23 expression frequency in CLL/SLL was obviously higher (>90%) as reported recently [3, 17], the CD23 positivity frequency was 21-34% in the other SBL tumor types. The frequency of CD21 expression in FL (approximately 28%) was much lower than the other types (ranged from 50 to 61%).
The finding that the FDC markers CD21 and CD23 can be expressed in all types of SBL tumor cells is important, which could avoid mis-takenly assuming that a tumor cell was non-specifically stained or that the antibodies were non-specific and may avoid the confusion of
tumor-associated FDC marker expression with FDC cell proliferation, leading to misdiagnosis. In addition, more than two-thirds of FL tumor cells do not express CD21, and FL tumors often proliferate mainly in the central of neoplastic follicles. This occupying effect made the FDC patterns appear loosely arranged, partially explaining the common phenomenon of “cen-tral destruction” as we had observed in FDC immunostaining via CD21 antibodies [12]. Conclusion
The most common distribution patterns of FDC patterns in our groups for FL, MCL MZL and CLL/SLL were type I, type III, type II and type IV, respectively. Our characteristic findings were: differences existed between CD21 and CD23 labeling of FDC pattern in all four SBL types. CD21 is likely to be more suitable for marking FDC in FL, but CD23 might be more sensitive for meshwork staining in MCL and MZL. CD21 and CD23 can be expressed in tumor cells of all SBL subtypes with significant difference among each type. The expression of CD21 in FL tumor cells was especially low, and the expression of CD23 in CLL/SLL tumor cells was extraordinari-ly high. The results of this study would provide supplementary information on using FDC pat-terns as one of the SBL differential diagnosis tools. However, further investigation of FDCs on its latent mechanism in promoting SBL and its prognostic role would still be needed.
Acknowledgements
This work was supported by the funding of the Beijing Cancer Hospital (approval#: 2014-22).
Disclosure of conflict of interest
None.
Address correspondence to: Xianghong Li, Depart- ment of Pathology, Peking University Cancer Hos- pital, 52 Fucheng Road, Haidian district, Beijing 100142, China. Tel: +86-136-6111-1894; E-mail: [email protected]
References
[2] Coelho Siqueira SA, Ferreira Alves VA, Beitler B, Otta MM and Nascimento Saldiva PH. Con-tribution of immunohistochemistry to small B-cell lymphoma classification. Appl Immunohis-tochem Mol Morphol 2006; 14: 1-6.
[3] Swerdlow SH, Campo E, Harris NL, et al. WHO classification of tumours of haematopoietic and lymphoid tissues. 4th edition. Lyon, France: IARC press; 2008. pp. 180-232. [4] Vose JM. Mantle cell lymphoma: 2015 update
on diagnosis, risk-stratification, and clinical management. Am J Hematol 2015; 90: 739-745.
[5] Menter T, Dirnhofer S and Tzankov A. LEF1: a highly specific marker for the diagnosis of chronic lymphocytic B cell leukaemia/small lymphocytic B cell lymphoma. J Clin Pathol 2015; 68: 473-478.
[6] Bagdi E, Krenacs L, Krenacs T, Miller K and Isaacson PG. Follicular dendritic cells in reac-tive and neoplastic lymphoid tissues: a reeval-uation of staining patterns of CD21, CD23, and CD35 antibodies in paraffin sections after wet heat-induced epitope retrieval. Appl Immuno-histochem Mol Morphol 2001; 9: 117-124. [7] Carbone A and Gloghini A. Follicular dendritic
cell pattern in early lymphomas involving folli-cles. Adv Anat Pathol 2014; 21: 260-269. [8] Carbone A, Gloghini A, Cabras A and Elia G.
The Germinal centre-derived lymphomas seen through their cellular microenvironment. Br J Haematol 2009; 145: 468-480.
[9] Carbone A, Gloghini A, Cabras A and Elia G. Dif-ferentiating germinal center-derived lympho-mas through their cellular microenvironment. Am J Hematol 2009; 84: 435-438.
[10] Rezk SA, Nathwani BN, Zhao X and Weiss LM. Follicular dendritic cells: origin, function, and different disease-associated patterns. Hum Pathol 2013; 44: 937-950.
[11] Fakan F, Boudova L and Skalova A. [Immuno-histochemical detection of follicular dendritic cells in the diagnosis of small B-cell lympho-mas]. Cesk Patol 2003; 39: 96-101.
[12] Shi YF and Li XH. [Immunohistochemical pat-terns of follicular dendritic cell meshwork and Ki-67 in small B-cell lymphomas]. Zhonghua Bing Li Xue Za Zhi 2013; 42: 222-226. [13] Carbone A, Pinto A, Gloghini A, Volpe R and
Za-gonel V. B-zone small lymphocytic lymphoma: a morphologic, immunophenotypic, and clini-cal study with comparison to “well-differentiat-ed” lymphocytic disorders. Hum Pathol 1992; 23: 438-448.
[14] Schlette E, Fu K and Medeiros LJ. CD23 ex-pression in mantle cell lymphoma: clinicopath-ologic features of 18 cases. Am J Clin Pathol 2003; 120: 760-766.
[15] Troxell ML, Schwartz EJ, van de Rijn M, Ross DT, Warnke RA, Higgins JP and Natkunam Y. Follicular dendritic cell immunohistochemical markers in angioimmunoblastic T-cell lympho-ma. Appl Immunohistochem Mol Morphol 2005; 13: 297-303.
[16] Jin MK, Hoster E, Dreyling M, Unterhalt M, Hid-demann W and Klapper W. Follicular dendritic cells in follicular lymphoma and types of non-Hodgkin lymphoma show reduced expression of CD23, CD35 and CD54 but no association with clinical outcome. Histopathology 2011; 58: 586-592.
[17] de Leon ED, Alkan S, Huang JC and Hsi ED. Usefulness of an immunohistochemical panel in paraffin-embedded tissues for the differen-tiation of B-cell non-Hodgkin’s lymphomas of small lymphocytes. Mod Pathol 1998; 11: 1046-1051.
[18] Khalifa MA, Montgomery EA, Ismiil N and Azu-mi N. What are the CD34+ cells in benign pe-ripheral nerve sheath tumors? Double immu-nostaining study of CD34 and S-100 protein. Am J Clin Pathol 2000; 114: 123-126. [19] Srinivasan M and Parwani AV. Diagnostic utility
of p63/P501S double sequential immunohis-tochemical staining in differentiating urothelial carcinoma from prostate carcinoma. Diagn Pathol 2011; 6: 67.
[20] Aguzzi A and Krautler NJ. Characterizing follic-ular dendritic cells: A progress report. Eur J Im-munol 2010; 40: 2134-2138.
[21] Burton GF, Conrad DH, Szakal AK and Tew JG. Follicular dendritic cells and B cell costimula-tion. J Immunol 1993; 150: 31-38.
[22] El Shikh MEM and Pitzalis C. Follicular dendrit-ic cells in health and disease. Front Immunol 2012; 3: 292.
[23] Park CS and Choi YS. How do follicular den-dritic cells interact intimately with B cells in the germinal centre? Immunology 2005; 114: 2-10.