Title: Functional developmental changes underlying response inhibition and error-detection processes
Authors: Wouter Braet, Katherine A. Johnson, Claire T. Tobin, Ruth Acheson, Mark A. Bellgrove, Ian H. Robertson, Hugh Garavan
PII: S0028-3932(09)00307-8
DOI: doi:10.1016/j.neuropsychologia.2009.07.018 Reference: NSY 3366
To appear in: Neuropsychologia
Received date: 30-10-2008 Revised date: 22-7-2009 Accepted date: 24-7-2009
Please cite this article as: Braet, W., Johnson, K. A., Tobin, C. T., Acheson, R., Bellgrove, M. A., Robertson, I. H., & Garavan, H., Functional developmental changes underlying response inhibition and error-detection processes,Neuropsychologia(2008), doi:10.1016/j.neuropsychologia.2009.07.018
Accepted Manuscript
12 3 4 5 6 7 8 9 10 11 12 13 14 15 16 17 18 19 20 21 22 23 24 25 26 27 28 29 30 31 32 33 34 35 36 37 38 39 40 41 42 43 44 45 46 47 48 49 50 51 52 53 54 55 56 57
Functional developmental changes underlying response inhibition and error-detection processes.
Wouter Braet, Katherine A. Johnson, Claire T. Tobin, Ruth Acheson, Mark A. Bellgrove, Ian H. Robertson, Hugh Garavan
School of Psychology and Trinity College Institute of Neuroscience, Trinity College Dublin, Dublin 2, Ireland
Running title: developmental changes underlying response inhibition
Keywords: response inhibition, fMRI, developmental, error awareness
Corresponding author: Wouter Braet
Laboratory of Experimental Psychology University of Leuven
Tiensestraat 102 B 3000 Leuven Belgium
Tel: +32 (0)16 32 59 57 Fax: +32 (0)16 32 60 99
Accepted Manuscript
23 4 5 6 7 8 9 10 11 12 13 14 15 16 17 18 19 20 21 22 23 24 25 26 27 28 29 30 31 32 33 34 35 36 37 38 39 40 41 42 43 44 45 46 47 48 49 50 51 52 53 54 55 56 57 58
Functional developmental changes underlying response inhibition and error-detection processes.
Wouter Braet¹*², Katherine A. Johnson¹, Claire T. Tobin¹, Ruth Acheson¹, Mark A. Bellgrove3, Ian H. Robertson¹, Hugh Garavan¹
¹ School of Psychology and Trinity College Institute of Neuroscience, Trinity College Dublin, Dublin, Ireland; ²Laboratory of Experimental Psychology, University of Leuven, Belgium;3The University of
Queensland, School of Psychology and Queensland Brain Institute, Brisbane, Australia *corresponding author: [email protected]
Abstract
Accepted Manuscript
23 4 5 6 7 8 9 10 11 12 13 14 15 16 17 18 19 20 21 22 23 24 25 26 27 28 29 30 31 32 33 34 35 36 37 38 39 40 41 42 43 44 45 46 47 48 49 50 51 52 53 54 55 56 57
Introduction
Response inhibition, or the ability to withhold a prepotent response, is a key aspect of executive functioning, allowing us to operate in complex situations with competing stimuli that demand our attention. The dynamic control of behaviour in these situations involves a number of distinct functions, including task-monitoring, error-detection and compensatory changes to behaviour after an error has been detected. Areas involved in these functions include a number of prefrontal regions such as the anterior cingulate cortex (ACC) and dorsolateral prefrontal cortex (DLPFC) (Dehaene et al., 1994; Garavan et al., 2002). Response inhibition may be one of the first executive functions to develop, with early forms of error monitoring, self-regulation of behaviour and response inhibition having been observed in children as young as 4 years old (Jones et al., 2003). Whereas some cognitive processes, such as attentional orienting, develop early and show little change between childhood and adulthood, the ongoing development of executive functions, such as response inhibition, differentiates childhood cognition from that of adulthood (Denckla, 1996). This development may occur in parallel with sequential maturation of the frontal lobes (including myelinisation, synaptic pruning and reorganisation, dendritic and axonal arborisation), which is not completed until early adulthood (Anderson et al., 2001; Gogtay et al., 2004).
Accepted Manuscript
23 4 5 6 7 8 9 10 11 12 13 14 15 16 17 18 19 20 21 22 23 24 25 26 27 28 29 30 31 32 33 34 35 36 37 38 39 40 41 42 43 44 45 46 47 48 49 50 51 52 53 54 55 56 57 58
Successful inhibition on the SART task elicits the classic No-Go N2/P3 complex which is a robust electrophysiological marker of inhibitory control. (O’Connell et al, 2008).
In an fMRI study of healthy adults (Fassbender et al., 2004), successful inhibitions on the SART increased activity in the right ventral frontal cortex, left DLPFC, the right inferior parietal lobe (IPL), as well as the left putamen, consistent with other studies showing a network of prefrontal and parietal regions involved in response inhibition (e.g. Garavan et al., 1999; Rubia et al, 2007; Stevens et al., 2007). For commission errors (responding to the No-Go stimulus), which may involve processes related to (late attempts at) response inhibition and error-detection, increased activation was observed in the anterior (ACC) and posterior cingulate (PCC) cortex, bilateral inferior frontal gyri (IFG) and insulae, and (predominantly left) inferior parietal regions.
Accepted Manuscript
23 4 5 6 7 8 9 10 11 12 13 14 15 16 17 18 19 20 21 22 23 24 25 26 27 28 29 30 31 32 33 34 35 36 37 38 39 40 41 42 43 44 45 46 47 48 49 50 51 52 53 54 55 56 57
and by Bunge and colleagues (2002) also have a strong spatial component, in addition to engaging processes related to response selection, as participants had to choose between different responses depending on the spatial configuration of the stimuli. The SART, however, only requires participants to make a single type of response to unambiguous and pre-specified Go stimuli (all digits bar “3;” see task description below) or to withhold this response and thus may avoid contamination from other cognitive processes (see also the paradigm used by Durston and colleagues (2002; 2006)).
The studies by Rubia and colleagues (2002; 2006) also differ in one other important aspect from the earlier work: whether or not the adult and adolescent groups performed tasks that were equated for difficulty in terms of stimulus properties (e.g., similar timings) or in terms of performance (e.g., by using an adaptive staircase mechanism that ensured performance at a criterion level). There are good arguments for using either method. The first, in which task properties are held constant, avoids confounding age/ability with differences in the objective difficulty-level of a task. The second method ensures that everyone performs at the same level of performance, thus avoiding confounding age/ability with processes secondary to performance such as error-related frustration. The choice of method may be consequential with one hypothesis being that equating task-difficulty may reveal greater levels of activation in young adolescents (on account of their poorer inhibitory abilities requiring more neural resources be deployed than are required by adults). On the other hand, equating performance levels may reveal greater levels of activation in adults (their superior inhibitory abilities may result in more neural resources being accessible for adults relative to those that are available for young adolescents). To disentangle the influence of ability and performance from inherent age-related differences, the present study employed a task at a set level of difficulty but also included a performance-matched analysis of a subset of adult and young adolescent participants
Accepted Manuscript
23 4 5 6 7 8 9 10 11 12 13 14 15 16 17 18 19 20 21 22 23 24 25 26 27 28 29 30 31 32 33 34 35 36 37 38 39 40 41 42 43 44 45 46 47 48 49 50 51 52 53 54 55 56 57 58
attentional operation1(Garavan et al, 2002). Rubia and colleagues (2007) found increased activation of rostral ACC for adults compared to children/adolescents in a design that matched performance between the two age-groups, and this has also been observed without performance matching (Velanova et al., 2008). To our knowledge the studies by Rubia and colleagues and by Velanova and colleagues are the only other developmental imaging studies to examine error activity during response inhibition. Accordingly, we predicted a similar pattern of activation differences between the adults and young adolescents in the current study.
MATERIAL AND METHODS Participants
Forty right-handed participants, 20 young adolescents (all males) in the age range 10-14 (mean age 12.4, SD 1.4) and 20 adults (15 male) in the age range 23-35 (mean age 26.8, SD 4) were involved in this study. A subset of this sample with matched performance was subsequently selected to assess the impact of performance on activation patterns. The subsample consisted of 12 young adolescents (all male, mean age 12.7, SD 1.3) and 12 adults (including three females, mean age 25.5, SD 3.5). To ensure that this gender imbalance in the full sample did not unduly affect the results, we also report analyses using only the data from male participants.
The study was approved by the local ethics committee in accordance with the Declaration of Helsinki. All participants were reported (by themselves and/or a parent) to be free of neurological and psychiatric disorders and head trauma, and gave written consent to participate (for the young adolescents, written consent was also given by a parent).
1 Activation changes during error trials may be related to other processes, including late attempts at
Accepted Manuscript
23 4 5 6 7 8 9 10 11 12 13 14 15 16 17 18 19 20 21 22 23 24 25 26 27 28 29 30 31 32 33 34 35 36 37 38 39 40 41 42 43 44 45 46 47 48 49 50 51 52 53 54 55 56 57
Sustained attention to response task (SART)
Participants performed the random SART, in which numbers from 1-9 are presented in a random (i.e. non-sequential) order. In each trial (see Figure 1) a single digit appeared on the screen for 313 ms; a mask was then presented for 125 ms, after which a response cue (a boldened cross) appeared for 63 ms, followed by a second mask for 375ms and a fixation cross for 563 ms. The total inter-stimulus interval was 1439 ms (digit onset to digit onset). Participants were instructed to respond, using a button press, to every digit (Go-trial) except ‘3’ (No-Go trial). They were asked to respond when the response cue appeared on screen 125 ms after the digit was extinguished, or 438 ms from the start of the trial. The response cue was used to limit unwanted performance differences in response variability. The task was presented using E-prime (Psychology Software Tools, Pittsburgh, USA), in a single block of 450 trials (of which 50 were No-Go-trials), which included two 30s breaks after 150 and 300 trials. The total duration of the task was approximately 12min.
---Figure 1
---MRI data acquisition
All scanning was conducted on a Philips Intera Achieva 3.0 Tesla MR system. Each scanning sequence began with a reference scan to resolve sensitivity variations. A parallel Sensitivity Encoding (SENSE) approach (Pruessmann et al., 1999) with a reduction factor of 2 was utilised for all T1-weighted image acquisitions. 180 high-resolution T1-weighted anatomic MPRAGE axial images (FOV 230 mm, thickness 0.9 mm, voxel size 0.9 × 0.9 × 0.9) were then acquired (total duration 325 s), to allow subsequent activation localization and spatial normalization.
Accepted Manuscript
23 4 5 6 7 8 9 10 11 12 13 14 15 16 17 18 19 20 21 22 23 24 25 26 27 28 29 30 31 32 33 34 35 36 37 38 39 40 41 42 43 44 45 46 47 48 49 50 51 52 53 54 55 56 57 58
entire brain (TE = 35 ms, TR = 2000 ms, FOV 224 mm, 64 × 64 mm matrix size in Fourier space). The functional scans had a total duration of 730 s.
fMRI analysis
The data were analysed using AFNI (Cox, 1996; http://afni.nimh.gov). Images were corrected for motion (using a least-squares alignment allowing translations and rotations), and activation outside the brain was removed. Separate impulse response functions (IRFs) were estimated2for successful inhibitions and commission errors using deconvolution techniques. Gamma-variate functions were fit, voxelwise, to these IRFs using a non-linear regression programme. A percentage signal-change score (%SC) was calculated by dividing the area under the curve of these functions by the area under the baseline which, in this case, reflects tonic ongoing processes involved in Go trial responses. Individual %SC maps were then spatially blurred using a 3mm rms isotropic Gaussian kernel, and transformed into MNI space using the MNI (Montréal Neurological Institute) 152-brain template.
For both commission errors and successful inhibitions, group activation maps were then determined using one-sample t-tests against 0 (i.e. against the null hypothesis of no change in activation compared with the baseline). Significant voxels passed a voxelwise statistical threshold (t(19)=3.88, p≤.001), and were required to be part of a cluster of significant voxels with a minimum volume of 141 μl. This minimum cluster-size was determined using Monte-Carlo simulations, with a probability of .05 (corrected) of a cluster surviving due to chance. Separate maps were generated for the adults and young adolescents, and these were subsequently combined into a single map which contained every voxel that survived thresholding in either of the two groups. These resulting maps (one for successful inhibitions, and one for commission errors) were then used as regions of interest (ROI) to extract mean activation values for each region for
2 Separate IRF functions were calculated for each participant, which reduces the effects of (limited)
Accepted Manuscript
23 4 5 6 7 8 9 10 11 12 13 14 15 16 17 18 19 20 21 22 23 24 25 26 27 28 29 30 31 32 33 34 35 36 37 38 39 40 41 42 43 44 45 46 47 48 49 50 51 52 53 54 55 56 57
every participant. These data were used for independent group t-tests. The subsample of performance-matched participants was investigated using these same ROIs.
In addition to this, we also performed a direct voxelwise comparison between the two groups (using the same ROIs that were identified for successful inhibitions and for commission errors), to rule out a potential confound between activation amplitude and activation extent. Within these regions, significant voxels passed a voxelwise statistical threshold (t(38)=3.57, p≤.001). Minimum cluster size (to control for multiple comparisons, with a probability of .05 of a cluster surviving due to chance) was 73 μl for successful inhibitions, and 69 μl for commission errors. The resulting clusters identify subregions of the ROIs that differ only in activation amplitude, between the adults and the young adolescents.
Analysis of behavioural data
Accepted Manuscript
23 4 5 6 7 8 9 10 11 12 13 14 15 16 17 18 19 20 21 22 23 24 25 26 27 28 29 30 31 32 33 34 35 36 37 38 39 40 41 42 43 44 45 46 47 48 49 50 51 52 53 54 55 56 57 58
RESULTS
Behavioural performance
Adults made significantly fewer errors of omission (t(38)=2.25, p=.03) and significantly fewer errors of commission (t(38)=3.74, p=.001) compared with young adolescents (see Figure 2). There was no significant difference in RTs between the adults and young adolescents on Go trials (t(38)=.81, p=.42) or on commission errors (t(38)=0.75, p=.46). Both adults and young adolescents had faster RTs when making commission errors compared with RTs on Go-trials (t(19)=7.08, p<.001; and t(19)=5.88, p<.001, respectively). Young adolescents showed higher ICVs on Go-trials compared to adults (t(38)=2.84, p=.007). Response variability correlated with the number of omission errors for young adolescents (r=.66, p=.002) but not for adults (r=.36, p=.119), and correlated with the number of commission errors for both young adolescents (r=.79, p<.001) and adults (r=.53, p=.016).
---Figure 2
---fMRI analysis: successful inhibitions
---Accepted Manuscript
23 4 5 6 7 8 9 10 11 12 13 14 15 16 17 18 19 20 21 22 23 24 25 26 27 28 29 30 31 32 33 34 35 36 37 38 39 40 41 42 43 44 45 46 47 48 49 50 51 52 53 54 55 56 57
Table 1 lists the areas that showed significant activity when participants successfully inhibited their response on No-Go trials. Seventeen3 of these 23 regions showed significant differences between the two groups, with young adolescents demonstrating higher activation in the right (p=.016) and left (p=.023) middle frontal gyri, right (p<.001) and left (p<.001) inferior frontal gyri, left posterior superior frontal gyrus (p<.001), right (p=.01) and left (p=.007) inferior parietal cortex, right (p=.007) and left (p=.026) cunei, right middle temporal gyrus (p=.026), bilateral anterior (p<.001) and posterior (p=.003) cingulates, right (p=.011) and left (p=.002) insulae, left lentiform nucleus (p=.001) and left caudate (p=.018). Adults showed a significantly larger increase in only one region, the anterior part of the left superior frontal gyrus (p=.001; See Figure 3).
Nine of these regions contained clusters that showed significant voxelwise differences in activation amplitude, between the adults and the young adolescents: young adolescents demonstrated higher activation amplitude in the left middle frontal gyrus, right inferior frontal gyrus, right inferior parietal cortex, right cuneus, right middle temporal gyrus, bilateral ACC and PCC, and left insula; adults showed higher activation amplitude in the anterior part of the left superior frontal gyrus (all p<.001). In the remaining eight regions which showed activation differences for the region but no significant clusters of voxelwise differences, group effects may be driven by differences in activation extent (i.e. the young adolescents activating more voxels in the ROI, but with a similar amplitude as was observed for adults). It should however be noted that this is a tentative conclusion given that activation and amplitude and activation extent become confounded when one spatially blurs data to enable group averages and group comparisons.
The adults showed a significant correlation between ICV-scores and activation in the medial region of the left superior frontal gyrus (r=.47, p=.035), while in young adolescents ICV-scores correlated positively with activation in the left lentiform nucleus
3If male participants only are compared (to avoid gender-bias), activation differences in the right insula
Accepted Manuscript
23 4 5 6 7 8 9 10 11 12 13 14 15 16 17 18 19 20 21 22 23 24 25 26 27 28 29 30 31 32 33 34 35 36 37 38 39 40 41 42 43 44 45 46 47 48 49 50 51 52 53 54 55 56 57 58
(r=.52, p=.02) and negatively with (the anterior region of) the left superior frontal gyrus (r=-.55, p=.012)
---Figure 3
---fMRI analysis: commission errors
---Table 2
---Table 2 lists the areas of significant activation when participants made commissions errors (also see Figure 4). Of these 22 regions, nine4 showed a significant difference between the adults and the young adolescents, with adults showing higher activation than young adolescents for all. This pattern was observed in the bilateral cerebellar culmen (p<.001), right parahippocampal gyrus (p=.006), the right lingual gyrus and two regions in the left lingual gyrus (all p<.001), the left insula (p=.016), the right claustrum (p<.001), and also in the right caudate (p=.016) and fusiform gyrus (p=.002).
Of these regions, six contained clusters of voxels that showed a significant difference in activation amplitude: the right and left insulae, bilateral culmen, right claustrum, left lingual gyrus, as well as the right fusiform gyrus (all p<.001). In all these regions, activation amplitude was higher for the adults, compared to the young adolescents.
4If we only compare the male participants (to avoid gender-bias), the activation difference in the right
Accepted Manuscript
23 4 5 6 7 8 9 10 11 12 13 14 15 16 17 18 19 20 21 22 23 24 25 26 27 28 29 30 31 32 33 34 35 36 37 38 39 40 41 42 43 44 45 46 47 48 49 50 51 52 53 54 55 56 57
Young adolescents showed significant negative correlations between response variability (ICV-scores) and %SC with a number of regions, including right (r=-.46, p=.039) and left (r=-.46, p=.042) insulae, right (r=-.46, p=.039) and left (r=-.48, p=.031) parietal cortices, right superior frontal gyrus .47, p=.036), and right precuneus (r=-.46, p=.042). A positive correlation was observed in the right claustrum (r=.45, p=.048). There were no significant correlations between ICV-scores and activation measures for the adults.
---Figure 4
---Performance-matched subsample
Behavioural performance
The subsample was selected by excluding the adults whose number of commission errors was lower than one S.E.M. below the mean number of errors, and a corresponding number of young adolescents who made the most commission errors. In the subsample, there were no significant differences between the young adolescents and adults on any of the performance variables, except young adolescents showed slower RTs when making errors on the No-Go-trials (t(22)=2.7, p<.001) and a trend for slower RTs on Go-trials (t(22)=1.8, p=.086) (all other t-values ≤.14) (See Figure 5). We observed no significant correlations between performance-measures in either the young adolescents or the adults of the subsample.
---Figure 5
---Accepted Manuscript
23 4 5 6 7 8 9 10 11 12 13 14 15 16 17 18 19 20 21 22 23 24 25 26 27 28 29 30 31 32 33 34 35 36 37 38 39 40 41 42 43 44 45 46 47 48 49 50 51 52 53 54 55 56 57 58
fMRI-analysis & functional correlations: successful inhibitions
In the subsample matched for performance, young adolescents had significantly greater activation compared to adults in eleven regions: right (p=.005) and left (p=.007) inferior frontal gyri, posterior left superior frontal gyrus (p=.005), left inferior parietal cortex (p=.028), right (p=.015) and left (p=.025) cunei, right (p=.022), and left (p=.043) insulae, left lentiform nucleus (p=.004), as well as in the ACC (p=.015) and PCC (p=.045). Activation in the anterior part of the left superior frontal gyrus, the left and right middle superior gyri, the right inferior parietal cortex, and the right middle temporal gyrus no longer differed reliably.
ICV scores correlated with activation during successful inhibitions in the (anterior part of the) left superior frontal gyrus (r=.69, p=.013) for adults, though there were no longer reliable correlations with activation scores for the young adolescents.
fMRI-analysis & functional correlations: commission errors
In the sample matched for performance, adults showed a greater increase in activation in bilateral culmen (p=.006), two regions on the left lingual gyrus (p<.001 and p=.011), and the right claustrum (p=.008). There were no longer significant differences in the left insula, right caudate, right parahippocampal gyrus, right fusiform gyrus, or the right lingual gyrus.
Young adolescents showed negative correlations between ICV-scores and activation changes in the left middle (r=-.61, p=.036) and superior (r=-.62, p=.033) frontal gyri, while no significant correlations with ICV scores were seen in the adults
DISCUSSION
Accepted Manuscript
23 4 5 6 7 8 9 10 11 12 13 14 15 16 17 18 19 20 21 22 23 24 25 26 27 28 29 30 31 32 33 34 35 36 37 38 39 40 41 42 43 44 45 46 47 48 49 50 51 52 53 54 55 56 57
Sweeney, 2004) (Clark et al., 2006; Lin, Hsiao & Chen, 1999; though also see Karatekin, Marcus & Couperus, 2007). Greater response variability has been previously identified in clinical groups with frontal (Stuss et al., 2003) and fronto-striatal and fronto-parietal brain pathology (e.g. ADHD, see Castellanos et al., 2005; Johnson et al., 2007b), In the current sample the greater response variability for young adolescents likely reflects that these frontal regions are not yet fully matured. This is also consistent with the young adolescents showing negative correlations between response variability and activation changes in most regions, suggesting that lower variability is associated with more ‘adult-like’ activations (during commission errors, as well as in the superior frontal gyrus during successful inhibitions).
Accepted Manuscript
23 4 5 6 7 8 9 10 11 12 13 14 15 16 17 18 19 20 21 22 23 24 25 26 27 28 29 30 31 32 33 34 35 36 37 38 39 40 41 42 43 44 45 46 47 48 49 50 51 52 53 54 55 56 57 58
number of error trials (rather than any other variable, such as response times or ICV-scores) aimed to investigate the possibility that inconsistent results from prior studies (with some showing increased activation for children or adolescents compared to adults, and other studies showing the opposite) might have been related to whether or not these studies used matched performance in terms of commission errors. While it would be very informative to investigate the relative effects of differences in error-rates, response latencies and variability, on the activation patterns that underlie response inhibition and error-monitoring, this inquiry exceeds the aims of the present study.
This pattern of results is consistent with earlier findings (Booth et al., 2003; Casey et al., 1997; Durston et al., 2002), but opposite to the findings of Rubia and colleagues (2006; 2007), which may be due, in part, to the latter studies using paradigms that also engage response selection and spatial judgement, in addition to response inhibition. This is suggested by a clear dichotomy in the nature of the tasks that were used in prior studies: those that found increased activation for younger, compared to older participants, used go/nogo tasks to probe response inhibition (Booth et al., 2003; Casey et al., 1997; Durston et al., 2002; 2006; this paper; also see Tamm, Menon & Reiss, 2002). On the other hand, those studies that found the opposite pattern, i.e. higher activation for adults, employed tasks that required spatial discrimination (Bunge et al., 2002; Rubia et al., 2006; 2007).
In line with longitudinal findings (Durston et al., 2006) showing a progression from diffuse to more focal activation patterns, there was only one region that showed higher activation in the adults (the anterior part of the left superior frontal gyrus in our study). This supports the notion that with development of the frontoparietal network underlying response inhibition, activation in non-critical areas is attenuated in favour of key areas, and may represent emerging cortical specialisation (see Durston et al., 2006; Kelly & Garavan, 2005; Ungerleider, Doyon, & Karni, 2002).
Accepted Manuscript
23 4 5 6 7 8 9 10 11 12 13 14 15 16 17 18 19 20 21 22 23 24 25 26 27 28 29 30 31 32 33 34 35 36 37 38 39 40 41 42 43 44 45 46 47 48 49 50 51 52 53 54 55 56 57
cerebellar regions including the right caudate and bilateral culmen. When comparing adults and young adolescents with equal performance, this pattern of activation was still observed in the right claustrum, left lingual gyrus, and bilateral culmen. These results, showing an opposite pattern to the relative hyperactivity of the adolescents for successful inhibitions, argue against a non-specific cognitive or vascular basis for the observed age-related changes. They suggest that the relative immaturity of the young adolescent brain translates to a diminished response for errors and requiring greater levels of activity when successfully inhibiting. Indeed, it is possible that the blunted performance monitoring of the young adolescents, as echoed in their diminished error-related response and heightened response variability, may underlie the greater effort (more diffuse activation) when successfully inhibiting. Cerebellar activation has been previously shown in adults as well as adolescents during inhibitory control in Go/No-Go tasks (e.g. Garavan et al., 2003; Rubia et al., 2007), and this region projects to both motor and prefrontal areas through the thalamus (Kim et al., 1994; Middleton & Strick, 2000). Activation of the insula has been previously observed in adults during failed attempts to inhibit and, indeed, may be a key neuroanatomical substrate subserving error detection (Magno, Foxe, Molholm, Robertson & Garavan, 2006; Ramautar, Slagter, Kok & Ridderinkhof, 2006). Parahippocampal activity may reflect similar processes, as this region has been implicated in anxiety and arousal (Gray & McNaughton, 2000; also see Green & Arduini, 1954) and memory (e.g. Fernandez et al., 1998; also see Jansma et al., 2004). Thus, adults may be better at inhibiting the prepotent response when an unexpected target appears because when they make an error, they have a stronger arousal-mediated response which may engage additional top-down attentional control processes to prevent or limit subsequent inhibitory failures (Hester, Barre, Murphy, Silk & Mattingley, 2008).
Accepted Manuscript
23 4 5 6 7 8 9 10 11 12 13 14 15 16 17 18 19 20 21 22 23 24 25 26 27 28 29 30 31 32 33 34 35 36 37 38 39 40 41 42 43 44 45 46 47 48 49 50 51 52 53 54 55 56 57 58
young adolescents in our study, while adults might benefit less from the cue if their performance is closer to ceiling. Given evidence that the ACC monitors response conflict (Carter et al., 1998) and/or error likelihood (Brown & Braver, 2005), the presence of the response cue may therefore reduce between-group differences in activation in this structure. Additionally, there is some evidence that differences in ACC activation during nogo trials, between adults and adolescents, may strongly depend on the specific age-groups that are compared. For example, Jonkman, Sniedt and Kemner (2007; also see Jonkman, 2006) compared younger (6-7 years) and older (9-10 years) children to young adults (19-23 years) using a cued go/nogo task. They observed differences in ACC involvement, both in terms of an increased nogo N2 ERP response, as well as a reduced Contingent Negative Variation (CNV) effect related to cueing, but only when comparing the youngest group to both older children and adults, while these measures did not differ between the 9-10-year olds and adults. Similarly, at least one other fMRI-study (Stevens, Kiehl, Pearlson & Calhoun, 2009) failed to find age-related differences (in the age-range 11-37) in an error-related network including the ACC, which the authors suggested might indicate that these regions are already relatively mature in adolescence.
CONCLUSIONS
In summary, previous research suggests that progressive maturation of the developing brain, and especially (pre)frontal regions which mature relatively late compared with more posterior brain regions, leads to shifts in the specific neural networks that underlie executive functions, including response inhibition. There is, however, less agreement on the direction of these differences, with different studies either showing increased or decreased activation of these regions, for children/adolescents compared with adults. We propose that a significant underlying factor for these divergent findings may be differences in the specific paradigms used, particularly with regards to whether the task taps into processes related to spatial attention, in addition to response inhibition.
Accepted Manuscript
23 4 5 6 7 8 9 10 11 12 13 14 15 16 17 18 19 20 21 22 23 24 25 26 27 28 29 30 31 32 33 34 35 36 37 38 39 40 41 42 43 44 45 46 47 48 49 50 51 52 53 54 55 56 57
from more diffuse activation patterns in young adolescents, to more focal prefrontal activation in adults, with reduced reliance on other regions. Even when the two groups were matched for performance, young adolescents showed increased activation during successful inhibitions in frontal, parietal and medial regions. This suggests that the reliance of young adolescents on a more diffuse network cannot solely be attributed to differences in performance. Additionally, the present data suggest an important role for the integrated function of cerebellar, striatal and (para)hippocampal regions in modulating executive control under circumstances when inhibition has failed and greater control must be exerted.
Acknowledgements
This study was supported by grants from the Science Foundation Ireland, the Irish Health Research Board, the Irish Higher Education Authority's Programme for Research in Third-Level Institutions, the Australian National Health and Medical Research Council Howard Florey Centenary Fellowship, and the FWO Research Foundation - Flanders. The authors would like to thank all participants, as well as the parents of the adolescents who took part in the study.
References:
Anderson, V., Anderson, P., Northam, E., Jacobs, R., & Catroppa, C. (2001). Development of executive functions through late childhood and adolescence in an Australian sample. Developmental Neuropsychology, 20, 385–406.
Bellgrove, M. A., Hester, R., & Garavan, H. (2004). The functional neuroanatomical correlates of response variability: Evidence from a response inhibition task. Neuropsychologia, 42 (14), 1910-1916.
Booth, J. R., Burman, D. D., Meyer, J. R., Lei, Z., Trommer, B. L., Davenport, N. D., Li, W., Parrish, T. B., Gitelman, D. R., & Mesulam, M. M. (2003). Neural development of selective attention and response inhibition.Neuroimage, 20, 737-751.
Accepted Manuscript
23 4 5 6 7 8 9 10 11 12 13 14 15 16 17 18 19 20 21 22 23 24 25 26 27 28 29 30 31 32 33 34 35 36 37 38 39 40 41 42 43 44 45 46 47 48 49 50 51 52 53 54 55 56 57 58
Bunge, S. A., Dudukovic, N. M., Thomason, M. E., Vaidya, C. J., & Gabrieli, J. D. E. (2002). Immature frontal lobe contributions to cognitive control in children: evidence from fMRI. Neuron, 33, 301-311.
Carter, C. S., Braver, T. S., Barch, D. M., Botvinick, M. M., Noll, D., & Cohen, J. D. (1998). Anterior cingulate cortex, error detection, and the online monitoring of performance. Science, 280, 747-749.
Casey, B. J., Trainor, R. J., Orendi, J. L., Schubert, A. B., Nystrom, L. E., Giedd, J. N., Castellanos, F. X., Haxby, J. V., Noll, D. C., & Cohen, J. D. (1997). A developmental functional MRI study of prefrontal activation during performance of a Go-No-Go task. Journal of Cognitive Neuroscience, 9, 835-847.
Castellanos, F. X., Sonuga-Barke, E. J., Scheres, A., Di Martino, A., Hyde, C., & Walters J. R. (2005). Varieties of attention-deficit/hyperactivity disorder-related intra-individual variability. Biological Psychiatry,57 (11), 1416-1423.
Chan, R. C., Chen, E. Y., Cheung, E. F., Chen, R. Y., & Cheung, H. K. (2004). A study of sensitivity of the sustained attention to response task in patients with schizophrenia. The Clinical Neuropsychologist, 18 (1), 114-121.
Clark, C. R., Paul, R. H., William, L. M., Arns, M., Fallahpour, K., Handmer, C., & Gordon, E. (2006). Standardized assessment of cognitive functioning during development and aging using an automated touchscreen battery. Archives of Clinical Neuropsychology, 21 (5), 449-467.
Cox, R. W. (1996) AFNI: software for analysis and visualization of functional magnetic resonance neuroimages. Computers and Biomedical Research, 29, 162-173.
Cragg, L., & Nation, K. (2008). Go or no-go? Developmental improvements in the efficiency of response inhibition in mid-childhood. Developmental Science, 11 (6), 819-827.
Daniel, D. B., Pelotte, M., & Lewis, J. (2000). Lack of sex differences on the stroop color-word test across three age groups. Perceptual and Motor Skills, 90, 483-484.
Accepted Manuscript
23 4 5 6 7 8 9 10 11 12 13 14 15 16 17 18 19 20 21 22 23 24 25 26 27 28 29 30 31 32 33 34 35 36 37 38 39 40 41 42 43 44 45 46 47 48 49 50 51 52 53 54 55 56 57
Denckla, M. B. (1996). A theory and model of executive function: A neuropsychological perspective. In G. Lyon, & N. Krasnegor (Eds.) Attention, memory and executive function. Maryland: Paul Brooks.
Durston, S., Thomas, K. M., Yang, Y. H., Uluğ, A. M., Zimmerman, R. D., & Casey, B. J. (2002). A neural basis for the development of inhibitory control. Developmental Science, 5, F9-F16.
Durston, S., Davidson, M. C., Tottenham, N., Galvan, A., Spicer, J., Fossella, J. A., & Casey, B. J. (2006). A shift from diffuse to focal cortical activity with development. Developmental Science, 9, 1-8.
Fassbender, C., Murphy, K., Foxe, J. J., Wylie, G. R., Javitt, D. C., Robertson, I. H., & Garavan, H. (2004). A topography of executive functions and their interactions revealed by functional magnetic resonance imaging. Cognitive Brain Research, 20, 132-143. Fernández, G., Weyerts, H., Schrader-Bölsche, M., Tendolkar, I., Smid, H. G., Tempelmann, C., Hinrichs, H., Scheich, H., Elger, C. E., Mangun, G. R., & Heinze, H. J. (1998). Successful verbal encoding into episodic memory engages the posterior hippocampus: a parametrically analyzed functional magnetic resonance imaging study. Journal of Neuroscience, 18 (5), 1841-1847.
Fronczek, R., Middelkoop, H. A., van Dijk, J. G., & Lammers, G. J. (2006). Focusing on vigilance instead of sleepiness in the assessment of narcolepsy: high sensitivity of the Sustained Attention to Response Task (SART).Sleep, 29, 187-191.
Garavan, H., Ross, T. J., & Stein, E. A. (1999). Right hemispheric dominance of inhibitory control: an event-related functional MRI study. Proceedings of the national academy of sciences of the United States of America, 96, 8301– 8306.
Garavan, H., Ross, T. J. Murphy, K., Roche, R. A. P., & Stein, E. A. (2002). Dissociable executive functions in the dynamic control of behavior: Inhibition, error detection, and correction. Neuroimage, 17, 1820-1829.
Accepted Manuscript
23 4 5 6 7 8 9 10 11 12 13 14 15 16 17 18 19 20 21 22 23 24 25 26 27 28 29 30 31 32 33 34 35 36 37 38 39 40 41 42 43 44 45 46 47 48 49 50 51 52 53 54 55 56 57 58
Gogtay, N., Giedd, J. N., Lusk, L., Hayashi, K. M., Greenstein, D., Vaituzis, A. C., Nugent, T. F. 3rd, Herman, D. H., Clasen, L. S., Toga, A. W., Rapoport, J. L., & Thompson, P. M. (2004). Dynamic mapping of human cortical development during childhood through early adulthood. Proceedings of the national academy of sciences of the United States of America, 101-8174-8179.
Gray, J. A., & McNaughton, N. (2000). The Neuropsychology of Anxiety: An Enquiry into the Functions of the Septo-Hippocampal System. Oxford University Press.
Green, J. D. & Arduini, A. A. (1954). Hippocampal electrical activity in arousal. Journal of Neurophysiology, 17, 533-557.
Hester, R., Barre, N., Murphy, K., Silk, T. J., & Mattingley, J. B. (2008). Human medial frontal cortex activity predicts learning from errors.Cerebral Cortex, 18, 1933-1940. Jansma, J. M., Ramsey, N. F., van der Wee, N. J., & Kahn, R. S. (2004). Working memory capacity in schizophrenia: a parametric fMRI study. Schizophrenia Research, 68 (2-3), 159-171.
Johnson, K. A., Robertson, I. H., Kelly, S. P., Silk, T. J., Barry, E., Dáibhis, A., Watchorn, A., Keavey, M., Fitzgerald, M., Gallagher, L., Gill, M., & Bellgrove, M. A. (2007a). Dissociation in performance of children with ADHD and high-functioning autism on a task of sustained attention. Neuropsychologia, 45(10), 2234-2245.
Johnson, K. A., Kelly, S. P., Robertson, I. H., Barry, E., Mulligan, A., Daly, M., Lambert, D., McDonnell, C., Connor, T. J., Hawi, Z., Gill, M., & Bellgrove, M.A. (2007b). Absence of the 7-repeat variant of the DRD4 VNTR is associated with drifting sustained attention in children with ADHD but not in controls. American Journal of Medical Genetics part B: Neuropsychiatric Genetics, DOI: 10.1002/ajmg.b.30718
Jones, L. B., Rothbart, M. K., & Posner, M. I. (2003). Development of executive attention in preschool children. Developmental Science, 6, 498-504.
Jonkman, L. M. (2006). The development of preparation, conflict monitoring and inhibition from early childhood to young adulthood; a go/nogo ERP study. Brain Research, 1097, 181-193.
Accepted Manuscript
23 4 5 6 7 8 9 10 11 12 13 14 15 16 17 18 19 20 21 22 23 24 25 26 27 28 29 30 31 32 33 34 35 36 37 38 39 40 41 42 43 44 45 46 47 48 49 50 51 52 53 54 55 56 57
Karatekin, C., Marcus, D. J., & Couperus, J. W. (2007). Regulation of cognitive resources during sustained attention and working memory in 10-year-olds and adults. Psychophysiology, 44(1), 128-144.
Kelly, C. & Garavan, H. (2005). Human functional neuroimaging of brain changes associated with practice. Cerebral Cortex, 15, 1089-1102 .
Kim, S. G., Ugurbil, K., & Strick, P. L. (1994). Activation of a cerebellar output nucleus during cognitive processing. Science, 265, 949-951.
Lin, C. C. H., Hsiao, C. K., & Chen, W. J. (1999). Development of sustained attention assessed using the continuous performance test among children 6-15 years of age. Journal of abnormal child psychology, 27 (5), 403-412.
Logan, G. D., & Cowan, W. B. (1984). On the ability to inhibit though and action: a theory of an act of control. Psychological Review, 91, 295-327.
Luna, B, Garver, K. E., Urban, T. A., Lazar, N. A., & Sweeney, J. A. (2004). Maturation of cognitive processes from late childhood to adulthood. Child Development, 75 (5), 1357-1372.
Magno, E., Foxe, J.J., Molholm, S., Robertson, I., & Garavan, H. (2006). The Anterior Cingulate and Error Avoidance. The Journal of Neuroscience,26, 4769-4773.
McAvinue, L., O'Keeffe, F., McMackin, D., & Robertson, I. H. (2005). Impaired sustained attention and error awareness in traumatic brain injury: implications for insight. Neuropsychological Rehabilitation, 15(5), 569-587.
Middleton, F., A., & Strick, P. L. (2000). Basal ganglia and cerebellar loops: motor and cognitive circuits. Brain Research Reviews, 31, 236-250.
Murphy, K., & Garavan, H. (2004). An empirical investigation into the number of subjects required for an event-related fMRI study. Neuroimage, 22, 879-885.
Accepted Manuscript
23 4 5 6 7 8 9 10 11 12 13 14 15 16 17 18 19 20 21 22 23 24 25 26 27 28 29 30 31 32 33 34 35 36 37 38 39 40 41 42 43 44 45 46 47 48 49 50 51 52 53 54 55 56 57 58
Ramautar, J. R., Slagter, H. A., Kok, A., & Ridderinkhof, K. R. (2006). Probability effects in the stop-signal paradigm: the insula and the significance of failed inhibition. Brain Research, 1105 (1), 143-154.
Robertson, I.H., Manly, T., Andrade, J., Baddeley, B.T., & Yiend, J. (1997). ‘Oops!’: Performance correlates of everyday attentional failures in traumatic brain injured and normal subjects.Neuropsychologia, 35, 747–758.
Rubia, K., Smith, A. B., Wooley, J., Nosarti, C., Heyman, I., Taylor, E., & Brammer, M. (2006). Progressive increase in frontostriatal activation from childhood to adulthood during event-related tasks of cognitive control. Human Brain Mapping, 27, 973-993. Rubia, K., Smith, A. B., Taylor, E., & Brammer, M. (2007). Linear age-correlated functional development of right inferior fronto-striato-cerebellar networks during response inhibition and anterior cingulate during error-related processes. Human Brain Mapping, 28, 1163-1177.
Silveri, M. M., Rohan, M. L., Pimentel, P. J., Gruber, S. A., Rosso, I. M., & Yurgelun-Todd, D. A. (2006). Sex differences in the relationship between white matter microstructure and impulsivity in adolescents. Magnetic Resonance Imaging, 24, 833-841.
Stevens, M. C., Kiehl, K. A., Pearlson, G. D., & Calhoun, V. D. (2007). Functional neural networks underlying response inhibition in adolescents and adults. Behavioural Brain Research, 181, 12-22.
Stevens, M. C., Kiehl, K. A., Pearlson, G. D., & Calhoun, V. D. (2009). Brain network dynamics during error commission.Human Brain Mapping, 30 (1), 24-37.
Stuss, D. T., Murphy, K. J., Binns, M. A., & Alexander, M. P. (2003). Staying on the job: The frontal lobes control individual performance variability. Brain, 126 (11), 2363-2380. Tamm, L., Menon, V., & Reiss, A. L. (2002). Maturation of brain function associated with response inhibition. Journal of the American Academy of Child and Adolescent Psychiatry, 41 (10), 1231-1238.
Accepted Manuscript
23 4 5 6 7 8 9 10 11 12 13 14 15 16 17 18 19 20 21 22 23 24 25 26 27 28 29 30 31 32 33 34 35 36 37 38 39 40 41 42 43 44 45 46 47 48 49 50 51 52 53 54 55 56 57
Velanova, K., Wheeler, M. E., & Luna, B. (2008). Maturational changes in anterior cingulate and frontoparietal recruitment support the development of error processing and inhibitory control. Cerebral Cortex, 18, 2505-2522.
West, R., Murphy, K. J., Armilio, M. L., Craik, F. I., & Stuss, D. T. (2002). Lapses of intention and performance variability reveal age-related increases in fluctuations of executive control. Brajn and cognition,49 (3), 402-419.
Whyte, J., Grieb-Neff, P., Gantz, C., & Polansky, M. (2006). Measuring sustained attention after traumatic brain injury: differences in key findings from the sustained attention to response task (SART).Neuropsychologia, 44, 2007-2014.
Captions of figures:
Figure 1: Time course of a single trial (bottom-left to top-right)
Figure 2: Performance measures
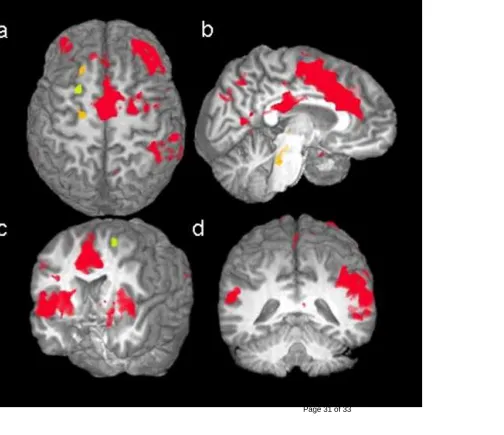
Figure 3: Activation maps for successful inhibitions for the superior frontal gyrus (a), AC and PC (b), insula (c), and both parietal lobes (d); red: children>adults; green: adults>children; orange: no difference
Figure 4: Activation maps for commission errors: vermis and lingual gyri (a), insulae (b) and uncus/amygdala (c); Green indicates higher activation for adults, red indicates no difference.
Accepted Manuscript
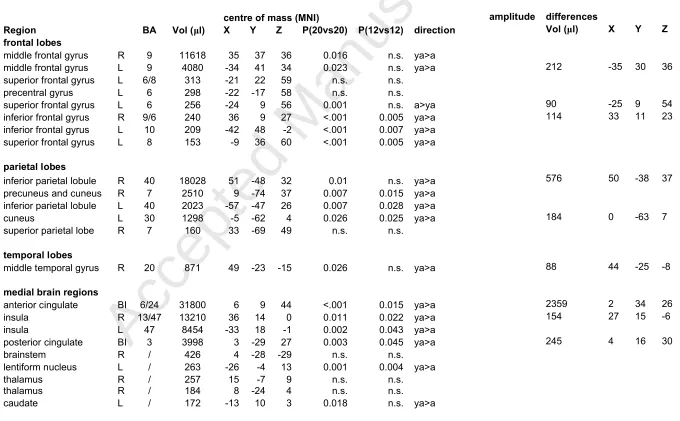
Table 1: Brain regions activated during successful inhibitions; group differences in region-level activation (direction: ya=young adolescents, a=adults). The P-values, from left to right, refer to: activation differences (full sample, performance matched sample). The columns on the right show clusters within these regions that differ voxelwise in
activation amplitude
centre of mass (MNI) amplitude differences
Region BA Vol (μl) X Y Z P(20vs20) P(12vs12) direction Vol (μl) X Y Z
frontal lobes
middle frontal gyrus R 9 11618 35 37 36 0.016 n.s. ya>a
middle frontal gyrus L 9 4080 -34 41 34 0.023 n.s. ya>a 212 -35 30 36
superior frontal gyrus L 6/8 313 -21 22 59 n.s. n.s.
precentral gyrus L 6 298 -22 -17 58 n.s. n.s.
superior frontal gyrus L 6 256 -24 9 56 0.001 n.s. a>ya 90 -25 9 54
inferior frontal gyrus R 9/6 240 36 9 27 <.001 0.005 ya>a 114 33 11 23
inferior frontal gyrus L 10 209 -42 48 -2 <.001 0.007 ya>a superior frontal gyrus L 8 153 -9 36 60 <.001 0.005 ya>a
parietal lobes
inferior parietal lobule R 40 18028 51 -48 32 0.01 n.s. ya>a 576 50 -38 37
precuneus and cuneus R 7 2510 9 -74 37 0.007 0.015 ya>a inferior parietal lobule L 40 2023 -57 -47 26 0.007 0.028 ya>a
cuneus L 30 1298 -5 -62 4 0.026 0.025 ya>a 184 0 -63 7
superior parietal lobe R 7 160 33 -69 49 n.s. n.s.
temporal lobes
middle temporal gyrus R 20 871 49 -23 -15 0.026 n.s. ya>a 88 44 -25 -8
medial brain regions
anterior cingulate BI 6/24 31800 6 9 44 <.001 0.015 ya>a 2359 2 34 26
insula R 13/47 13210 36 14 0 0.011 0.022 ya>a 154 27 15 -6
insula L 47 8454 -33 18 -1 0.002 0.043 ya>a
posterior cingulate BI 3 3998 3 -29 27 0.003 0.045 ya>a 245 4 16 30
brainstem R / 426 4 -28 -29 n.s. n.s.
lentiform nucleus L / 263 -26 -4 13 0.001 0.004 ya>a
thalamus R / 257 15 -7 9 n.s. n.s.
Accepted Manuscript
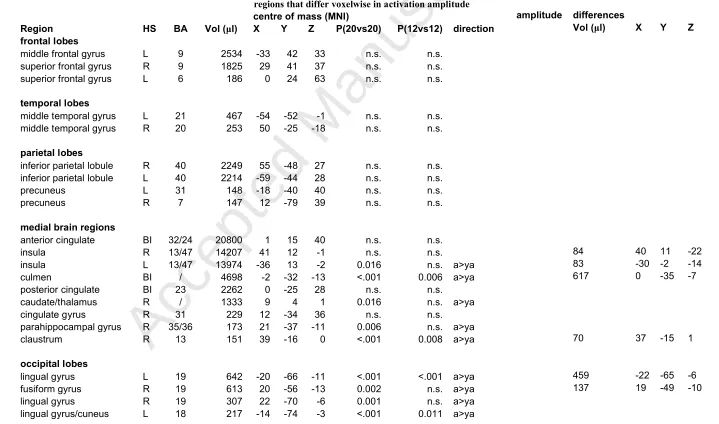
values, from left to right, refer to: activation differences (full sample, performance matched sample). The columns on the right show clusters within these regions that differ voxelwise in activation amplitude
centre of mass (MNI) amplitude differences
Region HS BA Vol (μl) X Y Z P(20vs20) P(12vs12) direction Vol (μl) X Y Z
frontal lobes
middle frontal gyrus L 9 2534 -33 42 33 n.s. n.s.
superior frontal gyrus R 9 1825 29 41 37 n.s. n.s.
superior frontal gyrus L 6 186 0 24 63 n.s. n.s.
temporal lobes
middle temporal gyrus L 21 467 -54 -52 -1 n.s. n.s.
middle temporal gyrus R 20 253 50 -25 -18 n.s. n.s.
parietal lobes
inferior parietal lobule R 40 2249 55 -48 27 n.s. n.s. inferior parietal lobule L 40 2214 -59 -44 28 n.s. n.s.
precuneus L 31 148 -18 -40 40 n.s. n.s.
precuneus R 7 147 12 -79 39 n.s. n.s.
medial brain regions
anterior cingulate BI 32/24 20800 1 15 40 n.s. n.s.
insula R 13/47 14207 41 12 -1 n.s. n.s. 84 40 11 -22
insula L 13/47 13974 -36 13 -2 0.016 n.s. a>ya 83 -30 -2 -14
culmen BI / 4698 -2 -32 -13 <.001 0.006 a>ya 617 0 -35 -7
posterior cingulate BI 23 2262 0 -25 28 n.s. n.s.
caudate/thalamus R / 1333 9 4 1 0.016 n.s. a>ya
cingulate gyrus R 31 229 12 -34 36 n.s. n.s.
parahippocampal gyrus R 35/36 173 21 -37 -11 0.006 n.s. a>ya
claustrum R 13 151 39 -16 0 <.001 0.008 a>ya 70 37 -15 1
occipital lobes
[image:28.842.60.779.96.520.2]