Abstract— This paper aims at determining the composition of various waste components at Robinson Deep landfill site (LS). The waste composition study was conducted during the summer in 2015 at Robinson LS to evaluate the various component of wastes received at the site. This was done in order to determine the amount of organic wastes that are generated daily as a basis for waste to energy (WtE) proposition in the City of Johannesburg (CoJ). The methodology used was in accordance with two international standards. Hands sorting were utilized and the samples were classified into nine broad categories. The categories include; paper, organics, plastics, metals, glasses, textiles, construction and demolition (C &D), special care and other wastes. The results of the analysis were classified into two, based on the services offered by the municipality (Dailies non-compacted and Round collected refuse (RCR) compacted wastes). From the results of the analysis of the waste components for dailies non-compacted wastes, Organic waste was 14% and for the RCR, Organic waste was 34%. The 14% organic waste generated from the dailies non-compacted waste was attributed to the high income level of people since as the living standard improves, people tend to buy packaged food items and the 34% organic wastes from the RCR was attributed to low income level of the people since people tend to prepare every basic meal.
Index Terms— City of Johannesburg, municipal solid waste, Robinson deep, waste to energy
I. INTRODUCTION
cross the globe, nations have set goals on the need to recoup resources from municipal solid waste (MSW) through recycling, energy recovery and complete diversion of MSW from going to the landfill sites (LSs). In order to achieve these objectives, authentic data on the composition of all components of MSW is required [1, 2]. Data on waste composition study becomes very essential in waste management (WM) in the quest to shift from landfill-based economy to resourced-based. Presently, management of MSW is becoming a challenge in many nations of the world
Manuscript received June 12, 2016; revised June 20, 2016. This work was supported in part by the University of Johannesburg, Process, Energy and Environmental Technology Station (PEETS) in conjunction with South African National Energy Development Institute (SANEDI) and the City of Johannesburg.
O. O. Ayeleru is with the Chemical Engineering Department, University of Johannesburg, South Africa (phone: +27 73 629 9135; e-mail: [email protected]).
F. Ntuli is with the Department of Chemical Engineering, University of Johannesburg, South Africa (e-mail: [email protected]).
C. Mbohwa is with the Department of Quality and Operations Management, University of Johannesburg, South Africa (e-mail: [email protected]).
as a result of the sudden shift from landfilling to reuse and recycling ideas. This is coming after the national and international goals of diversion of waste from going to the landfill through recycling and energy recovery have been set up [3-5]. Up till now, most municipalities in many nations of the world are landfilling waste, despite the fact that landfilling of MSW is becoming unpopular. This is an outright waste of resources since these resources could be recovered from the waste streams. The effect of this poses a great threat on the environment and health of the general public [6-8]. Waste generation turned to problems when man began to live together in settlement, groups and towns several decades ago, hence waste has been accumulating in substantial amounts. Influx of rural dwellers to the urban centres, industrialization and improvement in the living standards of the people have largely contributed to the acute growth rate of MSW [9-13].
MSW characterization is the basis towards achieving WtE proposition that will treat the rapidly growing amount of the organic fraction of MSW efficiently and converts it to resources. Quantity of waste components with respect to weight and composition fractions are evaluated through composition study [14, 15]. For a WtE program to be a success, data on composition study that highlights the quantity and type of waste components that are generated must be readily available. MSW composition studies become very crucial for the following reasons which include, evaluation of potential for material recovery, identification of origin of waste components, facilitation of design of processing equipment, determination of physical, chemical and thermal properties of waste and monitoring of compliance with both national and international standards [16-19].
MSW quantities can be quantified at all levels of government using site-specific and materials flow methods. The site-specific method involves sampling, sorting, and weighing of each item of the waste stream. The materials flow method is based on weight of materials and products in the waste stream. Specific adjustment is always required to be made on the production data for each item category in order to estimate generation data [20-23].
The current WM methods in some developing countries (DCs) are unsustainable since it promotes environmental degradation through emission of gases such as carbon dioxide (CO2) and methane (CH4) which contribute to global
warming and are very dangerous to the health of the general public. The utilization of CH4 through anaerobic digestion
(AD) has attracted greater interest and this looks promising in an attempt to effectively manage organic fraction of MSW
Municipal Solid Waste Composition
Determination in the City of Johannesburg
Olusola Olaitan Ayeleru,
Member, IAENG,
Freeman Ntuli,
Member, IAENG
and Charles Mbohwa
[24-26]. When organic waste is diverted from going to landfill to AD facilities, methane production for vehicular fuels will be maximized at a higher efficiency and emission of greenhouse gases (GHG) will be drastically reduced [27-29].
This paper aims at determining the composition of MSW at Robinson Deep LS in Johannesburg in an effort to support the waste to energy (WtE) project in the City of Johannesburg (CoJ).
II. DESCRIPTION OF THE STUDY AREA Johannesburg is one of the few cities in the world that is neither founded on coast nor major river [30]. City of Johannesburg (CoJ) is situated in Gauteng province in the eastern plateau of South Africa (SA) at a height of about 1,753 m. CoJ experienced tremendous population growth from 2001 to 2007 ranging from about 3.2 m to about 3.9 m.
CoJ was formerly decentralized into 11 regions but has currently been merged into 7 regions [31]. The regions are Region A which comprises of Diepsloot, Ivory Park, Midrand, Fourways and Kya Sand; Region B which comprises of Randburg, Rosebank, Emmarentia, Greenside and Melville; Region C which comprises of Roodepoort, Constantia Kloof and Northgate; Region D which comprises of Doornkop, Soweto, Dobsonville and Protea Glen; Region E which comprises of Alexandra, Wynberg and Sandton; Region F which comprises of the Inner City of Johannesburg and Region G which comprises of Orange Farm, Ennerdale and Lenasia (Figure 1). CoJ is usually considered as the
focal point and center of commerce of SA. Within Gauteng Province (GP), CoJ occupies about 1,644 km2 which is approximately about 10% of the total land mass of GP. GP comprises of three provinces which include, City of Tshwane, City of Ekurhuleni and CoJ. Johannesburg is the leading city in SA being the center of commercial activities and interest like Gauteng Tourist Attraction, Tranquil Parks, Unique Emotive Museums and Monuments and Stunning Galleries. In terms of the Gross Domestic Product (GDP) and rate of employment, its contribution to SA is the highest. There are constant influxes of different nationals to CoJ because of several jobs opportunities and this has actually contributed to the WM issues that the city is currently facing [32]. The current population of Johannesburg is about 4.4 million which is about 36% of the population of Gauteng and approximately about 8% of the total population of SA.
[image:2.595.308.550.366.493.2]Currently, at CoJ, there are four active LSs. They are Robinson Deep with about 7 years to its end of life, Goudkoppies with about 15 years remaining to be closed, Ennerdale with about 13 years left and Marie Louise with about 6 years left to be closed (Table 2). Each of this site received approximately about 1000 tons of wastes or less on daily basis and one of the them, Robinson Deep LS operates for a period of 24 hours daily [33].
Fig. 1 City of Johannesburg Regions
Table I
CAPACITY DETAILS OF LANDFILL SITES IN THE CITY OF JOHANNESBURG
Disposal Available Re maining life of Expe cte d date of
site space (m3) dump site closure
(ye ars) (month & ye ar)
Marie Louise 1744613 6 2021/01/01
Robinson Deep 4972680 7 2021/05/01
Ennerdale 1112271 13 2027/07/01
Goudkoppies 4581290 15 2030/01/01
Total 12410854
III. PRELIMINARY SITE ASSESSMENT
Before the commencement of the waste composition exercise, the LS was visited. The purpose of the visit was to be introduced to the Reclaimers/waste pickers by the management of the municipality (Pikitup) and thereafter the Research Team had a discussion with them at the site in order to prevent them from becoming aggressive when the actual exercise would have started, hence the Research Team enjoyed maximum cooperation from them. It was also used as an opportunity to study the terrain of the site and to map out a boundary where the waste sorting exercise will be carried out.
is given by (n) as shown in Equation 1 and this is required in order to attain a level of precision.
2/
*
s
e
x
t
n
(1)Where n is the number of samples to be sorted, t* is the student t statistic corresponding to the desired level of confidence, s is the estimated standard deviation, e is the desired level of precision, is the estimated mean. For this study, n0 was obtained as 50; t* = 1.645 at n = ∞, s = 0.06, e = 0.10, , , confidence level = 90% and precision level was 10% [34]. Also, at t* = 1.677, s = 0.06, e = 0.10, and n1 was obtained as 52. The number of samples can be determined by the proportion of waste stream in a sample. For instance, if a particular waste stream in a sample has lower percentage compared to other streams, it therefore means the number of samples to be chosen will be very large in order to confirm the amount of such waste stream when compared with other waste streams with higher percentages. Corrugated was chosen as the governing component since its standard deviation is lower to that of newsprint but the mean is higher which makes the number of samples chosen not to be too large [35].
V. METHODOLOGY
The exercise was conducted from the 29th of October to 6th of November of 2015 (a period of 7 days) at the Robinson Deep site in agreement with the standards. Waste samples were collected and sorted manually for that period at the site. A sample of 100kg of each waste stream was chosen and weighed as stipulated in the standard [34]. The activity ran through the week days from Monday to Friday. A sum of fifty-two samples were analyzed as stated in ASTM standard in order to provide statistical accuracy of 90% confidence level. In this study, the waste samples were classified into nine broad groups for the quantification activity. The nine groups for the site quantification exercise were further sub-divided into fifty-two divisions. The nine groups comprised of the following: paper and paperboard, glass, metal, plastic, textiles, organics, construction and demolition (C & D), special care wastes and other wastes. Table 2 gives a full list of waste items for sorting and Table 3 gives a representation of lists of some of the waste items. Truckloads of wastes were sampled randomly and loads of wastes were discharged in a designated area. 100kg of each of the load of waste was sampled from the incoming truck and was weighed in refuse bin containers designated for the activity. The University of Johannesburg Research Team carried out the collection, sorting and characterization and weighing of the waste samples. Data were then recorded on the sampling form. The data recorded comprise of origin of the waste, type of truck, date, and season.
Table II
LIST OF WASTE COMPONENT CATEGORIES
Mixed paper Other organics
High-grade paper Ferrous
Computer printout Cans
Other office paper Other ferrous
Newsprint Aluminium
Corrugated Cans
Plastic Foil
PET bottles Other aluminium
HDPE bottles Glass
Film Clear
Other plastic Brown
Yard waste Green
Food waste
Wood Other inorganics
Table III
DESCRIPTION OF SOME WASTE COMPONENT CATEGORIES
Mixed paper Office paper, computer paper, magazines,
glossy paper, waxed paper, and other paper
not fitting the categories of newsprint
and corrugated
Newsprint Newspaper
Corrugated Corrugated medium, corrugated boxes or cartons,
and brown (kraft) paper (that is, corrgated) bags
Plastics All plastics
Yard waste Branches, twigs, leaves, grass, and other plant
material
Food waste All food waste except bones
Other organics/ T extiles. Rubber, leather, and other primarily
combustibles burnable materials not included in the above
component categories
Ferrous Iron, steel, tin cans, and bi-metals cans
Aluminium Aluminium, aluminium cans, and aluminium
foil
Glass All glass
Other inorganics/ Rock, sand, dirt, ceramics, plaster, non-ferrous
non-combustibles non-aluminium metals (copper, brass, etc.) and
bones
Category Description
VI. EQUIPMENT
sub-division of wastes were used. Two traffic cones were used to demarcate the sampling and analysis areas to prevent moving trucks from coming in. One large First Aid kit was provided in order to use to attend to any emergency or minor accident. Personal Protective Equipment was provided for the Research Team which includes over-all, gloves, rubber boots, disposable face masks, helmets and safety goggles. Washing-hand basins with liquid soap and disinfectant were also provided to be used for washing of hands after each day exercise.
VII. RESULTS AND DISCUSSIONS
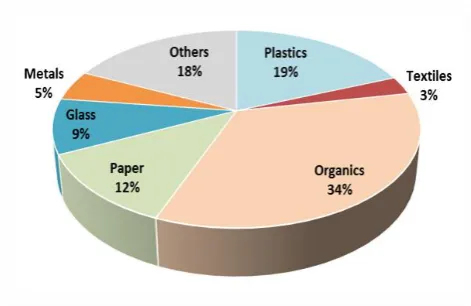
[image:4.595.53.289.415.553.2]The waste composition study was conducted on two of the services offered by Pikitup. These services are dailies non-compacted wastes and round collected refuse (RCR) compacted wastes. The daily non-compacted waste originates from hotels, restaurants, fast food cafeterias, butcher shops and street sweeping. They are collected daily in order to avoid offensive odour that may emanate as a result of its decay and which can pose threat to the health of the general public. The RCR originates from households in formal residential areas and businesses and are routinely collected weekly. They are commonly stored and collected in a 240 liters’ container. The results of the analysis of dailies non-compacted waste is shown in Figure 2 and that of RCR is shown in Figure 3.
Fig. 2 Composition of Dailies non compacted waste at Robinson Deep landfill site
Fig. 3 Composition of RCR compacted waste at Robinson Deep landfill site
For the daily non-compacted wastes as shown in Figure II, organic wastes occupied about 14%. In this waste category, bulk of the wastes are always plastics with 34%. This constitute the highest component of this category. It includes plastic bags, PET bottles, HDPE and other composite plastic wastes. Paper and paperboard occupied 17% and it include corrugated boxes, office papers, cardboards, magazines, newspapers, books and other composite waste papers. Other wastes constituted 10% and included are diapers, rubber, polyurethane foam, ceramics, tyres and carpet/rug. Glass occupied 9% and included are clear glass bottles, green glass bottles, amber bottles and other composite glasses. Textiles and metals occupied 8% each. Textiles include textiles, weavons, leather bags and fabrics and metals include aluminum containers, scrap metals, steel/tin and other non-ferrous metals. There are no C & D and special care wastes. For the RCR compacted wastes as shown in Figure III, organic wastes constituted the highest percentage of 34%. Bulk of these are food wastes followed by yard wastes and other composite organic wastes. Plastics occupied 19% and included here are PET bottles, HDPE etc. Other wastes constituted 18% and included are diapers, tyres, ceramics etc. Paper and paperboard occupied 12% and included are office paper, corrugated boxes, newspapers and so on. Glass constituted 9% and included here are clear glass bottles, green bottles, amber bottles and other composite bottles. Metals occupied 5% and included are aluminum cans, scrap metals, tin/steel, non-ferrous metals and other composite metals. Textiles occupied 3% and included here are textiles, leather bags, fabrics and weavons. It was observed that low-income areas generated more wastes than high-low-income areas. This figure is at variance with the trend globally in which waste generation increases as the standard of living improves. It was also observed that the low income areas generate high percentage of organic wastes than the middle income and high income areas; the latter generate more inorganic wastes such as plastics, bottles, cans, tins etc. 34% organic waste was generated by RCR compacted wastes and 14% by Dailies non-compacted wastes collection services.
VIII. CONCLUSION
[image:4.595.53.289.606.759.2]agreed upon that they correspond with the results of other previous studies.
ACKNOWLEDGMENT
The authors wish to appreciate the management of Pikitup Johannesburg (SOC) Limited for providing a platform through which the waste composition exercise was carried out, the Department of Chemical Engineering, University of Johannesburg for their valuable inputs and supports and the University of Johannesburg Research Team for their tenacious efforts to make this project becomes a success.
REFERENCES
[1] S. J. Burnley, J. C. Ellis, R. Flowerdew, A. J. Poll, and H. Prosser, "Assessing the composition of municipal solid waste in Wales," Resources, Conservation and Recycling, vol. 49, pp. 264-283, 2007.
[2] M. Herczeg, M. Skovgaard, R. Zoboli, and M. Mazzanti, "Diverting waste from landfill. Effectiveness of waste management policies in the European Union," European
Environment Agency Report, 2009.
[3] S. J. Burnley, "A Review of Municipal Solid Waste Composition in the United Kingdom," Waste Management, vol. 27, pp. 1274-1285, 2007.
[4] Y. Guangyu, "Amounts and composition of municipal solid wastes," Point Sources of Pollution: Local Effects and their
Control-Volume II, p. 275, 2009.
[5] S. N. S. Ismail and L. A. Manaf, "The challenge of future landfill: A case study of Malaysia," Journal of Toxicology and
Environmental Health Sciences, vol. 5, pp. 86-96, 2013.
[6] H. Jeswani and A. Azapagic, "Assessing the Environmental Sustainability of Energy Recovery from Municipal Solid Waste in the UK," Waste Management, vol. 50, pp. 346-363, 2016. [7] UNEP, "Global Waste Management Outlook," Kenya2015. [8] N. Scarlat, V. Motola, J. F. Dallemand, F. Monforti-Ferrario,
and L. Mofor, "Evaluation of energy potential of municipal solid waste from African urban areas," Renewable and
Sustainable Energy Reviews, vol. 50, pp. 1269-1286, 2015.
[9] I. A. Al-Khatib, M. Monou, A. S. F. A. Zahra, H. Q. Shaheen, and D. Kassinos, "Solid waste characterization, quantification and management practices in developing countries. A case study: Nablus district–Palestine," Journal of Environmental
Management, vol. 91, pp. 1131-1138, 2010.
[10] L. Giusti, "A review of waste management practices and their impact on human health," Waste management, vol. 29, pp. 2227-2239, 2009.
[11] A. W. Worrell and A. P. Vesilind, Solid Waste Engineering. Stamford, CT: Cengage Learning, 2012.
[12] APO, "Solid Waste Management, Issues and Challenges in Asia," ed. Tokyo: Asian Productivity Organization, 2007. [13] R. Joshi and S. Ahmed, "Status and challenges of municipal
solid waste management in India: A review," Cogent
Environmental Science, vol. 2, p. 1139434, 2016.
[14] R. Al-Jarallah and E. Aleisa, "A Baseline Study Characterizing the Municipal Solid Waste in the State of Kuwait," Waste
Management, vol. 34, pp. 952-960, 2014.
[15] A. K. Jha, S. K. Singh, G. P. Singh, and P. K. Gupta, "Sustainable municipal solid waste management in low income group of cities: a review," Tropical Ecology, vol. 52, pp. 123-131, 2011.
[16] E. Gidarakos, G. Havas, and P. Ntzamilis, "Municipal Solid Waste Composition Determination Supporting the Integrated Solid Waste Management System in the Island of Crete," Waste
Management, vol. 26, pp. 668-679, 2006.
[17] N. J. G. J. Bandara, J. P. A. Hettiaratchi, S. C. Wirasinghe, and S. Pilapiiya, "Relation of waste generation and composition to socio-economic factors: a case study," Environmental
Monitoring and Assessment, vol. 135, pp. 31-39, 2007.
[18] T. M. Palanivel and H. Sulaiman, "Generation and composition of municipal solid waste (MSW) in Muscat, Sultanate of Oman," APCBEE Procedia, vol. 10, pp. 96-102, 2014.
[19] K. Miezah, K. Obiri-Danso, Z. Kádár, B. Fei-Baffoe, and M. Y. Mensah, "Municipal solid waste characterization and quantification as a measure towards effective waste management in Ghana," Waste Management, vol. 46, pp. 15-27, 2015.
[20] EPA, "Municipal Solid Waste in the United States: 2011 Facts and Figures," Washington, D.C.2013.
[21] EPA, "Municipal Solid Waste in the United States: 2007 Facts and Figures
", Washington, D.C.2008.
[22] V. Gawaikar and V. P. Deshpande, "Source Specific Quantification and Characterization of Municipal Solid Waste- a Review," Journal of the Institution of Engineers(India), Part
EN, Environmental Engineering Division, vol. 86, pp. 33-38,
2006.
[23] D. I. Igbinomwanhia, Status of waste management: INTECH Open Access Publisher, 2011.
[24] N. Khairuddin, L. A. Manaf, M. A. Hassan, N. Halimoon, and W. A. W. Ab Karim, "Biogas harvesting from organic fraction of municipal solid waste as a renewable energy resource in Malaysia: A Review," Polish Journal of Environmental Studies, vol. 24, pp. 1477-1490, 2015.
[25] C. H. Ekanem, H. E. Ekanem, F. D. Eyenaka, and E. A. Isaiah, "Zero waste: an innovation for less polluting emission processes, resource management practices and policies,"
Mediterranean Journal of Social Sciences, vol. 4, p. 53, 2013.
[image:5.595.63.543.90.789.2][26] M. M. UCHE, "Consideration of Emission Ratios in Integrated Sustainable Municipal Solid Waste Management Planning," in FIG Congress 2014: Engaging the Challenges - Enhancing the Relevance
Kuala Lumpur, Malaysia, 2014.
[27] N. Naik, E. Tkachenko, and R. Wung, "The Anaerobic Digestion of Organic Municipal Solid Waste in California," CHEMISTRY, 234, Berkeley2013.
[28] J. L. Linville, Y. Shen, M. M. Wu, and M. Urgun-Demirtas, "Current State of Anaerobic Digestion of Organic Wastes in North America," Current Sustainable/Renewable Energy
Reports, vol. 2, pp. 136-144, 2015.
[29] T. Al Seadi, N. Owen, H. Hellström, and H. Kang, "Source separation of MSW: an overview of the source separation and separate collection of the digestible fraction of household waste, and of other similar wastes from municipalities, aimed to be used as feedstock for anaerobic digestion in biogas plants," IEA
Bioenergy, pp. 7-10, 2013.
[30] R. Widmer and R. Lombard, "e-Waste Assessment in South Africa: A case study of the Gauteng province," EMPA Material Science and Technology, Switzerland2005.
[31] CoJ, " Integrated Annual Report ", Johannesburg2012/2013. [32] CoJ, "City of Johannesburg Integrated Waste Management
Plan," City of Johannesburg, Johannesburg2011.
[33] Pikitup, "Integrated Annual Report," Pikitup Johannesburg SOC Ltd, Johannesburg2013/14.
[34] S. ASTM-D5231 – 92, "Standard Test Method for Determination of the Composition of Unprocessed Municipal Solid Waste," American Society for Testing and Materials, Conshohocken2008.