http://www.scirp.org/journal/ijg ISSN Online: 2156-8367
ISSN Print: 2156-8359
Spatial and Temporal Variations in the
Geochemistry of the Brahmaputra River Water
Sumi Handique
1*, Pragyan Sharma
1, Kushal K. Baruah
1, Jayant K. Tripathi
21Department of Environmental Science, Tezpur University, Tezpur, India
2School of Environmental Sciences, Jawaharlal Nehru University, New Delhi, India
Abstract
Spatial and temporal variation in the major ion composition of the waters in the Brahmaputra River has been measured to understand chemical weathering and the factors controlling these processes. Samples were collected from the Brah-maputra mainstream at five stations Pasighat, Dibrugarh, Tezpur, Guwahati and Dhubri during monsoon and post monsoon seasons. The total dissolved solids in the waters of the Brahmaputra system ranges between 62.5 and 192.5 mgl−1. The (Total dissolved solids) TDS of the Brahmaputra measured in this
study are less than the values reported by earlier workers. Gibbs plot was plotted to investigate the dominant process controlling the water chemistry of the Brahmaputra. The plots of TDS vs. (Na + K)/(Ca + Na + K) and TDS vs.
3
Cl Cl HCO+ − indicate that rock weathering is the main process controlling the chemistry of water in the Brahmaputra River. Factor analysis was done to study the factors controlling the water chemistry of the Brahmaputra.
Keywords
Spatial, Temporal, Weathering, TDS, Brahmaputra
1. Introduction
The Brahmaputra is one of the world’s largest rivers, with drainage area of 580,000 sq. km. (50.5% in China, 33.6% in India, 8.1% in Bangladesh and 7.8% in Bhutan). In India, its basin is shared by Arunachal Pradesh (41.9%), Assam (36.3%), Meghalaya (6.1%), Nagaland (5.6%), Sikkim (3.8%) and West Bengal (6.3%).It is a unique river which drains such diverse environments as the cold dry plateau of Tibet, the rain-drenched Himalayan slopes, the landlocked alluvial plains of Assam and the vast deltaic lowlands of Bangladesh. The Brahmaputra, one of the major river systems of the world, is characterized by very high rates of basin erosion, sediment yield, and channel change [1]. The river carries an aver-How to cite this paper: Handique, S.,
Sharma, P., Baruah, K.K. and Tripathi, J.K. (2017) Study on the Spatial and Temporal Variations in the Geochemistry of the Brah-maputra River Water. International Journal of Geosciences, 8, 756-765.
https://doi.org/10.4236/ijg.2017.85042
Received: December 24, 2014 Accepted: May 28, 2017 Published: May 31, 2017
Copyright © 2017 by authors and Scientific Research Publishing Inc. This work is licensed under the Creative Commons Attribution International License (CC BY 4.0).
http://creativecommons.org/licenses/by/4.0/
age annual suspended load of 400 million metric tons at Pandu at an average daily rate of nearly two million metric tons in rainy season (May to October) accounting for more than 95% of annual suspended load [1]. Transport rates as high as 26 million metric tons are recorded during peak flood flows. An ex-tremely dominant monsoon interacting with a unique physiographic setting, fragile geological base and active seismo-tectonic instability together with anth-ropogenic factors have moulded the Brahmaputra into one of the world’s most intriguing gigantic fluvial systems [1][2].
In this study we tried to find spatial and temporal variation in the major ion composition of the waters in the Brahmaputra River to understand water geo-chemistry, chemical weathering and the factors controlling these processes.
2. Materials and Methods
2.1. Study Area
The Brahmaputra drains the Tibetan Plateau of China and is dominated by upl-and tributaries originating in the Himalayas. The Brahmaputra flows through various rock types including Precambrian metamorphics (high-grade schists, gneisses, quartzites, and metamorphosed limestones), felsic intrusives, and Pa-leozoic–Mesozoic sandstones, shales and limestones [3].
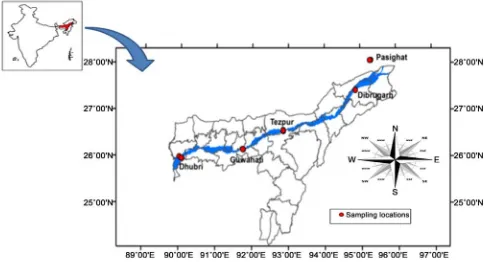
The drainage basin of the Brahmaputra System can be divided into five geo-logically and climatically different sub basins (Figure 1) [4]. These are:
1) the high plateau of Tibet; 2) the Eastern Syntaxis;
[image:2.595.57.542.458.720.2]3) the Mishmi Hills or the Eastern Drainage; 4) the Himalaya Mountains;
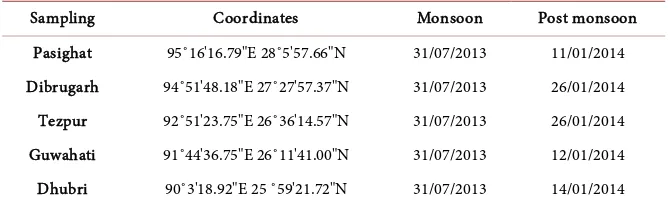
Table 1. Sampling stations and date of sampling.
Sampling Coordinates Monsoon Post monsoon
Pasighat 95˚16'16.79"E 28˚5'57.66"N 31/07/2013 11/01/2014
Dibrugarh 94˚51'48.18"E 27˚27'57.37"N 31/07/2013 26/01/2014
Tezpur 92˚51'23.75"E 26˚36'14.57"N 31/07/2013 26/01/2014
Guwahati 91˚44'36.75"E 26˚11'41.00"N 31/07/2013 12/01/2014
Dhubri 90˚3'18.92"E 25 ˚59'21.72"N 31/07/2013 14/01/2014
5) the Indo-Myanmar and Naga-Patkoi Ranges or the Southern Drainage; 6) the plains of Assam and Bangladesh.
2.2. Sampling
Water samples from the Brahmaputra mainstream at five stations (Figure 1 and Table 1) were collected during two seasons: the monsoon and the post mon-soon. The monsoon samples were collected during the month of July, repre-senting peak discharge, and the post monsoon samples were collected in Janu-ary. The Brahmaputra mainstream was sampled at five stations: Pasighat, Di-brugarh, Tezpur, Guwahati, and Dhubri (Figure 1 and Table 1).
Soon after their collection, two separate aliquots of 500 ml water were filtered using 0.45 µm nylon membrane Millipore filters. One of the filtered aliquots was acidified with double-distilled HNO3 for cations analysis and the other aliquot
was preserved unacidified for anion measurements. In addition, one sample of 250 ml water was collected and stored unfiltered for alkalinity measurements. Temperature and pH of the water samples were measured at site. The water samples were brought to the laboratory for further analysis. Alkalinity was measured by acid titration; Cl, and SO4 by titration; K and Na by flame AAS; and
Al, Pb, Fe Ca, Mg, and Si using ICP-AES.
3. Results and Discussions
The various parameters measured are given in Table 2. It was observed that pH was almost same at all sites during monsoon indicating no spatial variation (may be due to dilution effect) whereas decreases downstream and was found to be least in Guwahati suggesting anthropogenic inputs (from municipal waste and Bharalu river). Mostly all parameters showed more values in monsoon except hardness which may be due to increased carbonate dissolution because of in-creased chemical weathering. In this study it was observed that the total dis-solved solids in the waters of the Brahmaputra river ranges between 62.5 and 194.5 mgl−1 (Table 2).
Table 2. Showing different parameters (units in mg/l except pH and EC in micro seimens).
Place Name pH EC Alkalinity TDS 2
4
SO− Hardness Cl− Reactive
silica Ca Fe Mg Na K Al Pb
Pasighat Monsoon PAS.M 6.2 132.5 130.2 62.5 16.28 185 56.8 2.16 22.81 1.48 3.75 2.74 1.42 1.27 0.022 Pasighat Post Monsoon PAS.PM 7.7 221 155.4 102.5 22.21 100 63.9 3.79 27.8 0.09 5.33 3.49 2.04 0.46 0.003
Dibrugarh Monsoon DIB.M 6.2 97.5 115.4 47 6.43 185 71 2.4 13.52 0.23 2.3 2.17 2.34 0.38 0.013
Dibrugarh Post Monsoon DIB.PM 7.6 187 180.6 89 12.14 90 71 5.49 25.41 0.11 5.51 3.25 3.23 0.43 0.001 Tezpur Monsoon TEZ.M 6.1 134 180.4 63.5 11.07 157.5 60.35 1.24 4.89 0.22 0.9 0.96 1.87 0.64 0.001 Tezpur Post Monsoon TEZ.PM 7.2 195 205.4 90.5 14 90 46.15 4.72 24.6 0.17 5.43 3.42 2.65 0.52 0.002 Guwahati Monsoon GHY.M 6.1 130 205 63.5 11.14 185 67.45 3.27 18.2 1.91 3.44 3.03 2.78 2.15 0.022 Guwahati Post Monsoon GHY.PM 3.3 816.5 180 194.5 19.92 95 37.28 5.78 27.49 0.003 6.13 3.47 2.87 0.38 0.003
Dhubri Monsoon DHU.M 6.1 88.5 217.5 44 10 187.5 56.8 3.12 19.36 2.93 3.94 2.54 2.15 1.53 0.016
Dhubri Post Monsoon DHU.PM 5.4 212.5 230 98.5 14.64 90 49.2 3.88 28.29 0.06 6.78 3.43 2.82 0.39 0.001
Mean Monsoon 6.13 116.5 177.7 56.1 10.98 180 62.48 2.45 15.76 1.36 2.86 2.29 2.11 1.19 0.017
Mean Post Monsoon 5.67 196.06 171.1 93.44 12.69 129.8 54.07 3.26 19.58 0.81 3.97 2.63 2.23 0.83 0.009 Standard deviation monsoon 0.07 21.73 35.67 9.74 3.533 12.6 6.45 0.82 6.92 1.16 1.26 0.81 0.51 0.71 0.005
Standard deviation
post monsoon 2.09 203.64 51.12 98.4 5.22 57.5 18.12 1.56 8.01 0.95 1.91 0.94 0.74 0.57 0.008
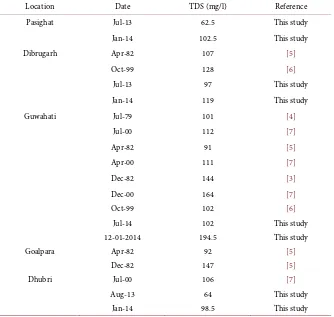
Table 3. Decadal variation in TDS of the Brahmaputra along its course.
Location Date TDS (mg/l) Reference
Pasighat Jul-13 62.5 This study
Jan-14 102.5 This study
Dibrugarh Apr-82 107 [5]
Oct-99 128 [6]
Jul-13 97 This study
Jan-14 119 This study
Guwahati Jul-79 101 [4]
Jul-00 112 [7]
Apr-82 91 [5]
Apr-00 111 [7]
Dec-82 144 [3]
Dec-00 164 [7]
Oct-99 102 [6]
Jul-14 102 This study
12-01-2014 194.5 This study
Goalpara Apr-82 92 [5]
Dec-82 147 [5]
Dhubri Jul-00 106 [7]
Aug-13 64 This study
Jan-14 98.5 This study
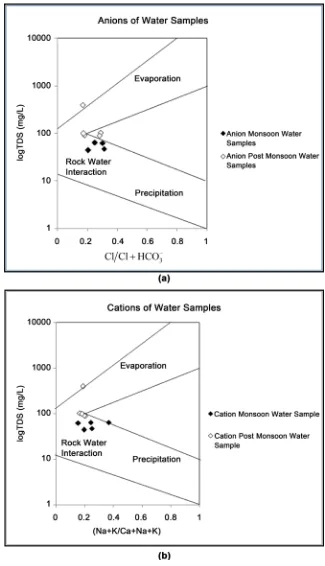
[image:4.595.132.466.393.710.2]3.1. Gibbs Plot of Anions and Cations of Water Samples
[image:5.595.209.534.143.709.2]In Figure 2(a) and Figure 2(b), it is observed that the anions and cations respec-tively, present in the water samples are mainly due to rock water interaction for both the seasons. Evaporation has a bit influence in the post monsoon samples.
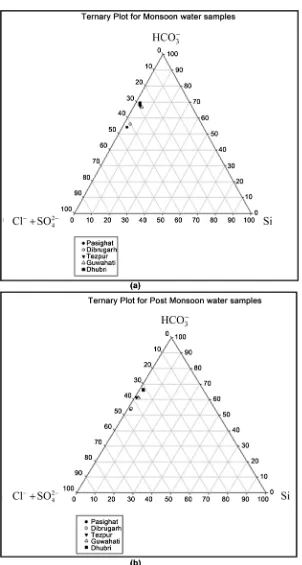
Figure 3. Ternary plot of anions water samples in (a) Monsoon and (b) Post Monsoon Season.
Gibbs plot [10] was plotted to investigate the dominant process controlling the water chemistry of the Brahmaputra. The plot of TDS vs. (Na + K)/(Ca + Na + K) and TDS vs. Cl Cl HCO3
−
car-bonates is the predominant process resulting in the production of these ions. However the presence of Potassium and Sodium and other ions suggest that weathering of Silicates is also important.
3.2. Ternary plot of Anions and Cations of Water Samples in
Monsoon and Post Monsoon
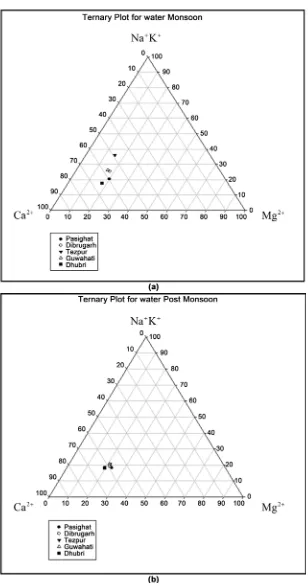
From the ternary plots (Figure 4(a) and Figure 4(b)) it was found that most of the samples fall towards the Ca apex indicating the dominance of Ca in the cation budget of the Brahmaputra.
On the anion plot the samples cluster towards HCO3
− both in monsoon as
well as post monsoon seasons (Figure 3(a) and Figure 3(b)). A preliminary in-ference from these distributions is that a major source of dissolved cations to the water is carbonate weathering which is in accordance with the earlier study by [9].
3.3. Factor Analysis
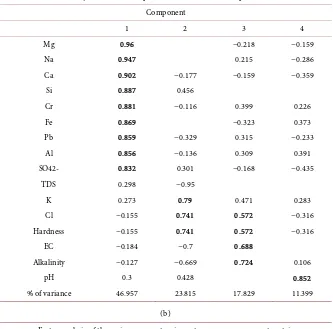
Table 4(a) and Table 4(b) show the factor analysis of various parameters of wa-ter samples in Monsoon and Post monsoon seasons respectively.
From factor analysis of various parameters in monsoon and post monsoon showed 4 probable sources with most of the Sodium, Lead, Sulphate, Magne-sium, Iron, Aluminum, Calcium, and Chromium coming from source 1. Lead has 3 probable sources and Silicon and Aluminum coming from the same source.
In monsoon Factor 1 explaining 46.95% of the total variance had strong posi-tive loadings (> 0.80) for Sodium, Lead, Sulphate, Magnesium, Iron, Aluminum, Calcium, Chromium. Factor 2 accounts for 23.8% and have strong positive loadings (> 0.70) on Potassium, Chlorine, and hardness and moderate positive loadings on pH and Silicon. Factor 3 accounts for 17.82% of the total variance and shows positive loadings for EC and alkalinity. Factor 4 accounts for 11.3% of the total variance.
For post monsoon 4 factors were obtained through factor analysis, Factor 1 accounted for 40.76% of the total variance and have strong positive loadings with EC, alkalinity, TDS, Sodium, Sulphate, Calcium and Chromium. Factor 2 accounts for 28.79% of the total variance, with positive loadings on Aluminum, Sulphate, Chlorine, and hardness, Lead, Sodium and TDS. Factors 3 correspond to 18.18% of the total variance and have positive loadings on Calcium, Silicon, Aluminum, Iron and hardness. Factor 4 accounts for 12.25% of the total va-riance and have positive loadings on Silicon, Potassium, Chlorine and hardness.
4. Conclusion
than a decade earlier. It was observed that there is a strong seasonal variability in cation and anion concentrations. The plots of TDS vs. (Na + K)/(Ca + Na + K) and TDS vs. Cl Cl HCO3
−
[image:8.595.220.528.118.704.2]+ indicate that rock weathering is the main process
Table 4. (a) Factor analysis of parameters in monsoon; (b) Factor analysis of parameters in post monsoon.
(a)
Factor analysis of the various parameters in monsoon-component matrix Component
1 2 3 4
Mg 0.96 −0.218 −0.159
Na 0.947 0.215 −0.286
Ca 0.902 −0.177 −0.159 −0.359
Si 0.887 0.456
Cr 0.881 −0.116 0.399 0.226
Fe 0.869 −0.323 0.373
Pb 0.859 −0.329 0.315 −0.233
Al 0.856 −0.136 0.309 0.391
SO42- 0.832 0.301 −0.168 −0.435
TDS 0.298 −0.95
K 0.273 0.79 0.471 0.283
Cl −0.155 0.741 0.572 −0.316
Hardness −0.155 0.741 0.572 −0.316
EC −0.184 −0.7 0.688
Alkalinity −0.127 −0.669 0.724 0.106
pH 0.3 0.428 0.852
% of variance 46.957 23.815 17.829 11.399
(b)
Factor analysis of the various parameters in post monsoon-component matrix Component
1 2 3 4
EC 0.866 −0.339 0.236 0.282
Alkalinity 0.862 −0.342 0.239 0.289
Fe −0.805 0.254 0.403 −0.355
TDS 0.786 0.613
Na 0.771 0.362 −0.11 −0.513
Pb 0.77 0.516 0.375
Hardness −0.686 0.492 −0.197 0.497
Cl −0.686 0.492 −0.197 0.497
K −0.313 −0.856 0.404
Sulphate 0.585 0.786 0.197
pH −0.235 −0.699 −0.32 −0.595
Ca 0.607 0.139 −0.781
Cr 0.452 −0.341 0.761 −0.317
Mg 0.312 −0.648 −0.667 −0.196
Si 0.142 −0.54 0.598 0.575
Al −0.489 0.476 0.579 −0.446
controlling the chemistry of water in the Brahmaputra River. Higher concentra-tion of Calcium and Bicarbonate suggest chemical weathering of carbonates is the predominant process resulting in the production of these ions. From the ternary plot it was found that most of the samples fall towards the Ca apex indi-cating the dominance of Ca in the cation budget of the Brahmaputra. On the anion plot the samples cluster towards HCO3
−. A preliminary inference from
these distributions is that a major source of dissolved cations to the water is car-bonate weathering which is in accordance with the earlier study by [9].
Acknowledgements
The authors are thankful to the staff of Department of Environmental Science, Tezpur University for helping in carrying out all the analysis.
References
[1] Chen, C. and Guan Z. (1981) Hydrochemistry of Rivers in Xizang. In: Geological and Ecological Studies of Qinghai-Xizang Plateau, Gordon and Brach Science Pub-lishers, New York, 1687-1692.
[2] Goswami, D.C. (1985) Brahmaputra River, Assam, India: Physiography, Basin de-nudation, and Channel Aggradation. Water Resource Research, 21, 959-978.
https://doi.org/10.1029/WR021i007p00959
[3] Galy, A. and France-Lanord, C. (1999) Weathering Processes in the Ganges-Brah- maputra Basin and the Riverine Alkalinity Budget. Chemical Geology, 159, 31-60. [4] Gibbs, R.J. (1970) Mechanisms Controlling World Water Chemistry. Science, 170,
1088-1090. https://doi.org/10.1126/science.170.3962.1088
[5] Hu, M., Stallard, R.F. and Edmond, J. (1982) Major Ion Chemistry of Some Large Chinese Rivers. Nature, 298, 550-553.https://doi.org/10.1038/298550a0
[6] Ives, J.D. and Messerli, B. (1989) The Himalayan Dilemma: Reconciling develop-ment and Conservation. Routledge, .London and New York, 324 p.
https://doi.org/10.4324/9780203169193
[7] Sarin, M.M., Krishnaswami, S., Dilli, K., Somayajulu, B.L.K. and Moore, W.S. (1989) Major Ion Chemistry of the Ganga-Brahmaputra River System: Weathering Processes and Fluxes to the Bay of Bengal. Geochimica et Cosmochimica Acta, 53, 997-1009.
[8] Galy, A. and France-Lanord, C. (1999) Weathering Processes in the Ganges-Brah- maputra Basin and the Riverine Alkalinity Budget. Chemical Geology,159, 31-60 [9] Singh, S.K., Sarin, M.M. and France-Lanord, C. (2005) Chemical Erosion in the
Eastern Himalaya: Major Ion Composition of the Brahmaputra and δ13C of Dis-solved Inorganic Carbon. Geochimica et Cosmochimica Acta, 69, 3573-3588. [10] Gibbs, R.J. (1970) Mechanisms Controlling World Water Chemistry. Science, 170,
Submit or recommend next manuscript to SCIRP and we will provide best service for you:
Accepting pre-submission inquiries through Email, Facebook, LinkedIn, Twitter, etc. A wide selection of journals (inclusive of 9 subjects, more than 200 journals)
Providing 24-hour high-quality service User-friendly online submission system Fair and swift peer-review system
Efficient typesetting and proofreading procedure
Display of the result of downloads and visits, as well as the number of cited articles Maximum dissemination of your research work