ISSN Print: 2327-4352
DOI: 10.4236/jamp.2017.59134 Sep. 15, 2017 1620 Journal of Applied Mathematics and Physics
Application of the Queuing Theory in
Characterizing and Optimizing the Passenger
Flow at the Airport Security
Mengjiao Wang
Economics and Mathematics, Faculty of Social Science and Law, University of Bristol, Bristol, UK
Abstract
This paper presents mathematics models that describe and optimize the pas-senger flow at the airport security checkpoints by applying the queuing theory. Firstly, a Poisson process is used to estimate the flow of passengers waiting for going through the security. Then, the Poisson distribution is com-bined with a multiple M/M/s model. Following that, an arrival model (pas-sengers’ arriving at the checkpoints preparing for security examination and departure) with Gumbel extreme value estimation is described that predicts the busiest time in the busiest airport. Real case data collected from several major airports worldwide is used for creating a hybrid Poisson model to gen-erate the simulation of passenger volume. At last, Markov Chain theory is ap-plied to the analysis to randomly simulate the flow of enplaned passengers again, and the results of these two simulations are compared and discussed, revealing that the hybrid Poisson model is the more accurate one. After suc-cessfully characterizing the passenger flow mathematically, two methods for optimizing the passenger flow are then provided in two different respects: one is bypassing passengers and creating an express pass; while the other one promotes Pre-Check service application.
Keywords
Queuing Theory, Poisson Process, Gumbel Extreme Value Estimation, Hybrid Poisson Model, Markov Chain
1. Introduction
The unnecessary waiting time before the security checkpoints at the airports is a well-known issue. Provided by Bureau of Transportation Statistics [1], there
How to cite this paper: Wang, M.J. (2017) Application of the Queuing Theory in Characterizing and Optimizing the Pas-senger Flow at the Airport Security. Journal of Applied Mathematics and Physics, 5, 1620-1628.
https://doi.org/10.4236/jamp.2017.59134
DOI: 10.4236/jamp.2017.59134 1621 Journal of Applied Mathematics and Physics were more than 36,285,000 passengers enplaned in 2015 from Chicago O’Hare Airport. Suggested by Dailymail [2], more than 400 passengers missed their flights at merely one night because of the extremely long queue. Rigorous and thorough security screening is recognized as a significant importance role in gu-aranteeing safety, especially in reducing hijacking and explosion. However, the necessary safety screening causes unnecessary delays for passengers, wasting their time and increasing the risk of missing the flights. In order to identify the bottlenecks of current situation, the flow of passengers through a security checkpoint needs to be mathematically characterized. Therefore in this paper, we use a multiple M/M/s model to stimulate the queuing problem of passengers within worldwide large international airports, and try to explore optimization methods to reduce the length of the queues.
2. Overview of the Queuing Model and
Arrival Model
The full simulation consists of two parts, the queuing part and passenger’s arriv-als part. The queuing part explains how security zones handle incoming passen-gers. The arrival part, more specifically, people’s arrivals at those checkpoints, is a stochastic simulation of passengers’ behavior about how they choose to appear in front of security check queues.
The following assumptions are used throughout the analysis in this paper: • We assume that there are several security checkpoints in different terminals and all these checkpoints are connected. This means that passengers choose whichever the terminal or the checkpoints and they can always get to their boarding gate. Even if their gates are in terminal 3, they can pass through the checkpoints in terminal 1, 2, or 4 to get there.
• Based on data from London Heathrow Airport, half of the passengers will departure from Terminal 5, so hereby we assume that half of the passengers will enplane through one terminal [3].
• Based on data in major airports in the world, we assume that the opening hours of an airport are 16 hours per day.
• All the lanes are operated asynchronously without any occurrence of emer-gency. Staffs are fully prepared so that they can get to work immediately when a new lane has been opened.
• All the screeners, guides and officers provide homogeneous service quality and this quality is more than acceptable. Staffs are well trained and professional so no human errors will appear and have an adverse impact on the processing time.
• This research will only focus on passengers taking economy class. Queues for first class and business class are out of our consideration.
DOI: 10.4236/jamp.2017.59134 1622 Journal of Applied Mathematics and Physics
3. Introduction to the Multiple Asynchronous M/M/s
Queuing Model
Our queuing model is based on an asynchronous multiple M/M/s queue model which is composed by many single asynchronous M/M/s queues. We first ex-plain how to cater the M/M/s queue model for our needs and then move to the multiple version.
3.1. Single Asynchronous M/M/s Queuing Model
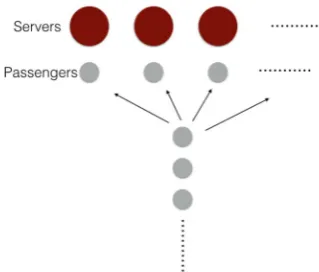
A single asynchronous M/M/s queuing model is formed by a series of asyn-chronous servers denoted by Si where i∈N, (i.e. 1, 2, 3, 4, 5, …) and a lane of passengers waiting for being checked. Asynchronous servers handle passengers at different times, (i.e., every server in this queue model is independent to other servers). When a passenger finished his screening by the server, another passen-ger from the lane will take over that position to keep the server operating with-out pausing.
Figure 1 shows a typical single M/M/s queuing system fully loaded with cos-tumers. For each server, ti denotes the time interval between two travelers mov-ing through the gate. As soon as this passenger finishes this step, he moves to the following examination step and next costumer will come to the server and repeat this process, while ti varies for distinct passengers. To model ti, we need to ana-lyze its components first.
Figure 2 shows a typical passenger divides his personal belongings into 3
Figure 1. A single M/M/s queue.
[image:3.595.294.454.423.559.2]DOI: 10.4236/jamp.2017.59134 1623 Journal of Applied Mathematics and Physics baskets for x-ray examination. Each basket takes tbj seconds to prepare. To ge-neralize ti for each passenger with n baskets, we have:
1 n
i j
j
t tb
=
=
∑
According to most airline regulations, the luggage allowance for econo-my-class passengers is small. Therefore, we assume for all econoecono-my-class pas-sengers, they can only separate their items into smaller than 6 baskets.
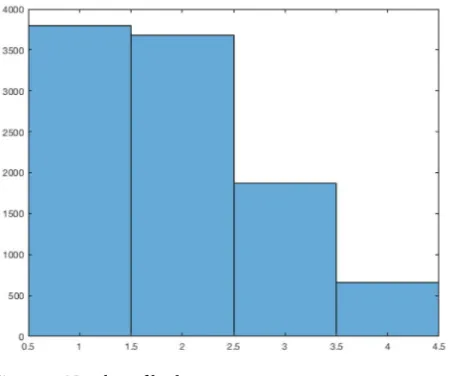
We model the number of baskets per passenger by a Poisson process. In addi-tion, the Poisson distribution we employed is slightly modified to fit the case. Since the Poisson distribution with λ = 1 starts from 0, we add 1 to every Poisson random number to account for the fact that there is no one with no basket for examination. Furthermore, we cut all Poisson random numbers above 4, since we add 1 to every Poisson random number and assume no passenger will have more than 5 baskets.
Figure 3 illustrates the histogram of our modified Poisson distribution, which suggests 1 or 2 baskets per passenger are the most likely case and 4 baskets case is comparatively rarer than other cases. The time tbj takes by basket j is modeled by χ2 distribution with 2 degree of freedom. The number of degree of freedom is empirical based on an experiment. To be specific, in real world, a fully-loaded single M/M/s queue with 4 servers can handle a maximum of 1000 passengers in 1 hour (3600 seconds) [4]. We run the model of a single 4 servers M/M/s queue which handles 1000 people in 100 times. The mean of time to process these people is 3590 seconds while the standard deviation is 25.8017 seconds. The Figure 4 also suggests the results are quite steady around 3600 seconds.
3.2. Multiple Asynchronous M/M/s Queue Model and Multinomial
Decision
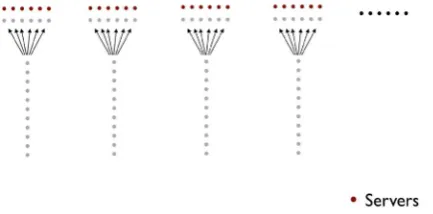
[image:4.595.261.488.528.716.2]The multiple asynchronous M/M/s queue model is composed of n single M/M/s queue models. The only difference is that, multiple asynchronous M/M/s queue
DOI: 10.4236/jamp.2017.59134 1624 Journal of Applied Mathematics and Physics model is built to account for the fact that queues may be far away from each other and passenger are not informed to which queue is the shortest.
Although Figure 5 shows an illustration of multiple asynchronous M/M/s queue with same queue length, in our simulation or real world, this rarely hap-pens. Hence we choose to imitate passengers’ behavior on random basis. We use multinomial distribution to model their decisions, meaning each queue is equal-ly likeequal-ly for each passenger to join. The multinomial distribution model will be discussed in more details in Section 4.
4. Introduction of the Arrival Model and Additional
Assumption Based on Gumbel Maximum Estimation
We evaluate the busiest case of world’s leading airports with Gumbel maximum estimation [5].
[image:5.595.261.484.370.547.2]Based on our earlier assumption, half of departure passengers enplane from the largest terminal. We evaluate the daily average to be around 38,400 [6] economy class departure passengers per day in that terminal, with a standard deviation of 3,900 passengers [7] [8]. We find 44,993 passengers departure from the largest terminal within a day at 99.5% level and we set that as the extreme value for further test and simulations on daily basis.
Figure 4. Simulations of a single M/M/s queue.
[image:5.595.268.485.583.690.2]DOI: 10.4236/jamp.2017.59134 1625 Journal of Applied Mathematics and Physics
4.1. Hybrid Poisson Arrivals with Multinomial Distribution
In our earlier investigation, most security checkpoints open from 4 am to 10 pm (16 hours). The arrivals are modeled as two stages [9]. The first stage is generat-ed by a Poisson distribution which simulates with sampling interval down to 15 minutes. There are clusters of people arriving within each quarter. We calibrate the size of these clusters to 400 people per cluster to fit real world data. Every simulation of this Hybrid model will deliver an average people arrival rate of around 38,000 passengers per day. In second stage we use multinomial distribu-tion to reduce sampling interval to 1 second, with data carried out from stage 1, and we uniformly distribute these clusters of people per 15 minutes to several people per second. We make this intensive sampling in order to plug passenger flows into our queue system for test purposes. Figure 6 illustrates how people arrive in different measurements. Figure 6(a) adds passenger flows in every quarter into an hour basis.
4.2. Markov Chain Arrivals with First-Hitting-Time Model
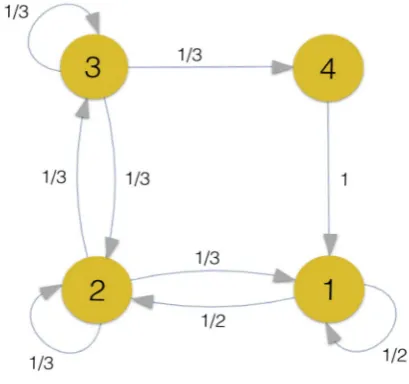
The second model is implemented by Markov chain. We can plot the state dia-gram as Figure 7 and define transition matrix by M.
The first passage hitting time for each state is calculated empirically from real- world data.
[image:6.595.208.537.497.690.2]A typical day starts from state 1 and each hour is dependent on stochastic. The probability to reach states onward decreases over time. Therefore we use each state to represent a randomly selected hour in a day. State 1 stands for least busy, i.e. a small number of passengers’ arrivals in this state. State 2 stands for less busy, i.e. a normal number of passengers’ arrivals within this state. State 3 is the busiest state, i.e. a massive number of passengers arriving in the state. How-
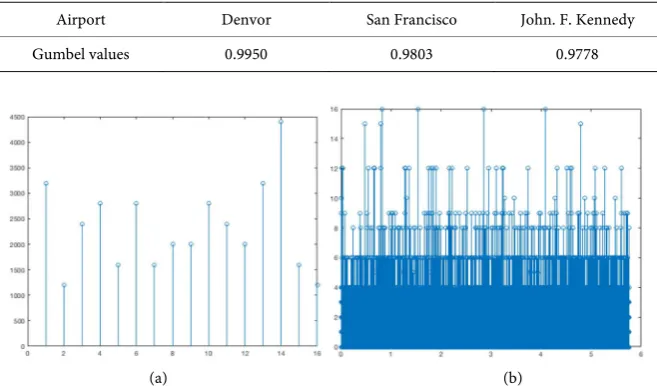
Table 1. Gumbel maximum values.
Airport Denvor San Francisco John. F. Kennedy Gumbel values 0.9950 0.9803 0.9778
(a) (b)
DOI: 10.4236/jamp.2017.59134 1626 Journal of Applied Mathematics and Physics Figure 7. 4 states Markov chain.
Table 2. First passage hitting time of each state.
states 1 2 3 4
Hitting time 0.375 2 7 15
ever State 4 is more like an idle state since we design this state with a first pas-sage hitting time of 15, so we somehow expected it to be the state at the end of the day.
In our simulation (Figure 8), the Markov chain model gives 42,750 passengers to departure in a day. Although state 4 tends to be the last hour of the day in this simulation, state 4 is not necessarily to be the case if we run it for a number of times. It can also illustrate the case when there are only a few passengers arriving at the airport in a day.
4.3. Arrival Model Comparison
Both models illustrate large variance within a day. Markov chain model runs faster since it has fewer states, while hybrid Poisson model has much more states compared to the Markov chain model and closer to real situations.
5. Recommendations of Plausible Modifications
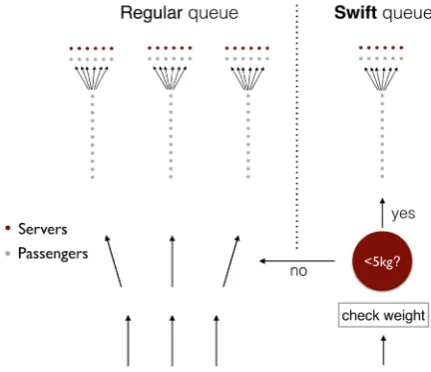
5.1. Swift Queuing System
DOI: 10.4236/jamp.2017.59134 1627 Journal of Applied Mathematics and Physics
[image:8.595.211.532.64.212.2](a) (b)
Figure 8. Simulation of Markov chain model. (a) Time series of states; (b) Time series of number of passengers arrival.
Figure 9. Express bypass-Swift queuing system.
5.2. Promote Pre-Check and Adjust the Passenger to Lanes Ratio
for This Group
Another way to reduce the queue length is to encourage more passengers to ap-ply for Pre-Check. According to TSA, approximately 45% passengers enroll in a program called “Pre-Check for trusted travelers”. These passengers pay an addi-tional $85 to receive a background check and enjoy a separate screening process with few modifications to save time for five years [10]. There is a survey showing that 97% of TSA passengers only wait 5 minutes or less. We can promote this service by increasing more price options such as $20 per year vs. $85 per five year, which will attract more potential passengers such as international students who will not stay for five years in the U.S.
6. Conclusions
[image:8.595.263.479.262.448.2]up-DOI: 10.4236/jamp.2017.59134 1628 Journal of Applied Mathematics and Physics shots to some extent, the problems lie in the basic operation system, such as the large variance of the number of passengers. In this paper, our models illustrate the fluctuations of passenger volume and optimize the ways for the staffs to ar-range passenger queuing as well as how to change the number of lanes flexibly using an M/M/s model and simulation. Then we discover methods of improve-ment with dynamic models instead of a steady-state model.
References
[1] Bureau of Transportation Statistics. (2016) 2015 U.S.-Based Airline Traffic Data. [2] Collman, A. and Chia, J. (2016) Hundreds Stranded, Passengers Sleeping in COTS:
TSA Security Lines of up to THREE HOURS Cause Chaos at Chicago O’Hare as National Staff Shortage at Airports Makes Thousands Miss Flights.
[3] Statista. (2015) Share of Passengers at Heathrow Airport in the United Kingdom (UK) in 2015, by Terminal Used.
[4] Angiolelli, L. Behan, P. PFWG. (2012) SECURITY ACCESS & EGRESS Implemen-tation Guide Passenger FaciliImplemen-tation.
[5] Kotsu Goda (2016) Reliability for Engineers. Kotsu Goda, Bristol, 67-80.
[6] San Francisco International Airport. (2016) Analysis of Scheduled Airline Traffic Comparative Traffic Report.
[7] Denver International Airport. (2016) Passenger Traffic Reports.
[8] Quayson, J., Grullon, S., Debrosse, J. and Japi, T. (2016) Monthly Summaries of Airport Activities.
[9] Chicago Department of Aviation. (n.d.). TSA Information.
[10] Transportation Security Admission. Available: https://www.tsa.gov/precheck
Submit or recommend next manuscript to SCIRP and we will provide best service for you:
Accepting pre-submission inquiries through Email, Facebook, LinkedIn, Twitter, etc. A wide selection of journals (inclusive of 9 subjects, more than 200 journals)
Providing 24-hour high-quality service User-friendly online submission system Fair and swift peer-review system
Efficient typesetting and proofreading procedure
Display of the result of downloads and visits, as well as the number of cited articles Maximum dissemination of your research work
Submit your manuscript at: http://papersubmission.scirp.org/