ScienceDirect
Available online at www.sciencedirect.com Available online at www.sciencedirect.com
ScienceDirect
Procedia CIRP 00 (2017) 000–000www.elsevier.com/locate/procedia
2212-8271 © 2017 The Authors. Published by Elsevier B.V.
Peer-review under responsibility of the scientific committee of the 28th CIRP Design Conference 2018.
28th CIRP Design Conference, May 2018, Nantes, France
A new methodology to analyze the functional and physical architecture of
existing products for an assembly oriented product family identification
Paul Stief *, Jean-Yves Dantan, Alain Etienne, Ali Siadat
École Nationale Supérieure d’Arts et Métiers, Arts et Métiers ParisTech, LCFC EA 4495, 4 Rue Augustin Fresnel, Metz 57078, France
* Corresponding author. Tel.: +33 3 87 37 54 30; E-mail address: [email protected]
Abstract
In today’s business environment, the trend towards more product variety and customization is unbroken. Due to this development, the need of agile and reconfigurable production systems emerged to cope with various products and product families. To design and optimize production systems as well as to choose the optimal product matches, product analysis methods are needed. Indeed, most of the known methods aim to analyze a product or one product family on the physical level. Different product families, however, may differ largely in terms of the number and nature of components. This fact impedes an efficient comparison and choice of appropriate product family combinations for the production system. A new methodology is proposed to analyze existing products in view of their functional and physical architecture. The aim is to cluster these products in new assembly oriented product families for the optimization of existing assembly lines and the creation of future reconfigurable assembly systems. Based on Datum Flow Chain, the physical structure of the products is analyzed. Functional subassemblies are identified, and a functional analysis is performed. Moreover, a hybrid functional and physical architecture graph (HyFPAG) is the output which depicts the similarity between product families by providing design support to both, production system planners and product designers. An illustrative example of a nail-clipper is used to explain the proposed methodology. An industrial case study on two product families of steering columns of thyssenkrupp Presta France is then carried out to give a first industrial evaluation of the proposed approach.
© 2017 The Authors. Published by Elsevier B.V.
Peer-review under responsibility of the scientific committee of the 28th CIRP Design Conference 2018.
Keywords:Assembly; Design method; Family identification
1. Introduction
Due to the fast development in the domain of communication and an ongoing trend of digitization and digitalization, manufacturing enterprises are facing important challenges in today’s market environments: a continuing tendency towards reduction of product development times and shortened product lifecycles. In addition, there is an increasing demand of customization, being at the same time in a global competition with competitors all over the world. This trend, which is inducing the development from macro to micro markets, results in diminished lot sizes due to augmenting product varieties (high-volume to low-volume production) [1]. To cope with this augmenting variety as well as to be able to identify possible optimization potentials in the existing production system, it is important to have a precise knowledge
of the product range and characteristics manufactured and/or assembled in this system. In this context, the main challenge in modelling and analysis is now not only to cope with single products, a limited product range or existing product families, but also to be able to analyze and to compare products to define new product families. It can be observed that classical existing product families are regrouped in function of clients or features. However, assembly oriented product families are hardly to find.
On the product family level, products differ mainly in two main characteristics: (i) the number of components and (ii) the type of components (e.g. mechanical, electrical, electronical).
Classical methodologies considering mainly single products or solitary, already existing product families analyze the product structure on a physical level (components level) which causes difficulties regarding an efficient definition and comparison of different product families. Addressing this Procedia CIRP 81 (2019) 145–150
2212-8271 © 2019 The Authors. Published by Elsevier Ltd.
This is an open access article under the CC BY-NC-ND license (http://creativecommons.org/licenses/by-nc-nd/3.0/) Peer-review under responsibility of the scientific committee of the 52nd CIRP Conference on Manufacturing Systems. 10.1016/j.procir.2019.03.026
© 2019 The Authors. Published by Elsevier Ltd.
This is an open access article under the CC BY-NC-ND license (http://creativecommons.org/licenses/by-nc-nd/3.0/)
Peer-review under responsibility of the scientific committee of the 52nd CIRP Conference on Manufacturing Systems.
ScienceDirect
Procedia CIRP 00 (2019) 000–000
www.elsevier.com/locate/procedia
2212-8271 © 2019 The Authors. Published by Elsevier Ltd. This is an open access article under the CC BY-NC-ND license (http://creativecommons.org/licenses/by-nc-nd/3.0/)
Peer-review under responsibility of the scientific committee of the 52nd CIRP Conference on Manufacturing Systems.
52nd CIRP Conference on Manufacturing Systems
A framework to predict energy related key performance indicators of
manufacturing systems at early design phase
F. Assad
a,*, B. Alkan
a, M. K. Chinnathai
a, M. H. Ahmad
a, E.J. Rushforth
a, R. Harrison
a a Automation Systems, Warwick Manufacturing Group (WMG), University of Warwick, CV4 7AL, Coventry, UK* Corresponding author. Tel.: +44 (0)2476523245; E-mail address: [email protected]
Abstract
Increasing energy prices, growing market competition, strict environmental legislations, concerns over global climate change and customer interaction incentivise manufacturing firms to improve their production efficiency and minimise bad impacts to environment. As a result, production processes are required to be investigated from energy efficiency perspective at early design phase where most benefits can be attained at low cost, time and risk. This article proposes a framework to predict energy-related key performance indicators (e-KPIs) of manufacturing systems at early design and prior to physical build. The proposed framework is based on the utilisation and incorporation of virtual models within VueOne virtual engineering (VE) tool and WITNESS discrete event simulation (DES) to predict e-KPIs at three distinct levels: production line, individual workstations and the components as individual energy consumption units (ECU). In this framework, alternative designs and configurations can be investigated and benchmarked in order to implement and build the best energy-efficient system. This ensures realising energy-efficient production system design while maintaining predefined production system targets such as cycle-time and throughput rate. The proposed framework is exemplified by a use case of a battery module assembly system. The results reveal that the proposed framework results meaningful e-KPIs capable of supporting manufacturing system designers in decision making in terms of component selection and process design towards an improved sustainability and productivity.
© 2019 The Authors. Published by Elsevier Ltd. This is an open access article under the CC BY-NC-ND license (http://creativecommons.org/licenses/by-nc-nd/3.0/)
Peer-review under responsibility of the scientific committee of the 52nd CIRP Conference on Manufacturing Systems.
Keywords: Sustainable manufacturing; Discrete event simulation; Virtual engineering; Energy key performance indicators; Design phase validation
1.Introduction
World industrial energy consumption is expected to increase by 18% between 2015 and 2040 [1]. Faced by such anticipations in addition to the high energy prices and depletion rate, manufacturers have to consider the environmental impacts, and make sure that the production activities contribute to sustainability on the long term side-by-side with the targeted quality and productivity. Therefore, the “Sustainable Manufacturing” concept, which emphasises on the conservation of energy and materials when adding value, should be adopted throughout system lifecycle. This means that the required tools and solutions which guarantee accessibility and interoperability of system and process data have to be developed and better integrated.
The research in energy consumption management in manufacturing industry is less developed compared to other fields such as smart vehicles and smart buildings [2]. This is due to the lack of energy key performance indicators (e-KPIs), and the absence of a model that describes the system and the processes energy consumption [2]. The state of the art e-KPIs generally have the form of the amount of consumed energy per time period, which does not reveal the relation between component regarded as individual energy consumption unit (ECU) settings and its energy consumption [3]. Many definitions and suggestions to identify e-KPIs have been introduced without a remarkable success due to the complexity and multiplicity of manufacturing systems [4].
Generally, the system lifecycle goes through the following phases: design, commissioning, build, operation and maintenance, redesign and reconfigure. For design phase
Available online at www.sciencedirect.com
ScienceDirect
Procedia CIRP 00 (2019) 000–000
www.elsevier.com/locate/procedia
2212-8271 © 2019 The Authors. Published by Elsevier Ltd. This is an open access article under the CC BY-NC-ND license (http://creativecommons.org/licenses/by-nc-nd/3.0/)
Peer-review under responsibility of the scientific committee of the 52nd CIRP Conference on Manufacturing Systems.
52nd CIRP Conference on Manufacturing Systems
A framework to predict energy related key performance indicators of
manufacturing systems at early design phase
F. Assad
a,*, B. Alkan
a, M. K. Chinnathai
a, M. H. Ahmad
a, E.J. Rushforth
a, R. Harrison
a a Automation Systems, Warwick Manufacturing Group (WMG), University of Warwick, CV4 7AL, Coventry, UK* Corresponding author. Tel.: +44 (0)2476523245; E-mail address: [email protected]
Abstract
Increasing energy prices, growing market competition, strict environmental legislations, concerns over global climate change and customer interaction incentivise manufacturing firms to improve their production efficiency and minimise bad impacts to environment. As a result, production processes are required to be investigated from energy efficiency perspective at early design phase where most benefits can be attained at low cost, time and risk. This article proposes a framework to predict energy-related key performance indicators (e-KPIs) of manufacturing systems at early design and prior to physical build. The proposed framework is based on the utilisation and incorporation of virtual models within VueOne virtual engineering (VE) tool and WITNESS discrete event simulation (DES) to predict e-KPIs at three distinct levels: production line, individual workstations and the components as individual energy consumption units (ECU). In this framework, alternative designs and configurations can be investigated and benchmarked in order to implement and build the best energy-efficient system. This ensures realising energy-efficient production system design while maintaining predefined production system targets such as cycle-time and throughput rate. The proposed framework is exemplified by a use case of a battery module assembly system. The results reveal that the proposed framework results meaningful e-KPIs capable of supporting manufacturing system designers in decision making in terms of component selection and process design towards an improved sustainability and productivity.
© 2019 The Authors. Published by Elsevier Ltd. This is an open access article under the CC BY-NC-ND license (http://creativecommons.org/licenses/by-nc-nd/3.0/)
Peer-review under responsibility of the scientific committee of the 52nd CIRP Conference on Manufacturing Systems.
Keywords: Sustainable manufacturing; Discrete event simulation; Virtual engineering; Energy key performance indicators; Design phase validation
1.Introduction
World industrial energy consumption is expected to increase by 18% between 2015 and 2040 [1]. Faced by such anticipations in addition to the high energy prices and depletion rate, manufacturers have to consider the environmental impacts, and make sure that the production activities contribute to sustainability on the long term side-by-side with the targeted quality and productivity. Therefore, the “Sustainable Manufacturing” concept, which emphasises on the conservation of energy and materials when adding value, should be adopted throughout system lifecycle. This means that the required tools and solutions which guarantee accessibility and interoperability of system and process data have to be developed and better integrated.
The research in energy consumption management in manufacturing industry is less developed compared to other fields such as smart vehicles and smart buildings [2]. This is due to the lack of energy key performance indicators (e-KPIs), and the absence of a model that describes the system and the processes energy consumption [2]. The state of the art e-KPIs generally have the form of the amount of consumed energy per time period, which does not reveal the relation between component regarded as individual energy consumption unit (ECU) settings and its energy consumption [3]. Many definitions and suggestions to identify e-KPIs have been introduced without a remarkable success due to the complexity and multiplicity of manufacturing systems [4].
specifically, it refers to the interaction between the product conceptual design and the conceptual process planning. Consequently, taking sustainability into account since this early stage would save time and system engineering effort.
One of the main challenges at the design phase is the lack of data that represent components’ interaction within the system. Also, continuous changes in product design and consequently in process design result in several configurations with unique characteristics and qualities. Thus, it is essential to have adequate tools that are able to quantify the energy consumption of the continuously changing designs. In this vein, establishing a form of integration between DES and VE tools can serve as an effective solution that is capable of predicting energy consumption at the component (ECU), station and production line levels.
Therefore, this paper introduces a novel approach of integrating VE and DES tools through an expert system that acts like a design platform for better energy consumption at the early design phase. The expert system adapts with common manufacturing system design tools where various virtual design data can be integrated and streamlined to predict e-KPIs. The remainder of this paper is as follows: Section 2 reviews the literature related to VE and DES in manufacturing systems. Section 3 introduces the proposed methodology and the suitable early design phase e-KPIs. The case study description, results and discussion are presented in Section 4. Section 5 concludes the paper.
2.Literature review
VE and DES applications are not limited to energy consumption or manufacturing systems. In the following review of the literature, energy related applications of both DES and VR are highlighted. Besides, energy consumption quantification measures are reviewed in order to link them with VE and DES. Then the research questions are given based on research gaps analysis.
2.1.VE and DES in literature
Mashaei and Lennartson [5] developed a control strategy to adjust machines on-off state in a way that minimises the machines idle time where they used DES to verify the simulation model. To have an elementary estimation of the energy consumed by each actuator, Cataldo et al [6] proposed a methodology that links each actuator to a power profile, and based on this power profile a DES model of the process equipment is formulated later. A DES based simulation approach mixed with 3D digital human simulations was proposed by Caggiano et al [7] to quantify sustainability, productivity and work cell ergonomics index. Using virtual reality (VR) tools, the authors in [8] could visualise the energy flow in machine tools in the form of 3D Sankey diagrams instead of 2D ones, as the 3D requires a vast amount of data that cannot be provided in the conventional methods. In addition to the previously mentioned techniques of energy visualisation, Pelliccia et al proposed [9] another technology that depends on 3D particle
systems, and compared the three techniques in terms of usability and understanding. An energy optimisation tool that combines both component energy consumption and work station reconfiguration using the virtual engineering capabilities was introduced by Ahmad et al [10]. An augmented reality based mobile application that provides the process information including energy was presented by Kollatsch et al [11].
2.2.Energy consumption evaluation:
In general, there are well-known concepts used to describe energy consumption such as:
Energy efficiency is usually linked to the amount of the energy consumed per unit or product [12].
Energy Effectiveness can be expressed as the time used up per resource to manufacture the product [13].
Energy awareness can be more inclusive as it accounts the data energy as a stakeholder in the production management aiming at decreasing waste and cost [14]. May et al. [15] specified the key components of Energy Management in Manufacturing (EMM) to be: measurement, key performance indicator (KPIs), monitoring and evaluation and control. Consequently, any approach that addresses EMM either on the component, process or system level should focus on one or more of these aspects. Peruzzini and Pellicciari [16] introduced some environmental KPIs for the early stage of design but in the conceptualisation phase. Another approach is introduced by Bornschlegl et al [17] represented e-KPIs in the early design stage in the form of RPIs (Resource Performance Indicators) but with focus on the joining technologies in automotive manufacturing. May et al [3] highlighted many gaps in manufacturing energy consumption in both design and implementation phases to which they attempted to contribute. Among these gaps is the difficulty of benchmarking of energy efficiency between manufacturing plants due to the ambiguity of the cause-effect relation. Thus, the gap still continues to exist in practise as the roots of the problem are not tackled in the early validation phase. Moreover and with regard to the design phase, Uluer et al [18] introduced an approach that starts with profiling energy consumption, then planning process based on ISO/STEP 10303 AP224 and finally validating the new proposed procedures with DES. The initial data source in this approach depends on acquiring energy data from previously installed meters which means more hardware and eventually additional cost.
2.3.Summary and research gap analysis
The following points can be noticed when examining the previously introduced state of the art:
VE techniques were used to model and visualise energy consumption in various forms.
DES proved to be an efficient tool that contributes to energy performance by improving process design.
The combination of DES and VE increases the visibility and transparency to the process parameters, and identifies
the components’ states which grants the designer an insight into energy consumption in particular.
Despite the many attempts to introduce e-KPIs, to the authors’ knowledge, no e-KPIs were assigned to the early design stages with available tools and achievable implementation approach. In this research article, the contribution of VE is further extended to realise the Energy Key Performance Indicators (e-KPIs) by establishing an expert system that acts as the joining point between VueOne VE tool and WITNESS DES tool. The potential is promising providing the recent advancements in VE field. Besides, the expert system increases the design flexibility by allowing the test of more (What if) scenarios for the purpose of system energy consumption reduction. Additionally, the expert system is generic and able to link any type of VE tools to predict e-KPIs. The research questions this paper addresses are:
What is the architecture of the proposed expert system? What are the e-KPIs suitable for the design phase to be
planted in the expert system?
What limitations might come up and what means can be used to overcome them?
Seeking meaningful answers to these research questions, a methodology is constructed and introduced in the next section.
3.Methodology
3.1.Expert system
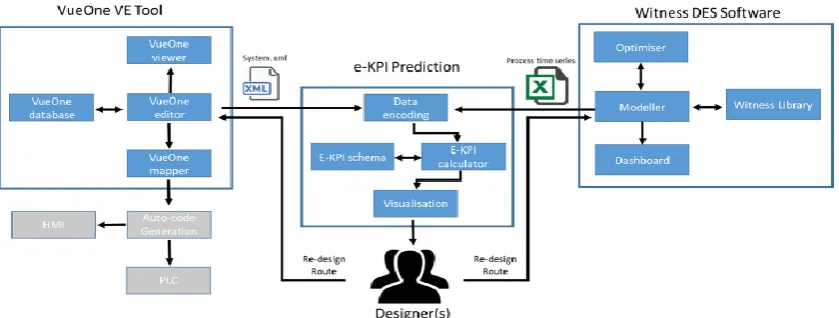
This study presents an expert system to predict energy related key performance indicators of virtual manufacturing system designs at early life-cycle stages. The proposed expert system provides a common data integration model, where virtual engineering data sets, captured from various engineering tools, are streamlined and transformed into meaningful e-KPI values to support early-stage decision-making activities. The expert system is developed in the MATLAB™ numerical computing program, and its data flow is given in Fig. 1. Currently, the proposed expert system monitors e-KPIs at component, work-station and production line levels, and uses design data coming from virtual process planning and discrete event simulation software, namely: VueOne™ and Witness™ DES, respectively. VueOne™ is a
software environment designed at the Automation Systems Group (ASG) at University of Warwick aiming to support Cyber-Physical Systems (CPS) lifecycle by enabling the data exchange and calibration between the cyber and physical worlds [19]. WITNESS™, on the other hand, is designed by Lanner Group Ltd to provide virtual engineering solutions for manufacturing system layout design and optimisation purposes. In a recent survey [20] that attempted to classify the most popular DES tools, WITNESS™ was classified in the first of three clusters which reveals a good suitability to this area of research.
3.2.Data collection and encoding
Components’ process information is collected from the VueOne VE tool in the form of an XML file. This file consists of operational (e.g. cycle time information, travel distance, etc.) and control information (e.g. process steps, I/O information, etc.) of each component, and is directly fed to the proposed expert system. In this file, each component and corresponding workstations are tagged with a unique ID. The designer should import multiple XML file of different workstation design depending on the size and application of the manufacturing system. System level information, on the other hand, is taken from WITNESS software through an excel sheet. This sheet contains encoded information regarding resource states in a time series format. Please note that, each resource modelled in the DES software contains same unique ID of its VueOne counterpart, so that the expert system can automatically match the relevant information sources.
Once these two documents are imported, the proposed expert system encodes the information, and decomposes manufacturing systems into workstation and further their components. Note that for each product process on a workstation, a corresponding XML file should be imported to the expert system. This information is then recorded by the system, and used in the energy profile matching.
3.3.e-KPIs
The method introduced in this paper relies on both component behaviour and process planning. The component is defined as: “an autonomous unit consisting of the
specifically, it refers to the interaction between the product conceptual design and the conceptual process planning. Consequently, taking sustainability into account since this early stage would save time and system engineering effort.
One of the main challenges at the design phase is the lack of data that represent components’ interaction within the system. Also, continuous changes in product design and consequently in process design result in several configurations with unique characteristics and qualities. Thus, it is essential to have adequate tools that are able to quantify the energy consumption of the continuously changing designs. In this vein, establishing a form of integration between DES and VE tools can serve as an effective solution that is capable of predicting energy consumption at the component (ECU), station and production line levels.
Therefore, this paper introduces a novel approach of integrating VE and DES tools through an expert system that acts like a design platform for better energy consumption at the early design phase. The expert system adapts with common manufacturing system design tools where various virtual design data can be integrated and streamlined to predict e-KPIs. The remainder of this paper is as follows: Section 2 reviews the literature related to VE and DES in manufacturing systems. Section 3 introduces the proposed methodology and the suitable early design phase e-KPIs. The case study description, results and discussion are presented in Section 4. Section 5 concludes the paper.
2.Literature review
VE and DES applications are not limited to energy consumption or manufacturing systems. In the following review of the literature, energy related applications of both DES and VR are highlighted. Besides, energy consumption quantification measures are reviewed in order to link them with VE and DES. Then the research questions are given based on research gaps analysis.
2.1.VE and DES in literature
Mashaei and Lennartson [5] developed a control strategy to adjust machines on-off state in a way that minimises the machines idle time where they used DES to verify the simulation model. To have an elementary estimation of the energy consumed by each actuator, Cataldo et al [6] proposed a methodology that links each actuator to a power profile, and based on this power profile a DES model of the process equipment is formulated later. A DES based simulation approach mixed with 3D digital human simulations was proposed by Caggiano et al [7] to quantify sustainability, productivity and work cell ergonomics index. Using virtual reality (VR) tools, the authors in [8] could visualise the energy flow in machine tools in the form of 3D Sankey diagrams instead of 2D ones, as the 3D requires a vast amount of data that cannot be provided in the conventional methods. In addition to the previously mentioned techniques of energy visualisation, Pelliccia et al proposed [9] another technology that depends on 3D particle
systems, and compared the three techniques in terms of usability and understanding. An energy optimisation tool that combines both component energy consumption and work station reconfiguration using the virtual engineering capabilities was introduced by Ahmad et al [10]. An augmented reality based mobile application that provides the process information including energy was presented by Kollatsch et al [11].
2.2.Energy consumption evaluation:
In general, there are well-known concepts used to describe energy consumption such as:
Energy efficiency is usually linked to the amount of the energy consumed per unit or product [12].
Energy Effectiveness can be expressed as the time used up per resource to manufacture the product [13].
Energy awareness can be more inclusive as it accounts the data energy as a stakeholder in the production management aiming at decreasing waste and cost [14]. May et al. [15] specified the key components of Energy Management in Manufacturing (EMM) to be: measurement, key performance indicator (KPIs), monitoring and evaluation and control. Consequently, any approach that addresses EMM either on the component, process or system level should focus on one or more of these aspects. Peruzzini and Pellicciari [16] introduced some environmental KPIs for the early stage of design but in the conceptualisation phase. Another approach is introduced by Bornschlegl et al [17] represented e-KPIs in the early design stage in the form of RPIs (Resource Performance Indicators) but with focus on the joining technologies in automotive manufacturing. May et al [3] highlighted many gaps in manufacturing energy consumption in both design and implementation phases to which they attempted to contribute. Among these gaps is the difficulty of benchmarking of energy efficiency between manufacturing plants due to the ambiguity of the cause-effect relation. Thus, the gap still continues to exist in practise as the roots of the problem are not tackled in the early validation phase. Moreover and with regard to the design phase, Uluer et al [18] introduced an approach that starts with profiling energy consumption, then planning process based on ISO/STEP 10303 AP224 and finally validating the new proposed procedures with DES. The initial data source in this approach depends on acquiring energy data from previously installed meters which means more hardware and eventually additional cost.
2.3.Summary and research gap analysis
The following points can be noticed when examining the previously introduced state of the art:
VE techniques were used to model and visualise energy consumption in various forms.
DES proved to be an efficient tool that contributes to energy performance by improving process design.
The combination of DES and VE increases the visibility and transparency to the process parameters, and identifies
the components’ states which grants the designer an insight into energy consumption in particular.
Despite the many attempts to introduce e-KPIs, to the authors’ knowledge, no e-KPIs were assigned to the early design stages with available tools and achievable implementation approach. In this research article, the contribution of VE is further extended to realise the Energy Key Performance Indicators (e-KPIs) by establishing an expert system that acts as the joining point between VueOne VE tool and WITNESS DES tool. The potential is promising providing the recent advancements in VE field. Besides, the expert system increases the design flexibility by allowing the test of more (What if) scenarios for the purpose of system energy consumption reduction. Additionally, the expert system is generic and able to link any type of VE tools to predict e-KPIs. The research questions this paper addresses are:
What is the architecture of the proposed expert system? What are the e-KPIs suitable for the design phase to be
planted in the expert system?
What limitations might come up and what means can be used to overcome them?
Seeking meaningful answers to these research questions, a methodology is constructed and introduced in the next section.
3.Methodology
3.1.Expert system
This study presents an expert system to predict energy related key performance indicators of virtual manufacturing system designs at early life-cycle stages. The proposed expert system provides a common data integration model, where virtual engineering data sets, captured from various engineering tools, are streamlined and transformed into meaningful e-KPI values to support early-stage decision-making activities. The expert system is developed in the MATLAB™ numerical computing program, and its data flow is given in Fig. 1. Currently, the proposed expert system monitors e-KPIs at component, work-station and production line levels, and uses design data coming from virtual process planning and discrete event simulation software, namely: VueOne™ and Witness™ DES, respectively. VueOne™ is a
software environment designed at the Automation Systems Group (ASG) at University of Warwick aiming to support Cyber-Physical Systems (CPS) lifecycle by enabling the data exchange and calibration between the cyber and physical worlds [19]. WITNESS™, on the other hand, is designed by Lanner Group Ltd to provide virtual engineering solutions for manufacturing system layout design and optimisation purposes. In a recent survey [20] that attempted to classify the most popular DES tools, WITNESS™ was classified in the first of three clusters which reveals a good suitability to this area of research.
3.2.Data collection and encoding
Components’ process information is collected from the VueOne VE tool in the form of an XML file. This file consists of operational (e.g. cycle time information, travel distance, etc.) and control information (e.g. process steps, I/O information, etc.) of each component, and is directly fed to the proposed expert system. In this file, each component and corresponding workstations are tagged with a unique ID. The designer should import multiple XML file of different workstation design depending on the size and application of the manufacturing system. System level information, on the other hand, is taken from WITNESS software through an excel sheet. This sheet contains encoded information regarding resource states in a time series format. Please note that, each resource modelled in the DES software contains same unique ID of its VueOne counterpart, so that the expert system can automatically match the relevant information sources.
Once these two documents are imported, the proposed expert system encodes the information, and decomposes manufacturing systems into workstation and further their components. Note that for each product process on a workstation, a corresponding XML file should be imported to the expert system. This information is then recorded by the system, and used in the energy profile matching.
3.3.e-KPIs
[image:3.595.85.505.607.766.2]The method introduced in this paper relies on both component behaviour and process planning. The component is defined as: “an autonomous unit consisting of the
automation device (i.e. actuator, sensor) with its own computing hardware (processor, memory, communication interface electronic interface to the automation device) and control software (application programs, operating system and communication protocol)”[21].
The component energy to be plugged into the expert system is classified into (Fig. 2) [10]:
Variable: ready for the moving components or machining for the material removing components.
[image:4.595.45.283.235.342.2] Constant: base when energy is a function of operation time or idle that represents the losses due to drive inefficiency (η is the drive efficiency).
Fig. 2. Classification of component energy consumption [10].
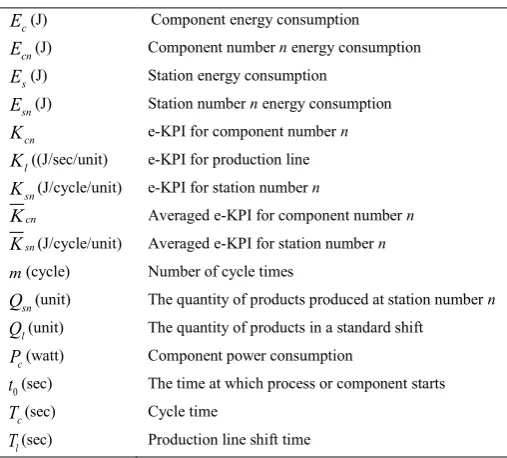
[image:4.595.28.282.415.644.2]The nomenclature used in the following sections is illustrated below in Table 1.
Table 1. Nomenclature.
c
E (J) Component energy consumption
cn
E (J) Component number n energy consumption
s
E (J) Station energy consumption
sn
E (J) Station number n energy consumption
cn
K e-KPI for component number n
l
K ((J/sec/unit) e-KPI for production line sn
K (J/cycle/unit) e-KPI for station number n
cn
K Averaged e-KPI for component number n
sn
K (J/cycle/unit) Averaged e-KPI for station number n
m(cycle) Number of cycle times
sn
Q (unit) The quantity of products produced at station number n
l
Q(unit) The quantity of products in a standard shift
c
P(watt) Component power consumption
0
t (sec) The time at which process or component starts
c
T (sec) Cycle time
l
T(sec) Production line shift time
Once the components behaviour is simulated in a virtual engineering environment, the output power data represented as time series is produced, therefore numerical integration techniques are used to calculate component’s energy consumption which is:
0
.
c
T c t c
E
P dt
(1)Thus, the station power consumption becomes:
1 n s cn
i
E
E
(2)The component e-KPI is defined as:
cn cn
s
E
K
E
(3)Kcn is calculated for every component after every cycle
time of the station it belongs to. VE tools are responsible for providing the component energy consumption input data while the expert system calculates the station energy consumption depending on the station state according to the DES tool.
The station e-KPI is defined as:
sn sn
sn
E
K
mQ
(4)Ksn is calculated after every station cycle time and should
not fluctuate significantly around its average value as the number of products and accumulative energy consumption increase. The authors believe that such e-KPI will assess both energy efficiency and energy effectiveness as it considers both the production time and quantity.
In most cases, the number of cycle times is huge, therefore it is better to express the e-KPI of a component or a station with an averaged value and its standard deviation which is a good description of the behaviour. The forms of the averaged e-KPIs for the component and station respectively are:
[ (
), (
)]
cn cn cn
K
K
K
(5)[ ( ), ( )]
sn sn sn
K
K
K
(6)The production line e-KPI is defined as:
1 n
sn i l
l l
E
K
TQ
(7)Despite that the introduced e-KPIs: Kl, Ks, Kc are related
to the conventional energy consumption evaluation concepts, linking them to the VE and DES tools inside the expert system is novel in terms of the applicability and energy consumption data acquisition. Another important point is that these e-KPIs deal with the variation of energy performance at different levels, and it is well known that eliminating variation is an indicator of performance consistency, and dealing with it in the early stage serves as a preventive action rather than a corrective action later.
4.Case study
4.1.Case Description
The test case considered is a battery module assembly which consists of three identical module assembly stations (module 1), and three identical inspection stations – (module 2) (Fig. 3). Every station in module 1 is composed of three components, whereas every station in module 2 is composed of four components. Two module variants (a,b) are considered for the assembly and they are stored in a buffer area depending on the customer order. All stations considered have the capability to assemble both the module variants, however, the modules have different designs which necessitates a change in the fixtures used on both testing and inspection stations. The module assembly stations have a processing time of ta1 and tb1 and the welding stations have a
processing time of ta2 and tb2 for modules 1 and 2
respectively. The completed modules after assembly are stored in a buffer area from where the modules are collected for welding. The station states considered in this case study are: active, in-setup and idle. The test case modelled was processed in the expert system mentioned earlier, and the simulation is run for a total of 480 minutes (a standard shift).
Fig. 3. A scheme of the case study.
4.2.Data flow
The energy consumption values of the station components during the operational and idle phases are obtained from VueOne virtual modelling toolset as illustrated in Fig. 4. These values combined with the data passed from the DES that include the station status and the product type (Fig. 5) support the expert system in evaluating the e-KPIs based on the relations introduced earlier. For the clarity, a data sample of 250 seconds is previewed in the figures 4 and 5.
Fig. 4. Energy consumption for the station and component.
Fig. 5. Station states and products as obtained from DES environment.
4.3.Results and discussion
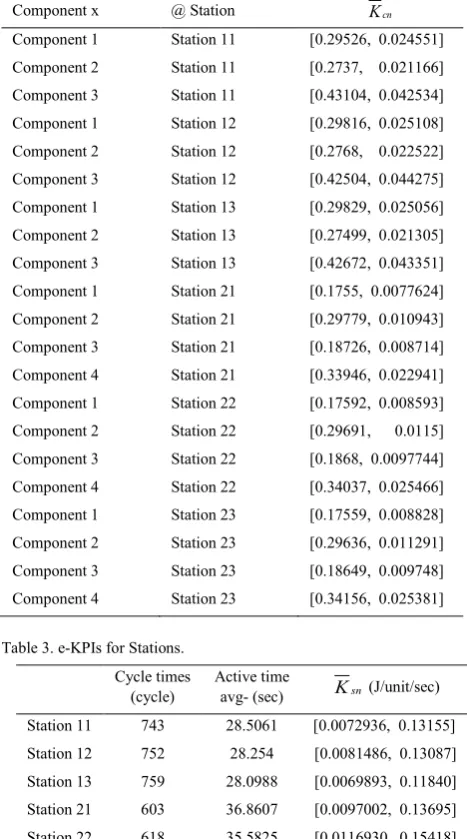
Table 2. e-KPIs for components (Station ij = Station i in module j).
Component x @ Station Kcn
Component 1 Station 11 [0.29526, 0.024551]
Component 2 Station 11 [0.2737, 0.021166]
Component 3 Station 11 [0.43104, 0.042534]
Component 1 Station 12 [0.29816, 0.025108]
Component 2 Station 12 [0.2768, 0.022522]
Component 3 Station 12 [0.42504, 0.044275]
Component 1 Station 13 [0.29829, 0.025056]
Component 2 Station 13 [0.27499, 0.021305]
Component 3 Station 13 [0.42672, 0.043351]
Component 1 Station 21 [0.1755, 0.0077624]
Component 2 Station 21 [0.29779, 0.010943]
Component 3 Station 21 [0.18726, 0.008714]
Component 4 Station 21 [0.33946, 0.022941]
Component 1 Station 22 [0.17592, 0.008593]
Component 2 Station 22 [0.29691, 0.0115]
Component 3 Station 22 [0.1868, 0.0097744]
Component 4 Station 22 [0.34037, 0.025466]
Component 1 Station 23 [0.17559, 0.008828]
Component 2 Station 23 [0.29636, 0.011291]
Component 3 Station 23 [0.18649, 0.009748]
Component 4 Station 23 [0.34156, 0.025381]
Table 3. e-KPIs for Stations. Cycle times
(cycle) Active time avg- (sec) Ksn (J/unit/sec)
Station 11 743 28.5061 [0.0072936, 0.13155]
Station 12 752 28.254 [0.0081486, 0.13087]
Station 13 759 28.0988 [0.0069893, 0.11840]
Station 21 603 36.8607 [0.0097002, 0.13695]
Station 22 618 35.5825 [0.0116930, 0.15418]
Station 23 614 35.487 [0.0221420, 0.3643]
Table 4. e-KPIs for the production line.
Product a Product b Kl(J/sec/unit)
automation device (i.e. actuator, sensor) with its own computing hardware (processor, memory, communication interface electronic interface to the automation device) and control software (application programs, operating system and communication protocol)”[21].
The component energy to be plugged into the expert system is classified into (Fig. 2) [10]:
Variable: ready for the moving components or machining for the material removing components.
[image:5.595.323.531.82.190.2] Constant: base when energy is a function of operation time or idle that represents the losses due to drive inefficiency (η is the drive efficiency).
Fig. 2. Classification of component energy consumption [10].
The nomenclature used in the following sections is illustrated below in Table 1.
Table 1. Nomenclature.
c
E (J) Component energy consumption
cn
E (J) Component number n energy consumption
s
E (J) Station energy consumption
sn
E (J) Station number n energy consumption
cn
K e-KPI for component number n
l
K ((J/sec/unit) e-KPI for production line sn
K (J/cycle/unit) e-KPI for station number n
cn
K Averaged e-KPI for component number n
sn
K (J/cycle/unit) Averaged e-KPI for station number n
m(cycle) Number of cycle times
sn
Q (unit) The quantity of products produced at station number n
l
Q(unit) The quantity of products in a standard shift
c
P(watt) Component power consumption
0
t (sec) The time at which process or component starts
c
T (sec) Cycle time
l
T(sec) Production line shift time
Once the components behaviour is simulated in a virtual engineering environment, the output power data represented as time series is produced, therefore numerical integration techniques are used to calculate component’s energy consumption which is:
0
.
c
T c t c
E
P dt
(1)Thus, the station power consumption becomes:
1 n s cn
i
E
E
(2)The component e-KPI is defined as:
cn cn
s
E
K
E
(3)Kcn is calculated for every component after every cycle
time of the station it belongs to. VE tools are responsible for providing the component energy consumption input data while the expert system calculates the station energy consumption depending on the station state according to the DES tool.
The station e-KPI is defined as:
sn sn
sn
E
K
mQ
(4)Ksn is calculated after every station cycle time and should
not fluctuate significantly around its average value as the number of products and accumulative energy consumption increase. The authors believe that such e-KPI will assess both energy efficiency and energy effectiveness as it considers both the production time and quantity.
In most cases, the number of cycle times is huge, therefore it is better to express the e-KPI of a component or a station with an averaged value and its standard deviation which is a good description of the behaviour. The forms of the averaged e-KPIs for the component and station respectively are:
[ (
), (
)]
cn cn cn
[image:5.595.315.549.273.693.2] [image:5.595.63.239.373.441.2] [image:5.595.57.271.604.710.2]K
K
K
(5)[ ( ), ( )]
sn sn sn
K
K
K
(6)The production line e-KPI is defined as:
1 n
sn i l
l l
E
K
TQ
(7)Despite that the introduced e-KPIs: Kl, Ks, Kc are related
to the conventional energy consumption evaluation concepts, linking them to the VE and DES tools inside the expert system is novel in terms of the applicability and energy consumption data acquisition. Another important point is that these e-KPIs deal with the variation of energy performance at different levels, and it is well known that eliminating variation is an indicator of performance consistency, and dealing with it in the early stage serves as a preventive action rather than a corrective action later.
4.Case study
4.1.Case Description
The test case considered is a battery module assembly which consists of three identical module assembly stations (module 1), and three identical inspection stations – (module 2) (Fig. 3). Every station in module 1 is composed of three components, whereas every station in module 2 is composed of four components. Two module variants (a,b) are considered for the assembly and they are stored in a buffer area depending on the customer order. All stations considered have the capability to assemble both the module variants, however, the modules have different designs which necessitates a change in the fixtures used on both testing and inspection stations. The module assembly stations have a processing time of ta1 and tb1 and the welding stations have a
processing time of ta2 and tb2 for modules 1 and 2
respectively. The completed modules after assembly are stored in a buffer area from where the modules are collected for welding. The station states considered in this case study are: active, in-setup and idle. The test case modelled was processed in the expert system mentioned earlier, and the simulation is run for a total of 480 minutes (a standard shift).
Fig. 3. A scheme of the case study.
4.2.Data flow
The energy consumption values of the station components during the operational and idle phases are obtained from VueOne virtual modelling toolset as illustrated in Fig. 4. These values combined with the data passed from the DES that include the station status and the product type (Fig. 5) support the expert system in evaluating the e-KPIs based on the relations introduced earlier. For the clarity, a data sample of 250 seconds is previewed in the figures 4 and 5.
Fig. 4. Energy consumption for the station and component.
Fig. 5. Station states and products as obtained from DES environment.
4.3.Results and discussion
Table 2. e-KPIs for components (Station ij = Station i in module j).
Component x @ Station Kcn
Component 1 Station 11 [0.29526, 0.024551]
Component 2 Station 11 [0.2737, 0.021166]
Component 3 Station 11 [0.43104, 0.042534]
Component 1 Station 12 [0.29816, 0.025108]
Component 2 Station 12 [0.2768, 0.022522]
Component 3 Station 12 [0.42504, 0.044275]
Component 1 Station 13 [0.29829, 0.025056]
Component 2 Station 13 [0.27499, 0.021305]
Component 3 Station 13 [0.42672, 0.043351]
Component 1 Station 21 [0.1755, 0.0077624]
Component 2 Station 21 [0.29779, 0.010943]
Component 3 Station 21 [0.18726, 0.008714]
Component 4 Station 21 [0.33946, 0.022941]
Component 1 Station 22 [0.17592, 0.008593]
Component 2 Station 22 [0.29691, 0.0115]
Component 3 Station 22 [0.1868, 0.0097744]
Component 4 Station 22 [0.34037, 0.025466]
Component 1 Station 23 [0.17559, 0.008828]
Component 2 Station 23 [0.29636, 0.011291]
Component 3 Station 23 [0.18649, 0.009748]
Component 4 Station 23 [0.34156, 0.025381]
Table 3. e-KPIs for Stations. Cycle times
(cycle) Active time avg- (sec) Ksn (J/unit/sec)
Station 11 743 28.5061 [0.0072936, 0.13155]
Station 12 752 28.254 [0.0081486, 0.13087]
Station 13 759 28.0988 [0.0069893, 0.11840]
Station 21 603 36.8607 [0.0097002, 0.13695]
Station 22 618 35.5825 [0.0116930, 0.15418]
Station 23 614 35.487 [0.0221420, 0.3643]
Table 4. e-KPIs for the production line.
Product a Product b Kl(J/sec/unit)
Tables 2, 3 and 4 show the e-KPIs calculated by the expert system for each of the components, stations and the production line respectively. Based on the obtained data, it can be seen that the main benefits of predicting energy consumption in early design phase and finding e-KPIs are: Identifying the components that are energy-inefficient
due to their inefficient parameters or long idle time. Identifying the energy consuming processes caused by a
poor buffer design.
Deciding what alternatives are available in terms of the component replacement or the process scenario (re)design or (re)configuration.
Predicting the energy consumption resulting from the interaction of several processes.
Removing uncertainties of energy consumption fluctuation in relation with the production rate.
In spite of its pros, the introduced approach still faces some challenges to overcome:
1. The fluctuation of cycle time which is a common issue in industry and eventually affects the energy consumption. Therefore, inaccurate physical behaviour modelling in the VE tool leads to misleading e-KPIs.
2. Finding the mathematical distribution function that models as closely as possible the actual behaviour of the events. 3. The significant computational cost of the multi-station production line VE model that yields a complicated model to be processed. However, the growth of computational capabilities and their availability for industrial use are increasing due to cloud technology in manufacturing. Consequently, it is convenient to link the expert system to the cloud seeking a better processing performance.
5.Conclusion and future work
In this paper, a framework of integrating VE with DES in an expert system that supports energy efficient design was introduced. The insights and expected outcomes this approach provides were illustrated in a case study. The e-KPIs presented here consider the component, station and production line levels. Therefore they assist system designers in process engineering and component selection on the basis of both productivity and sustainability.
Regarding the limitation highlighted previously, the future work aims at optimising the process design for a more general form of the production line, and taking into account the stochasticity in processes’ cycle time that affects energy consumption. Furthermore, the mathematical relation between component energy consumption behaviour and its virtual model will be investigated from the perspective of cyber-physical systems.
Acknowledgement
The authors acknowledge the support of UK Engineering and Physical Sciences Research Council (EPSRC) through the Knowledge-Driven Configurable Manufacturing (KDCM)
research project under the Flexible and Reconfigurable Manufacturing Initiative. (Ref: EP/K018191/1).
References
[1] EIA, International Energy Outlook 2017. 2017.
[2] Zhu Q, Lujia F, Mayyas A, Omar M, Al-Hammadi Y, and Al Saleh S, Production energy optimization using low dynamic programming, a decision support tool for sustainable manufacturing.J Clean Prod, 2015. 105: p. 178-183.
[3] May G, Barletta I, Stahl B, and Taisch M, Energy management in production: A novel method to develop key performance indicators for improving energy efficiency.Appl Energy, 2015. 149: p. 46-61. [4] Schulze M, Nehler H, Ottosson M, and Thollander P, Energy
management in industry–a systematic review of previous findings and an integrative conceptual framework. J Clean Prod, 2016. 112: p. 3692-3708.
[5] Mashaei M and Lennartson B, Energy Reduction in a Pallet-Constrained Flow Shop Through On–Off Control of Idle Machines. IEEE Trans Autom Sci Eng, 2013. 10(1): p. 45-56.
[6] Cataldo A, Scattolini R, and Tolio T, An energy consumption evaluation methodology for a manufacturing plant.CIRP J Manuf Sci Techno, 2015. 11: p. 53-61.
[7] Caggiano A, Marzano A, and Teti R, Sustainability Enhancement of a Turbine Vane Manufacturing Cell through Digital Simulation-Based Design.Energies, 2016. 9(10): p. 790.
[8] Neugebauer R, Wittstock V, Meyer A, Glänzel J, Pätzold M, and
Schumann M, VR tools for the development of energy-efficient products.CIRP J Manuf Sci Techno, 2011. 4(2): p. 208-215. [9] Pelliccia L, Klimant P, Schumann M, Pürzel F, Wittstock V, and Putz
M, Energy Visualization Techniques for Machine Tools in Virtual Reality.Procedia CIRP, 2016. 41: p. 329-333.
[10] Ahmad M a H, Ahmad B, Vera D, and Harrison R. An innovative energy predictive process planning tool for assembly automation systems. in Industrial Electronics Society, IECON 2015-41st Annual Conference of the IEEE. 2015. IEEE.
[11] Kollatsch C, Schumann M, Klimant P, Wittstock V, and Putz M,
Mobile Augmented Reality Based Monitoring of Assembly Lines.
Procedia CIRP, 2014. 23: p. 246-251.
[12] Thiede S, Energy efficiency in manufacturing systems. 2012: Springer Science & Business Media.
[13] Pach C, Berger T, Sallez Y, Bonte T, Adam E, and Trentesaux D, Reactive and energy-aware scheduling of flexible manufacturing systems using potential fields.Comput Ind, 2014. 65(3): p. 434-448. [14] Shrouf F, Ordieres J, and Miragliotta G. Smart factories in Industry
4.0: A review of the concept and of energy management approached in production based on the Internet of Things paradigm. in Industrial Engineering and Engineering Management (IEEM), 2014 IEEE International Conference on. 2014. IEEE.
[15] May G, Stahl B, Taisch M, and Kiritsis D, Energy management in manufacturing: From literature review to a conceptual framework.J Clean Prod, 2016.
[16] Peruzzini M and Pellicciari M. Models of Impact for Sustainable Manufacturing. in ISPE TE. 2016.
[17] Bornschlegl M, Bregulla M, and Franke J, Methods-Energy
Measurement – An approach for sustainable energy planning of
manufacturing technologies.J Clean Prod, 2016. 135: p. 644-656. [18] Uluer M U, Unver H O, Gok G, Fescioglu-Unver N, and Kilic S E, A
framework for energy reduction in manufacturing process chains (E-MPC) and a case study from the Turkish household appliance industry. J Clean Prod, 2016. 112: p. 3342-3360.
[19] Harrison R, Vera D, and Ahmad B, Engineering Methods and Tools for Cyber-Physical Automation Systems. Proceedings of the IEEE, 2016. 104(5): p. 973-985.
[20] Turner C J, Hutabarat W, Oyekan J, and Tiwari A, Discrete event simulation and virtual reality use in industry: New opportunities and future trends.IEEE Trans Hum Mach Syst, 2016. 46(6): p. 882-894. [21] Lee S-M, Harrison R, and West A A. A component-based distributed