warwick.ac.uk/lib-publications
Manuscript version: Author’s Accepted Manuscript
The version presented in WRAP is the author’s accepted manuscript and may differ from the
published version or Version of Record.
Persistent WRAP URL:
http://wrap.warwick.ac.uk/108755
How to cite:
Please refer to published version for the most recent bibliographic citation information.
If a published version is known of, the repository item page linked to above, will contain
details on accessing it.
Copyright and reuse:
The Warwick Research Archive Portal (WRAP) makes this work by researchers of the
University of Warwick available open access under the following conditions.
Copyright © and all moral rights to the version of the paper presented here belong to the
individual author(s) and/or other copyright owners. To the extent reasonable and
practicable the material made available in WRAP has been checked for eligibility before
being made available.
Copies of full items can be used for personal research or study, educational, or not-for-profit
purposes without prior permission or charge. Provided that the authors, title and full
bibliographic details are credited, a hyperlink and/or URL is given for the original metadata
page and the content is not changed in any way.
Publisher’s statement:
Please refer to the repository item page, publisher’s statement section, for further
information.
Influence of External Heat Sources on Volumetric Thermal
Errors of Precision Machine Tools
Lingtao Wenga, Weiguo Gaoa, *, Zhanshan Lvb, Dawei Zhanga, *, Teng Liuc, Yu Wanga, Xiangyang Qid, Yanling Tiana, e
a Key Laboratory of Mechanism Theory and Equipment Design of Ministry of Education, Tianjin
University, Tianjin 300354, China
b.Sinochem Jilin Changshan Chemical CO.,LTD, Songyuan, Jilin 131199, China
c School of Mechanical Engineering, Hebei University of Technology, Tianjin 300130, China d School of Mechanical Engineering, Tianjin Polytechnic University, Tianjin 300387, China
e School of Engineering, The University of Warwick, Coventry CV4 7AL, UK
* Corresponding author. Tel./fax: +86 22 27405561. E-mail addresses: [email protected] (W. Gao).
Tel./fax: +86 22 27405561. E-mail addresses: [email protected] (D. Zhang).
Nomenclature
HIS internal heat source EHS external heat source
ECC electronic control cabinet HPS hydraulic pump station
Abstract
Volumetric accuracy is susceptible to thermal gradient that caused by internal heat source (IHS) and
external heat source (EHS). In this paper, a temperature-structure multi-step calculation method is
presented to investigate the influences of EHSs on volumetric thermal errors. Simulations are computed to study the effects of different EHSs on a machine tool and series of validating experiments are carried
out to verify the modeling method. The tool tip deviations that occur in both simulation and experiment by EHSs effects are showed in this paper. The test results in specific position and working condition
revealed that EHSs contribute 53%, 21% and 68% of thermal deviations in X, Y and Z directions individually. Thus, it becomes fairly apparent that the EHS is an important factor which can significantly
affect the volumetric accuracy.
The methods provided in this paper are valuable for machine tool designers to evaluate the EHS effects
on volumetric thermal errors during designing process; furthermore, some insulating measures are
suggested to improve the accuracy and accuracy stability of precision machine tools by reducing the EHS influences.
Keywords
Thermal radiation, external heat source, precision machine tool, volumetric thermal error
1. Introduction
Thermal errors of machine tools are one of the main factors affecting CNC machine tool accuracy [1], which represent up to 70% of the total errors of machined pieces for precision machining, thereby this
problem is the focus of recent research studies [2-4]. Generally, heat sources can be broadly divided into
two parts, internal heat sources (IHSs) and external heat sources (EHSs). IHSs include all heat sources that are directly caused by machine tool, such as servosystem, spindle motor and cutting process, etc.
EHSs are mainly attribute to the environment in which the machine tool is installed and they affect machine tool through convection and thermal radiation. Most of the studies focus on machine tool
insufficient. However, the impacts of EHS are non-negligible, especially for thermal sensitive precision
machine tools. Therefore, it is significant to investigate the influences of EHS on precision machine tools.
EHS mainly include ambient temperature, lamp, electronic control cabinet (ECC), hydraulic pump station (HPS), etc. Different from IHSs, EHSs affect machine tool temperature through convection and
thermal radiation. Some researchers investigated the impacts of environment temperature perturbation on machine tools and established some thermal characteristic models. Zhang [9] proposed analytical
approaches of time domain and frequency domain to analyze the influence of time-varying environment temperature on machine tool thermal error. For simplicity, author decomposed the machine tool into
several units composed of relatively simple structures, then calculated the overall thermal error transfer function. However, thermal gradients result in machine tool non-linear structure deformation. Hence, the
simplification in this paper is not suitable for precision machine tool thermal error modeling. Finite
element analysis (FEA) is an efficient calculation method which is widely used in machine tool temperature and deformation prediction. Mian [10] studied the effect of ambiance temperature swings
on machine tool deformation by FEA. The presented modeling methodology observably reduced the machine downtime required to establish the thermal response. Regrettably, other EHSs which affect
machine tool through thermal radiation were leave out of the consideration. Tan [11] further studied the environment thermal hysteresis effects and brought up a time-varying analytical model between
environment temperature and thermal error of large machine tools using Fourier synthesis, time series and the Newton cooling law. Further, the experiment verifies that the ambient temperature has a
significant influence on heavy-duty machine tool. However, other EHSs impacts such as lamps, ECC,
HPS have not been discussed. Based on fiber Bragg grating sensing technology, Huang [12] measured real-time temperature and deformation filed of a heavy-duty machine tool. Experiments results indicated
that the surface temperature and spindle thermal error have a similar change trend following the ambient temperature. Since this paper is focused on measurement methodology, thermal error prediction method
has not been presented. Glänzel [13] proposed a novel method to provide the heat transfer parameters quickly and efficiently for transient environmental conditions. Furthermore, the temperature and heat
transfer coefficient of column and the velocity and temperature of surrounding air were simulated. However, the deformations of machine tool have not been calculated. In general, the impacts of ambient
temperature on machine tools have been investigated in previous studies while other EHSs convection
and thermal radiation effects on machine tools still lack of systematic studies.
However, it has been validated that convection and thermal radiation have significant impacts on
objects temperature distribution [14-15]. Wang [16] investigated the effects of convection and radiation from a high-temperature source on the thermal environment in an industrial building. The influences of
various surface emissivity, Grashof and Nusselt numbers on simulation results are discussed. Meng [17]
further studied the effects of radiation on predictive accuracy in the numerical simulations of industrial buildings. Simulation results showed that the overall temperature had great difference between a pure
convection model and the combined convection and radiation model. However, both papers have not studied the impacts of heat sources on other objects. Arslanoglu [18] investigated the effect of radiation
heat flux from lights lamps on human thermal comfort by both experimental and theoretical approaches. In addition, Kalmár [19] found that mean radiant temperature has a parabolic variation with the room
height and length, therefore for a room shape there is a certain height for which the mean radiant temperature is minimum. Unfortunately, these methodologies and conclusions could not be used in
machine tools directly. Besides, the published papers still have not systematically investigated the
impacts of EHSs thermal radiation on machine tools.
This section has illustrated the previous studies about environment temperature and thermal radiation
impacts. In addition, the insufficient of the studies about EHSs effects on machine tools are highlighted. Hence, the aim of this paper is to analyze the effects of EHS on machine tool. The thermal radiation
structure thermal deformation, the volumetric thermal error distribution under different single and
combined EHS are discussed in Section 3. Modeling method and its predicting accuracy are verified by
experiments in Section 4. Section 5 gives some conclusions and suggestions to improve machine tool accuracy and accuracy stability.
2. Thermal radiation analysis and modeling method
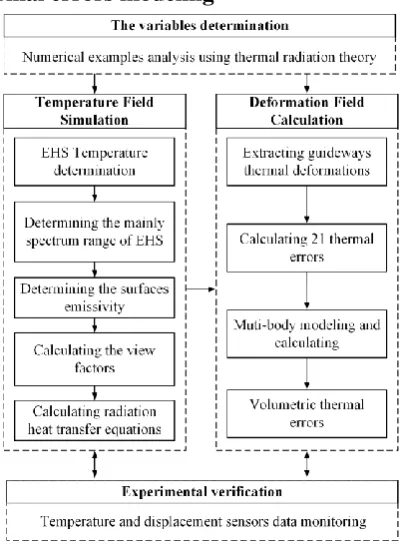
[image:4.595.197.400.161.434.2]2.1 EHS induced thermal errors modeling
Fig. 1 Flowchart for temperature-structure multi-step calculation method
Machine tool temperature field and machining precision are affected by EHS through radiative heat
transfer. In order to analyze the influences of EHS, this paper presented a temperature-structure
multi-step calculation method based on finite element method, heat transfer theory and multi-body thermal error modeling theory. The temperature-structure multi-step calculation method mainly includes two
parts, namely temperature simulation and deformation simulation, as given in Fig. 1. In order to investigate the effects of EHSs on machine tool, the study variables should be determined first. Some
thermal radiation theories and a numerical case are therefore presented in section 2.2 to illustrate what and why we chose these variables as study objects.
Temperature simulation need to determine the thermal boundary conditions first, including EHS temperatures, spectrum ranges of EHSs, emissivity, etc. And the corresponding heat transfer between
EHSs and a machine tool can be computed then. Since machine tool is a complicated mechanical system,
it is hard to obtain the heats variations between EHS and the machine tool by analytical method. In order to facilitate the temperature and structural simulation analysis, Fluent and ANSYS are used to investigate
the machine tool temperature and structure variations.
In addition, since it is time consuming for ANSYS to simulate the thermal deviations in whole working
volume, the multi-body modeling method is proposed in section 2.4 to obtain the volumetric thermal
errors. Furthermore, experiments are taken then to verify the results calculated in temperature-structure multi-step calculation method.
2.2 Theory analyses for the effects of key variables on radiative heat transfer
2.2.1 Thermal radiation calculation process between two surfaces
corresponding radiation energy transfer can be obtained by Stefan-Boltzmann and Lambert laws using: θ1 29° θ1 θ2 A1 A2 dA1 dA2
Fig. 2 Thermal radiation between surface A1 and A2
4 4
1 2
12 fA1 1 2
100 100
T T
Φ
X
(1)
where f is the system emissivity, A1 is the area of surface 1, σ=5.67 W/m2•K4 is the black body radiation coefficient, Ti is the temperature of surface i and Xi-j is the view factor from surface Ai to surface Aj.
The value of
f is calculated as followsf
1 2 1 2 1 2
1
1 X (1/ 1) X (1/ 1)
(2)
where i is the emissivity of surface i.
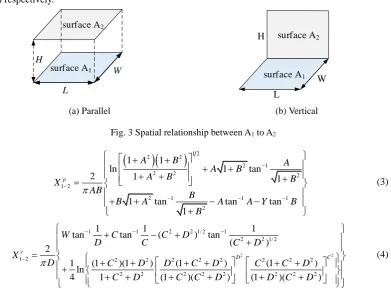
Parallel and vertical are two mainly spatial relationships between two surfaces. In practice, the view factors between surface A1 and surface A2 plotted in Fig. 3 (a) and (b) can be written in form Eq. (3) and
Eq. (4) respectively.
L
W H
surface A1 surface A2
L
W H surface A2
surface A1
[image:5.595.116.508.452.742.2](a) Parallel (b) Vertical
Fig. 3 Spatial relationship between A1 to A2
1 22 2
2 1
2 2 2
1 2
2 1 1 1
2
1 1
ln 1 tan
2 1 1
1 tan tan tan
1
p
A B A
A B
A B B
X
AB B
B A A A Y B
B (3) 2 2
1 1 2 2 1/ 2 1
2 2 1/ 2
1 2 2 2 2 2 2 2 2 2
2 2 2 2 2 2 2 2
1 1 1
tan tan ( ) tan
( )
2
1 (1 )(1 ) (1 ) (1 )
ln
4 1 (1 )( ) (1 )( )
v
D C
W C C D
D C C D
X
D C D D C D C C D
C D C C D D C D
(4)
where 1 2p
X is the view factor between two parallel surfaces, 1 2v
vertical surfaces, L is the length of surface 1, W is the width of surface 1, H is the height of surface 2,
A=L/H, B=W/H, C=H/L, D=W/L.
2.2.2 Numerical comparison under different heat source temperature and distance
According to Eq. (1) - (4), the radiative energy between surfaces Ai and Aj is mainly determined by
Xi(j)-j(i), Ti(j) and
f . For a given machine tool, the
f is one of the material intrinsic property. However,the view factor Xi(j)-j(i) is a variable parameter which is greatly depends on the distance h between surface
i and surface j. In addition, the temperatures T of EHSs are various and the effects of EHSs are different. In order to compare the effects of h and T and select the best study variables, numerical examples are calculated as follows.
An ideal constant temperature room model is presented in Fig. 4 (a). Since the lamps are mounted in the ceiling and generate heats, surface 1 is deemed as the heat source and the temperature of Tt and the room height H are chosen as variables. In order to illustrate the impacts of Tt or H on radiation heat transfer, the various net radiations of surfaceswith different Tt or H are calculated in following numerical cases. The temperatures, emissivity and the sizes of surfaces in each case are listed in Table 1, where Ts
is the wall temperature,
s is the wall emissivity.L
W
H
Tt, εt
Ts, εs
Ts, εs
Ts, εs
Ts, εs
Tb, εb
1 4 3 5 6 2
(a) Geometry model (b) Equivalent network
Fig. 4 Example model and equivalent network sketch
Table 1 Numerical calculation boundary condition
Constant Parameters Variable
Ts [℃] Tb [℃] εs εb εt L [m] W [m] Tt [℃] H [m]
Case 1 20 20 0.8 0.8 0.9 5 4 22 3
Case 2 20 20 0.8 0.8 0.9 5 4 23 3
Case 3 20 20 0.8 0.8 0.9 5 4 22 4
Take case 1 for example, the view factors matrix X is determined using Eq. (3) and (4).
1 1 1 2 1 3 1 4 1 5 1 6
2 1 2 2 2 3 2 4 2 5 2 6
3 1 3 2 3 3 3 4 3 5 3 6
4 1 4 2 4 3 4 4 4 5 4 6
5 1 5 2 5 3 5 4 5 5 5 6
6 1 6 2 6 3 6 4 6 5 6 6
0 0.1910 0.1508 0.1910 0.1508 0.3163
0.
=
X X X X X X
X X X X X X
X X X X X X
X
X X X X X X
X X X X X X
X X X X X X
2547 0 0.1522 0.1864 0.1522 0.2547
0.2514 0.1902 0 0.1902 0.1168 0.2514
0.2547 0.1864 0.1522 0 0.1522 0.2547
0.2514 0.1902 0.1168 0.1902 0 0.2514
0.3163 0.1910 0.1508 0.1910 0.1508 0
(5)
The net radiation of surface i can be defined as Eq. (6) and network method of radiation heat exchange demonstrated in Fig. 4 (b) is used to calculate the net radiation Φi of each surface i. Besides, Kirchhoff’s law is used to formulize the solving equations:
, 1,
i i j
j i j
Φ
Φ
(6)Eb1=σT14
J1
Eb2=σT24
Eb3=σT34
Eb4=σT44
Eb5=σT54
Eb6=σT64
J2 J3 J4 J5 J6 5 5 5 5 1 eq R A 4 4 44 1 eq R A 3 3 3 3 1 eq R A 2 2 22 1 eq R A ' 5 6
55 6
1 eq R A X ' 4 5
4 4 5
1 eq R A X ' 3 4
3 3 4
1 eq R A X ' 2 3
2 2 3
1 eq R A X 1 1 1 1 1 eq R A 6 6 6 6 1 eq R A ' 1 6
11 6
1 eq R A X ' 1 4 eq R ' 1 5 eq R ' 1 3 eq R ' 2 4 eq R ' 2 5 eq R ' 3 5 eq R ' 3 6 eq R ' 4 6 eq R ' 2 6 eq R ' 1 2
11 2
6
1,
- , ( 1, 2,..., 6)
1- 1
bi i
i j j bi
j j i
i i
E
X J
E i
(7)Subsequently, the net radiation Φi can be obtained by Eq. (8), and the whole cases results are given
in Table 2.
( )
, ( 1, 2,..., 6) 1
bi i i i
i
i
E J A
Φ
i
(8)
Table 2 Net radiation Фi results
Ф1 [W] Ф2 [W] Ф3 [W] Ф4 [W] Ф5 [W] Ф6 [W]
Case 1 196.2 -38.9 -30.0 -38.9 -30.0 -59.1
Case 2 295.4 -58.1 -45.3 -58.1 -45.3 -89.5
Case 3 198.7 -31.4 -25.4 -31.4 -25.4 -44.0
From Table 2, the net radiation Φi various with different T1 and H. Take surface 6 as study object,
Ф6 decreases 25% with H increases 1m and increases 51% with T1 rises 1℃. The net radiation is enormously affected by the various distance and temperature. Therefore, the EHSs temperatures and the
distances between EHSs and the machine tool are taken as key variable parameters in this paper. Furthermore, detailed simulations and calculations are implemented focus on the effects of these two
parameters.
2.3 Structure deformation simulation and volumetric thermal error modeling
2.3.1 21 thermal errors calculating based on the guideways deformations
Multi-body method is a general error modeling method which is widely used in geometric volumetric error modeling [20-21]. The temperature-structure multi-step calculation method presented in this paper
is based on this method and the mainly modeling process are as follows:
(1) Simulated the machine tool structure thermal deformations after the temperature field simulation.
(2) Extracted the guideways deformations from the structure deformation simulation results. (3) Obtained the thermal deviations of reference coordinates of guideways.
(4) Calculated the 21 thermal errors based on guideways deformation.
(5) Calculated the volumetric thermal errors based on multi-body theory.
2.3.2 Thermal error modeling based on multi-body theory
Based on homogenous transformation matrices, multi-body theory can be used in machine tool error
modeling from 21 thermal errors to volumetric errors. Fig. 5 exhibits the machine tool topological sketch and its kinetic model can be obtained by homogenous transformation matrices. Assuming the real tool
point and the ideal tool point are defined as Eq. (8) and Eq. (9).
0-Body 1-Rotary table 2-Worktable 3-Column 4-Slide table R X Z Work space o2 o1 o0 o3 o4 5-Spindle 6-Tool Y o6 o5
Pt=[Ptx,Pty,Ptz,1]T (8)
idealP
w=[idealPw,x, idealPwy, idealPwz,1]T (9)
In the ideal machining situation,
T
b-tP =
tT
b-widealP
w, where Tb-t is the transformation matrices frombody to tool point, Tb-w is the transformation matrices from body to workpiece point. The transformation
matrix from body i to adjacent body j has the matrix form Eq. (10).
1 0 0 0 1 0 0 0 1 0 0 0 1
x y z ij T (10)
However, errors in real machining process are inevitable. Therefore, the relationship between real machining position and the ideal tool point is found out through the formula Eq. (11).
real
1w t
P e e P
b-w b-t
T T (11)
Where e
T
b- w and eT
b-t can be derived from Eq. (12) and Eq. (13).worlpiece
bed
e p p s s
b - w ij ij ij ij
p p s s p p s s
01 01 01 01 12 12 12 12
T T ΔT T ΔT
T ΔT T ΔT T ΔT T ΔT
(12) Tool bed
e p p s s
b - t ij ij ij ij
p p s s p p s s p p s s p p s s
03 03 03 03 34 34 34 34 45 45 45 45 56 56 56 56
T T ΔT T ΔT
T ΔT T ΔT T ΔT T ΔT T ΔT T ΔT T ΔT T ΔT
(13)
Where p ij
T refers to ideal static homogenous transformation matrix, s ij
T refers to the ideal motion
homogenous transformation matrix, ΔTijp refers to the static error homogenous transformation matrix,
s ij
ΔT refers to the motion error homogenous transformation matrix. And these homogenous
transformation matrices can be calculated by Eq. (14).
1
-1
-- 1
0 0 0 1
x y z ij ΔT (14)
And the final machining error Δe is represented as follows
ideal
w t
e
P
P
e
eb-w b-t
T
T
(15)3. Simulations and analyses of the effects of EHSs on a machine tool
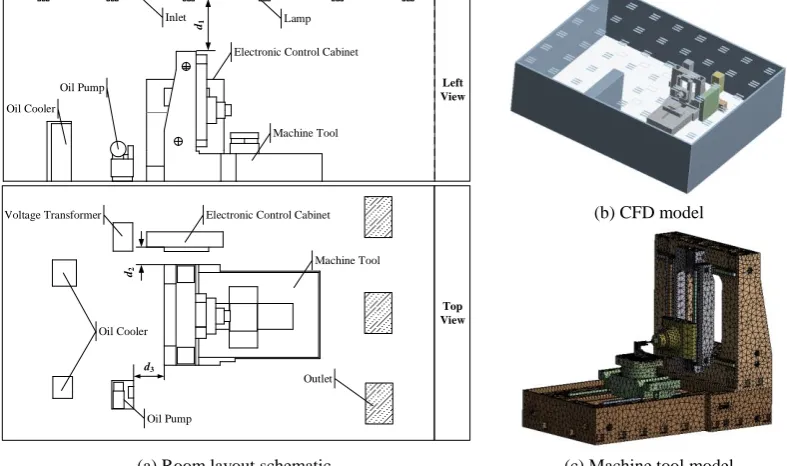
Two CAD models were created with the same geometry and dimensions to simulate the temperature and structure simulation respectively (see Fig. 6 (b) and (c)). Fig. 6 (a) is a layout sketch of a constant
temperature laboratory and the geometrical dimensions of EHS are presented in Table 3. Lamps and air
inlets are mounted in ceiling, meanwhile, the air outlets are in the ground. The ECC and HPS are arranged around the machine tool. Fig. 6 (b) is a thermostatic room model used for CFD simulation. Fig. 6 (c) is
a simplified model of JIG630 used for structural deformation simulation.
functions of near-wall treatment were chosen in viscous model simulation.
Fluent provides five radiative calculation models like Rosseland model, P1 model, Discrete Transfer
radiation model, Surface to Surface (S2S) model and Discrete Ordinates model. S2S model is easy to set up and has high calculation accuracy in the case where the medium does not participate in the radiation
heat transfer. The air in constant temperature room can barely absorb or scatter radiative energy. Therefore, S2S model was used to calculate the thermal radiation simulation.
d3
d2
Machine Tool Electronic Control Cabinet
Oil Pump Voltage Transformer
Oil Cooler
Lamp
d1
Left View
Top View
Machine Tool Oil Pump
Electronic Control Cabinet
Oil Cooler
Inlet
Outlet
(b) CFD model
[image:9.595.99.493.168.401.2] [image:9.595.92.505.455.535.2](a) Room layout schematic (c) Machine tool model Fig. 6 CAD models
Table 3 EHSs models geometrical dimensions
EHS Length [mm] Width [mm] Height [mm] Diameter [mm]
ECC 1750 350 2300 /
Pump station pedestal 700 600 500 /
Oil pump 500 / / 300
Lamp 550 / / 25
3.1 The simulated influences of single EHS on a machine tool
Lamp, ECC and pump station are three common EHSs. Furthermore, various EHSs temperatures Ti
and the distances di shown in Fig.7 have different effects on machine tool. In order to clarify the
influences of each EHS on a machine tool, detailed simulations are presented as follows and the CFD
boundary conditions are listed in Table 4.
Table 4 CFD boundary conditions
Inlet Wall Air
Temperature [℃]
Velocity [m/s]
Heat transfer Coefficient [w/m2·℃]
Density [kg / m3]
Thermal expansion coefficient [1/℃]
20 0.035 6 1.205 0.00366
3.1.1 Lamps radiation simulation
[image:9.595.88.507.648.714.2]conditions such as lamps temperature T1, the distance between lamps and machine tool d1, etc. are listed in Table 5. The lights can directly emit from lamps to the front side of bed or to the upper side of the
column, which means the view factors between lamps to these regions are bigger thereby these regions are heating up obviously. Furthermore, the caused thermal gradient can lead the machine deforms as Fig.
7 (b).
Y
Z X
[image:10.595.98.502.146.315.2] [image:10.595.90.506.382.431.2](a) Temperature field (T1 is 31℃ and d1 is 1000 mm) (b) Structure deformation schematic Fig. 7 Machine tool temperature distribution and the structure deformation with lamp radiation
Table. 5 Boundary conditions of lamps simulation
Simulation case 1 2 3 4 5 6 7 8 9
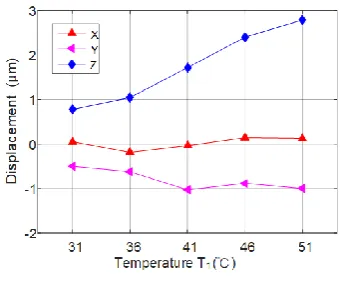
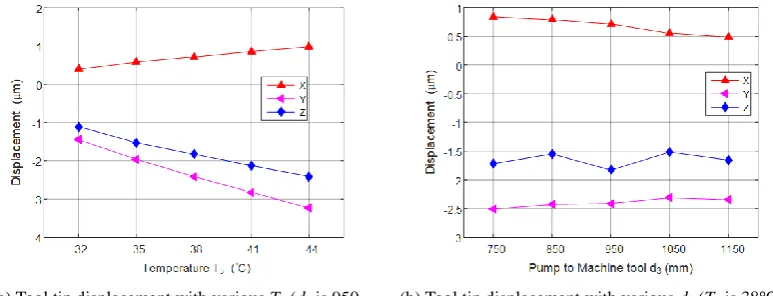
Lamps Temperature T1 [℃] 31 36 41 46 51 46 46 46 46 Distance d1 [mm] 1000 1000 1000 1000 1000 500 1500 2000 2500 Fig. 8 indicates the displacement variations of tool tip with various lamps temperatures T1 and distances d1. The increase of lamps temperature leads the tool tip leaning away from worktable in Z-direction. Further, the displacement in Z-direction increases about 0.7μm with the T1 rises 5℃. Similarly, the relative displacement in Z-direction between worktable and tool tip decreases with the distance d1 increases. And these variations mean that the column leans forward to worktable. However, due to the symmetrical structure of machine tool, the displacement barely changes in X and Y direction no matter
T1 increased or d1 decreased.
(a) Tool tip displacement with various T1 (d1 is
1000mm)
(b) Tool tip displacement with various d1 (T1 is 46℃)
Fig. 8 Influence of lamp on tool tip displacement
3.1.2 ECC thermal radiation simulation
ECC temperature T2 various with the different machine tool working condition changing and the distance d2 between ECC to machine tool is easy to adjust. The influences of various T2 and d2 on machine
Thermal Equilibrium State
[image:10.595.109.280.532.675.2] [image:10.595.315.488.534.666.2]tool are simulated in this section. Fig. 9 (a) illustrates the machine tool temperature distribution caused
by ECC and the key boundary conditions are listed in Table 6. On the whole, the temperature of machine
tool surfaces that closer to ECC are higher than other sides, thereby the column leans away from ECC and deforms backward at the same time, as demonstrated in Fig. 9 (b).
Y
Z
X
Thermal Equilibrium State Thermal Deformation
[image:11.595.102.502.132.290.2] [image:11.595.90.505.360.410.2](a) Temperature field (T2 is 21.3℃ and d2 is 450mm) (b) Structure deformation schematic Fig. 9 Machine tool temperature distribution and the structure deformation with ECC radiation
Table. 6 Boundary conditions of ECC simulation
Simulation case 1 2 3 4 5 6 7 8 9
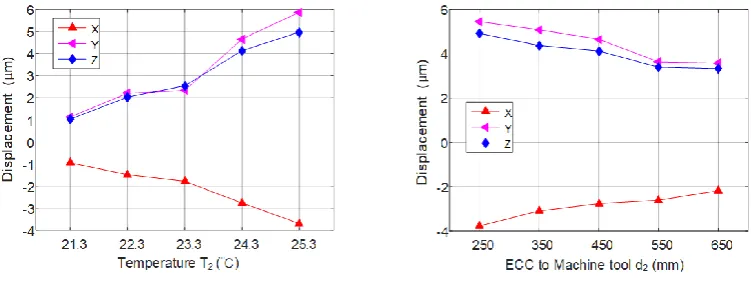
ECC Temperature T2 [℃] 21.3 22.3 23.3 24.3 25.3 25.3 25.3 25.3 25.3 Distance d2 [mm] 450 450 450 450 450 250 350 550 650 Spindle rear deforms in all X, Y and Z directions obviously with the ECC average temperature T2 rises as exhibited in Fig. 10 (a). According to Fig. 10 (b), the influences of increasing distance d2 between ECC and machine tool on tool tip displacement are smaller. In other words, the T2 rising 1℃ has similar effects on the displacement of tool tip with the d2 decreasing 200 mm. In addition, compare Fig. 10 with Fig. 8, the effects of distance d2 decreases 100mm are similar to lamps temperature T1 rises 10℃. Since
d2 is much smaller than d1, the corresponding view factor of ECC XECC_MT is bigger than which of lamps
XLamp_MT. Thus, machine tool temperature field is much more sensitive with the variation of ECC temperature than lamps’.
(a) Tool tip displacement with various T2 (d2 is 450
mm)
(b) Tool tip displacement with various d2 (T2 is
[image:11.595.111.487.526.667.2]25.3℃) Fig. 10 Influence of ECC on tool tip displacement
3.1.3 HPS thermal radiation simulation
The effects of ECC and HPS are similar since the emissive power of both ECC and HPS are concentrated in infrared band (see Fig. 9 and Fig. 11). HPS mainly affects the left back side of machine
machine tool under the influence of HPS. The column not only tilted forward worktable but also tilted
away from the pump station.
Y
Z X
Thermal Equilibrium State Thermal Deformation
[image:12.595.97.501.104.269.2] [image:12.595.91.506.340.389.2](a) Temperature field (T3 is 32℃ and d3 is 1050mm) (b) Structure deformation schematic Fig. 11 Machine tool temperature distribution and the structure deformation with pump radiation
Table. 7 Boundary conditions of HPS simulation
Simulation case 1 2 3 4 5 6 7 8 9
HPS Temperature T3 [℃] 32 35 38 41 44 38 38 38 38 Distance d3 [mm] 950 950 950 950 950 750 850 1050 1150
Fig.12 plotted the variation of tool tip displacement caused by diverse HPS temperatures T3 and distances d3. Relatively speaking, the variations of displacement in Y and Z direction are more obvious. Because of the Abbe effects, the displacement in X direction varies unapparent when spindle box is
located in negative limitation position. However, displacement in X direction will be more noticeable when spindle box moved to positive limitation position. Besides, the displacement variation is more
susceptible to the rising of temperature T3 than decreasing of distance d3.
(a) Tool tip displacement with various T3 (d3 is 950
mm)
(b) Tool tip displacement with various d3 (T3 is 38℃)
Fig. 12 Influence of pump station on tool tip displacement
3.2 The influences of synthetic external heat sources on workspace thermal errors
3.2.1 Temperature and structure deformation simulation
A synthetic calculation is carried out to analyze the impacts of comprehensive EHS on machine tool
[image:12.595.106.493.482.630.2]Table. 8 EHS thermal conditions
Lamps ECC HPS
Temperature [℃] 31 21.5 32
According to Fig.13, the temperature distribution under synthetic EHSs effects is approximately equal
to the superposition of each EHS. Further, the influences of lamps on machine tool are not so obvious as
the effects of the ECC and HPS. The temperature of the back side of a machine tool is higher than that of other parts, since the ECC and HPS are arranged near the back of the machine tool.
Y
Z X
Y Z X
[image:13.595.101.493.191.387.2](a) Front side (b) Back side
Fig. 13 Machine tool temperature under comprehensive EHS influence
3.2.2 Volumetric thermal error calculation using multi-body method
Deformations of all guideways are extracted after ANSYS structural simulation. Subsequently linear
and angular errors of each guideway and the volumetric thermal error can be calculated using multi-body method. According to ISO 230-6 [22], the working volume, three key paths X1X2, Y1Y2, Z1Z2 and two
body diagonals PPP and NPP are defined in Fig. 14. In addition, the calculated 21 errors of machine tool are depicted in Fig. 15.
[image:13.595.205.387.494.676.2](a) Thermal errors of X axis guideway (b) Thermal errors of Y axis guideway
(c) Thermal errors of Z axis guideway (d) Squareness errors
Fig. 15 21 thermal errors of machine tool
From demonstrated volumetric thermal error in Fig. 16, thermal errors in Y direction are relatively small,
while errors in X and Z directions are larger. Since the column and bed are heated by EHSs at the same time, thermal expansions of these parts are generated simultaneously, thereby the relative displacement
variation between tool tip and worktable in Y direction varied smaller than other two directions. Furthermore, the thermal error distribution in X direction is symmetric and it is caused by the layout of
ECC and HPS around the machine tool. Observing Fig. 16 (d), the region with the largest overall thermal error is located at the positive limitation position of the X, Y and Z guideways.
(c) Z directional thermal error (d) Total thermal error Fig. 16 Machine tool working volume thermal error under comprehensive EHS
Fig. 17 (a) – (c) show three directional thermal errors of paths X1X2, Y1Y2 and Z1Z2 which are defined
in Fig. 14. The thermal errors in their length directions varied most obviously, while the variations of thermal errors in other two directions are smaller. According to Fig. 17 (d) and (e), the thermal errors
curves of NPP and PPP are similar since the primary different of path NPP and PPP is the initial position of X axis. In addition, due to the Abbe effects, the thermal errors of both NPP and PPP gradually increase with the worktable moves along the positive direction of Y and Z guideways. Therefore, the maximum thermal error position is C7 and the minimum thermal error position is point O. Specifically, the
maximum total thermal error of working volume is 6.5μm and the minimum is 3μm.
(a) Y and Z directional thermal error of path X1X2 (b) X and Z directional thermal error of path Y1Y2
(e) PPP thermal error (f) Total thermal error of NPP and PPP
Fig. 17 Thermal errors in key paths
4. Experimental verification
4.1 Experimental setup and experiment process
The experimental tests were carried out on a JIG630 precision horizontal machine tool throughout
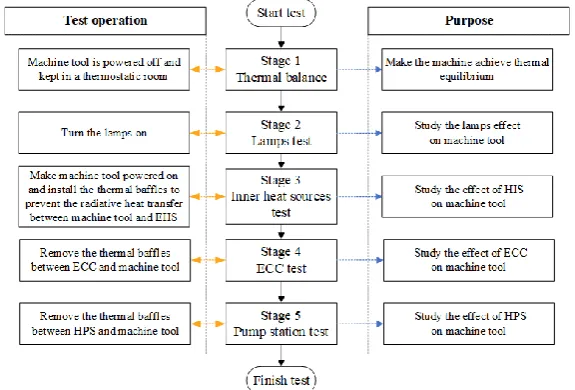
different heat sources impacts in order to verify the proposed temperature-structure multi-step calculation method, and the experiment process is given in Fig. 18.
Fig. 18 Flowchart of experiment process
According to the principle of single variable, the experiment was divided into 5 stages and the
influences of each heat source on the machine tool were investigated in different stages. Lamps thermal
radiation experiment in stage 2 was implemented after machine tool thermal balanced in stage 1 to eliminate the influences of other heat sources. ECC and HPS barely generate heats if machine tool was
powered off, the corresponding ECC and HPS experiments were therefore carried out after machine tool was powered on. In addition, since the ECC and HPS tests were taken after machine tool thermal
rebalanced, thus the subsequent variations of sensors are caused by ECC or HPS individually.
Furthermore, the operations in each stage in experiment are illustrated as follows.
(a) Stage 1 (0h – 18h): Thermal balance. Machine tool was powered off and kept in a thermostatic
room to achieve its thermal equilibrium.
(b) Stage 2 (18h – 61h): Lamps test. Turned the lamps on to study the lamps effects on machine tool.
(c) Stage 3 (61h – 115h): Inner heat sources test. In order to minimal the interference of IHS on ECC and HPS tests results, the ECC and HPS experiments were taken after the machine was powered on and
[image:16.595.154.442.340.535.2]insulate EHSs thermal radiation. Besides, the thermal rebalance stage lasted for more than 2 days to
ensure that machine tool was keeping in thermal equilibrium status.
(d) Stage 4 (115h – 139h): ECC test. The thermal baffles between ECC and machine tool were moved away, and the effects of ECC on the machine tool were investigated.
(e) Stage 5 (139h – 163h): HPS test. The thermal baffles between HPS and machine tool were moved away to study the HPS effects on machine tool.
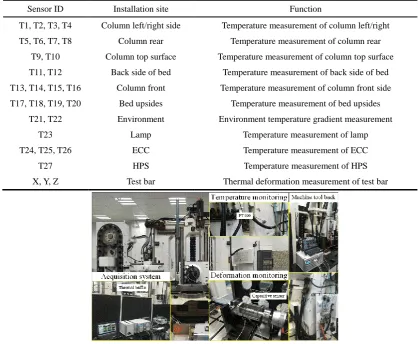
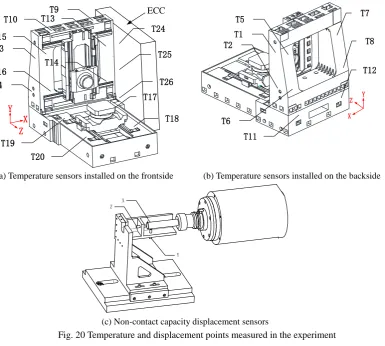
The experimental setup is shown in Fig. 19. 27 PT100 temperature sensors with 0.01℃ resolutions were installed on the machine tool to collect the temperature variation, the installation locations and
functions of sensors are shown in Table 9 and Fig. 20 (a) (b). Three non-contacting capacity displacement sensors with 9nm resolutions are installed on an invar holder to measure the displacements of a test bar
as exhibited in Fig.19 and Fig. 20 (c). The X, Y, Z coordinates of the tested point are 500 mm, -840mm,
[image:17.595.89.506.281.638.2]-850mm. In addition, Table 10 listed the temperature of each EHS and the distance from EHS to machine tool.
Table 9 The installation locations and functions of sensors
Sensor ID Installation site Function
T1, T2, T3, T4 Column left/right side Temperature measurement of column left/right T5, T6, T7, T8 Column rear Temperature measurement of column rear
T9, T10 Column top surface Temperature measurement of column top surface T11, T12 Back side of bed Temperature measurement of back side of bed T13, T14, T15, T16 Column front Temperature measurement of column front side T17, T18, T19, T20 Bed upsides Temperature measurement of bed upsides
T21, T22 Environment Environment temperature gradient measurement
T23 Lamp Temperature measurement of lamp
T24, T25, T26 ECC Temperature measurement of ECC
T27 HPS Temperature measurement of HPS
[image:17.595.87.506.283.627.2]X, Y, Z Test bar Thermal deformation measurement of test bar
T10 T9
T15
T16
T13
T14
T20
T18
T19
T17 T3
T4
X Y
Z
T24
T25
T26
ECC
T1 T2
T5
T6
T7
T8
T11
T12
X Y Z
(a) Temperature sensors installed on the frontside (b) Temperature sensors installed on the backside
Z X
Y
[image:18.595.112.498.71.417.2](c) Non-contact capacity displacement sensors
[image:18.595.103.291.74.235.2]Fig. 20 Temperature and displacement points measured in the experiment
Table 10 EHS parameters conditions
Lamp ECC Pump
Average Temperature Ti[℃] 31 21.3 32
Distance to machine tool di [mm] 970 400 1050
4.2 Experiments data analysis
(a) Ambient air (b) Lamps, ECC and HPS
[image:18.595.89.504.443.687.2](a) Column left/right sides (b) Machine tool back sides
[image:19.595.96.501.77.505.2](c) Column front (d) Bed
Fig. 22 Measured temperature data
(a) Measured displacements during all experimental process
(c) Lamps caused displacements (d) IHS caused displacements
[image:20.595.107.501.75.411.2](e) ECC caused displacements (f) HPS caused displacements
[image:20.595.91.505.465.558.2]Fig. 23 Displacements between test bar and sensors
Table 11 displacement variation caused by different heat sources Variation of displacement [μm]
Heat source X direction Y direction Z direction
Lamp 0.17 -0.53 0.27
IHS 0.75 -13.2 1.6
ECC -0.41 1.58 1.61
HPS 0.26 -1.35 -1.58
In order to ensure the machine tool was in thermal equilibrium status, an extra 18 hours monitoring
test in stage 1 was carried out first. And the experiments under different thermal conditions were taken then. The temperatures of EHS are monitored as show in Fig.21. Fig. 22 and Fig. 23 shows the variations
of filtered measured temperatures and displacements in different test stages and the detailed analysis are
(a) X direction (b) Y direction (c) Z direction
Fig. 24 Different heat sources effects on measured displacements variation
(a). Analysis of lamps effects
The temperature of lamps is stable and fluctuate period is constant during whole test, as depicted
in Fig. 21 (b). In addition, the fluctuating amplitude and cycle time of ambient air temperature are constantly no matter the lamps are turned on or off (see Fig. 21 (a)). In other words, the effects of
lamps on thermostatic room ambient air temperature are not apparently, and the heat transfer between the machine tool and lamps are mainly through the way of thermal radiation. According to
Fig. 22, the temperatures of column upper sides and the front of the bed raised 0.2℃ obviously. In
addition, the temperatures of all monitoring points raised over than 0.1℃ which coincide with the simulation results computed in section 3.1.1. Furthermore, subsequent thermal gradients are
generated and can result in structural deformations. Observing the results in Fig. 23 (c), the Y directional displacement decreases 0.53μm and Z directional displacement increases about 0.27μm.
Fig. 23 (b) shows the monitoring displacements variation in 120min with lamps irradiation and the displacements show periodicity. Furthermore, it is worth noting that the period time of
displacements fluctuation is consistent with the period time of temperature perturbation (see Fig.
21 (a)). Therefore, the ±0.5℃ variation of ambient temperature can cause ±0.06μm displacements swing.
(b). Analysis of IHS effects
The tests of ECC and HPS can only be implemented when the machine tool is turned on. Thus,
the effects of IHS should be studied first. According to Fig. 22, after the machine tool is powered on, the temperatures of whole machine rising obviously, and the temperature increments are much
bigger than other working conditions. These temperature variations are caused by the IHS including
servo system, spindle motor, oil tubes, etc. Contrast with EHS, the impacts of IHS on the machine tool are more noticeable and faster. In addition, the displacement in Y direction varies markedly in
test stage 3 and it takes about 10 hours to get a new thermal equilibrium status (see Fig. 23 (d)). Meanwhile, the fluctuate amplitude of ambient air temperature decreased to ±0.3℃ after machine
tool is powered on, as shown in Fig. 21 (a). The following reason may contribute to this improvement. Additional heats are generated after the machine tool is powered on, thus improve
the heating capacity of the laboratory and exactly meet the better air control system working condition.
(c). Analysis of ECC effects
ECC is one of the major EHSs and is installed close to the machine tool. From the monitoring results showed in Fig. 21 to Fig. 23, EHS has significant effects on machine tool temperature and
structure deformation. The surfaces, with maximum rising temperature, are in the right sides of the machine tool. Further, the ECC mainly affect the machine tool surfaces near to ECC, while
temperatures of other surfaces changed little. This dissymmetry temperature distribution could cause the column deformed in X direction. Fig. 23 (e) shows the displacement variations caused by
ECC, with in X direction decreased about 0.41μm, Y direction increased 1.58μm and Z direction increased 1.61μm. Similar to Fig. 23 (b), the displacements changed periodically, however, the time
period and amplitude are not the same. On one hand, the temperature of ECC changes periodically
and the period time is familiar with that of displacements variation. On other hand, the displacement cyclical variation did not occur until the thermal baffles were moved away. Thus, the various
temperature of ECC may contribute to the displacement fluctuate. (d). Analysis of HPS effects
changed, as depicted in Fig. 22. Thermal gradient of the machine tool is generated due to this
temperature variations, thereby deformed in X and Z directions. According to Fig. 23 (f), the
displacements in X, Y and Z directions varied 0.26μm, -1.35μm and -1.58μm individually. Contrast with Fig. 23 (e), the displacements in three directions are opposite with each other and the following
reasons may result these deformations. Firstly, the reversed displacements in X direction are caused by the layout of ECC and HPS around the machine tool. Secondly, the ECC mainly affects the right
sides of the machine while the HPS mainly affects the left back sides of the machine tool, thereby the displacements in Y and Z directions are different.
4.3 Comparison of CFD simulations with experimental results
According to the comparisons in Fig. 25, the temperature simulations are more accurate than deformation simulations. Furthermore, the simulation results of lamps radiation have better accuracy
than what of the ECC and HPS. The following reasons may take responsible for these deviations. a) The boundary conditions are hard to set exactly due to the complex geometric surfaces of ECC and
pump station.
b) Some sensors are affected by the cooling tubes and micro-electronic components which are hardly considered in simulation calculation.
c) The lack of sensors precision can also cause some errors.
The maximum predicted temperature errors of lamps, ECC and HPS are 0.03℃, 0.06℃ and 0.1℃
respectively. The differences of T2 and T6 in Fig. 25 (b) may be caused by mentioned reason c). According to the experiment photo showed in Fig. 19, the accuracies of T8 and T12 are under the
influences of both aforementioned factors a) and b).
Besides, the displacements variations tendency of simulation and experiment are coincided, as shown
in Fig. 25 (d). Due to the impacts of error average between mating parts and the aforementioned reasons,
it is hard to achieve exactly forecast deformations. However, correct deformation tendency prediction is still a significant conclusion in thermal error compensation process.
(c) Temperature of pump station experiment and simulation
[image:23.595.305.484.84.226.2](d) Deformation of experiment and simulation
Fig. 25 Comparison between test and simulation
5. Conclusion
A temperature-structure multi-step calculation method, based on heat transfer theory, finite element
method and multi-body thermal error modeling method, is proposed in this paper to evaluate the influences of EHS on volumetric thermal deviations of a machine tool. A series of simulations and
validating experiments were carried out to obtain the effects of different EHSs on a machine tool. The temperature of an entire machine tool varied by lamps irradiation, while the ECC and HPS mainly affect
the temperature distribution of a machine tool that close to them. Therefore, the cold light illuminator
should be used instead of incandescent light bulb. It is also observed that the IHS contribute 47% to volumetric displacements variations in X direction and other EHSs contribute 53%. Furthermore, the
effects of IHS, ECC and HPS on Z directional distortion are almost the same, and they contribute around 95% for total. In addition, the effects of IHS on a machine tool Y directional deformation are nearly 4
times bigger than which of EHSs.
Another interesting observation is that the machine tool is more sensitive to EHS temperature
fluctuations than distance variations. Furthermore, the symmetrical layout of ECC and HPS can
counteract the X directional thermal errors caused by each other. In order to minimize the effects of ECC and HPS on a machine tool, thermal baffles should be installed between ECC, HPS and the machine tool
individually.
Proposed temperature-structure multi-step calculation method will assist the machine tool designers
to evaluate the effects of EHS on machine tools and make machine tools reach higher levels of accuracy.
Acknowledgments
The authors gratefully acknowledge the supports of National science and technology major project of China under Grant No.2015ZX04005-001, the fund of national nature science foundation of china
No.51775375, the fund of nature science foundation of Tianjin No. 17JCZDJC40300, the Youth Talent Program of Higher Education Institutions in Hebei Province of China (BJ2017039) and the Youth Project
of Natural Science Foundation in Hebei Province of China (E2017202194);We also thank for the reviewers’ comments.
References
1. Miao EM, Gong YY, Dang LC, Miao JC (2014) Temperature-sensitive point selection of
thermal error model of CNC machining center. Int J Adv Manuf Technol 74: 681-691
machine tools in z-axis. Int J Adv Manuf Technol 80: 389–400
3. Bryan JB (1990) International status of thermal error research. Ann CIRP 39(2):645–656
4. Shi H, Zhang DS, Yang J, Ma C, Mei XS, Gong GF (2016) Experiment-based thermal error modeling method for dual ball screw feed system of precision machine tool. Int J Adv Manuf
Technol 82: 1693-1705
5. Liu T, Gao WG, Tian YL, Mao K, Pan GX, Zhang DW (2015) Thermal simulation modeling
of a hydrostatic machine feed platform. Int J Adv Manuf Technol 79: 1581-1595
6. Liu T, Gao WG, Tian YL, Zhang HJ, Chang WF, Mao K, Zhang DW (2015) A differentiated
multi-loops bath recirculation system for precision machine tools. Appl Therm Eng 76: 54-63 7. Du ZC, Yao XD, Hou HF, Yang JG (2018) A fast way to determine temperature sensor
locations in thermal error compensation. Int J Adv Manuf Technol 97: 455-465
8. Jin C, Wu B, Hu YM (2015) Temperature distribution and thermal error prediction of a CNC feed system under varying operating conditions. Int J Adv Manuf Technol 77: 1979-1992
9. Zhang CX, Gao F, Li Y (2017) Thermal error characteristic analysis and modeling for machine tools due to time-varying environmental temperature. Precis Eng 47: 231-238
10. Mian N.S, Fletcher S, Longstaff A.P, Myers A (2013) Efficient estimation by FEA of machine tool distortion due to environmental temperature perturbations. Precis Eng 37: 372-379
11. Tan B, Mao XY, Liu HQ, Li B, He SP, Peng FY, Yin L (2014) A thermal error model for large machine tools that considers environmental thermal hysteresis effects. Int J Mach Tools Manuf 82–
83: 11-20
12. Huang J, Zhou ZD, Liu MY, Zhang EL, Chen M, Pham D.T, Ji CQ (2015) Real-time measurement of temperature field in heavy-duty machine tools using fiber Bragg grating sensors
and analysis of thermal shift errors. Mechatronics 31: 16-21
13. Glänzel J, Ihlenfeldt S, Naumann CC, Matthias P (2017) Decoupling of Fluid and
Thermo-elastic Simulations on Machine tools Using Characteristic Diagrams[J]. Proc CIRP, 62:340-345 14. Nouanegue H, Muftuoglu A, Bilgen E (2008) Conjugate heat transfer by natural convection,
conduction and radiation in open cavities. Int J Heat Mass Tran 51: 6054-6062
15. Sharma AK, Velusamy K, Balaji C, Venkateshan S.P (2008) Conjugate turbulent natural
convection with surface radiation in air filled rectangular enclosures. Int J Heat Mass Tran 50:
625-639
16. Wang Y, Meng XJ, Yang XN, Liu JP (2016) Influence of convection and radiation on the
thermal environment in an industrial building with buoyancy-driven natural ventilation. Energ Buildings 75: 394-401
17. Meng XJ, Wang Y, Liu TN, Xing X, Cao YX, Zhao JP (2016) Influence of radiation on
predictive accuracy in numerical simulations of the thermal environment in industrial buildings with buoyancy-driven natural ventilation. Appl Therm Eng 96: 473-480
18. Arslanoglu N, Yigit A (2014) Experimental and theoretical investigation of the effect of radiation heat flux on human thermal comfort. Energ Buildings, 113: 23-29
19. Kalmár F, Kalmár T (2012) Interrelation between mean radiant temperature and room geometry. Energ Buildings 55: 414-421
20. Fu GQ, Fu JZ, Gao HL, Yao XH (2017) Squareness error modeling for multi-axis machine tools via synthesizing the motion of the axes. Int J Adv Manuf Technol 89: 2993-3008.
21. Zhou BC, Wang SL, Fang CG, Sun SL, Dai H (2017) Geometric error modeling and
compensation for five-axis CNC gear profile grinding machine tools. Int J Adv Manuf Technol 92: 2639-2652
Figure captions
Fig. 1 Flowchart for TSMC method
Fig. 2 Thermal radiation between surface A1 and A2
Fig. 3 Sketch of machine tool and ECC
Fig. 4 Spatial relationship between A1 to A2 for (a) Parallel, (b) Vertical.
Fig. 5 (a) Geometry model. (b) Equivalent network
Fig. 6 Machine tool topology
Fig. 7 CAD models for (a) Schematic, (b) CFD model and (c) Finite element model.
Fig. 8 Machine tool temperature distribution and the structure deformation with lamp radiation for (a)
Temperature field (T1 is 31℃ and d1 is 1000 mm) and (b) Structure deformation schematic
Fig. 9 Influence of lamp on spindle rear displacement. (a) Tool tip displacement with various T1 (d1 is
1000mm), (b) Tool tip displacement with various d1 (T1 is 46℃)
Fig. 10 Machine tool temperature distribution and the structure deformation with ECC radiation. (a)
Temperature field (T2 is 21.3℃ and d2 is 450mm), (b) Structure deformation schematic
Fig. 11 Influence of ECC on spindle rear displacement. (a) Tool tip displacement with various T2 (d2 is
450 mm), (b) Tool tip displacement with various d2 (T2 is 25.3℃)
Fig. 12 Machine tool temperature distribution and the structure deformation with pump radiation. (a)
Temperature field (T3 is 32℃ and d3 is 1050mm), (b) Structure deformation schematic
Fig. 13 Influence of pump station on spindle rear displacement. (a) Tool tip displacement with various
T3 (d3 is 950 mm), (b) Tool tip displacement with various d3 (T3 is 38℃)
Fig. 14 Machine tool temperature under comprehensive EHS influence for (a) Front side ad (b) Back
side
Fig. 15 Working volume and body diagonal
Fig. 16 21 thermal errors of machine tool for (a) Thermal errors of X axis guideway, (b) Thermal errors
of Y axis guideway, (c) Thermal errors of Z axis guideway and (d) Squareness
Fig. 17 Machine tool working volume thermal error under comprehensive EHS for (a) X directional
thermal error, (b) Y directional thermal error, (c) Z directional thermal error and (d) Total thermal error
Fig. 18 (a) Y and Z directional thermal error of path X1X2. (b) X and Z directional thermal error of path
Y1Y2. (c) X and Y directional thermal error of path Z1Z2. (d) NPP thermal error. (e) PPP thermal error.
(f) Total thermal error of NPP and PPP
Fig. 19 Flowchart of experiment process
Fig. 20 The experimental precision machine tool
Fig. 21 Temperature and displacement points measured in the experiment. (a) Temperature sensors
installed on the frontside, (b) Temperature sensors installed on the backside, (c) Non-contact capacity
Fig. 23 Measured temperature data. (a) Column left/right sides, (b) Machine tool back sides, (c) Column
front, (d) Bed
Fig. 24 Displacements between test bar and sensors. (a) Measured displacements during all experimental
process, (b) Measured displacements in 120 min, (c) Lamps caused displacements, (d) IHS caused
displacements, (e) ECC caused displacements, (f) HPS caused displacements
Fig. 25 Different heat sources effects on measured displacements variation for (a) X direction, (b) Y
direction and (c) Z direction
Fig. 26 Comparison between test and simulation for (a) Temperature of lamps experiment and simulation,
(b) Temperature of ECC experiment and simulation, (c) Temperature of pump station experiment and