A Thesis Submitted for the Degree of PhD at the University of Warwick
Permanent WRAP URL:
http://wrap.warwick.ac.uk/128730
Copyright and reuse:
This thesis is made available online and is protected by original copyright. Please scroll down to view the document itself.
Please refer to the repository record for this item for information to help you to cite it. Our policy information is available from the repository home page.
Targeting trypanosomatid
translation factor interactions
Fábio Henrique dos Santos Rodrigues, M.Sc.
A thesis submitted for the degree of
Doctor of Philosophy
School of Life Sciences
University of Warwick
Supervisor: Prof. John E. G. McCarthy
Summary
Declaration………...…………..…ix
Acknowledgements…...………...….x
Abstract………..…xi
Abbreviations.………...xii
List of Figures………...…xvi
List of Tables………....xxii
Chapter 1 – Trypanosomatids, Leishmaniasis and Translation
Initiation Complex………..…1
1.1: Trypanosomatids and Leishmaniasis………..……1
1.1.1: Cutaneous Leishmaniasis – CL ……….…2
1.1.2: Muco-Cutaneous Leishmaniasis – MCL………...3
1.1.3: Visceral Leishmaniasis – VL………3
1.1.4: Epidemiology………..……4
1.1.5: Sandflies………..….5
Summary
1.2: DNA transcription and trans-splicing………...12
1.2.1: DNA transcription……….12
1.2.2: trans-splicing………...13
1.3: Trypanosomatid Translation Initiation Complex…………....15
1.3.1: General Translation Initiation Complex……….16
1.3.2: Leishmania eIF4E, PABP and eIF4G isoforms………21
1.3.3: Translation Elongation……….26
1.3.4: Translation Termination………..….27
1.3.5: Recycling………..…..27
1.4: MLLE Domains and PAM2 Motif………...…27
1.4.1: MLLE domain………27
1.4.2: PAM2 motif………...….28
1.4.3: PAM2/MLLE interaction………...28
1.5: Objectives………....30
1.5.1: General Objective………...……….30
1.5.2: Specific Objectives………...…30
Chapter 2 - Materials and Methods………..……….31
2.1: Buffers list………...31
2.2: Constructs Preparation……….….32
2.2.1: Restriction based cloning and Gibson assembly…..34
2.2.2: E. coli transformation………...37
2.2.3: Protein overproduction………....37
2.3: Protein purification………...38
2.3.1: Affinity purification………...38
Summary
2.4: Protein identification……….…….39
2.4.1: SDS-PAGE………...39
2.4.2: Mass spectrometry………...40
2.5: Surface Plasmon Resonance………..……42
2.5.1: Yes/No binding experiment………...………….42
2.5.2: Binding affinity experiment……….…43
2.6: Microscale Thermophoresis………..44
2.6.1: Binding affinity experiment……….…44
2.7: Nuclear Magnetic Resonance………..….45
2.7.1: {1H-15N}-HSQC and TROSY……….…45
2.7.2: Triple resonance and residue assignment………….47
Chapter 3 – eIF4E4 and PABP1 protein domains production
and purification………..………..53
Chapter 4 – Surface Plasmon Resonance………..60
4.1: “Yes/No” Binding Experiment………..60
4.2: Binding Affinity Experiments………...63
Chapter 5 – Microscale Thermophoresis………..68
5.1: Binding Affinity Experiments………...68
Summary
6.3: PAM2 motifs………....90
Chapter 7 – Discussion………93
Chapter 8 – Conclusions………105
Chapter 9 – Annexes………..107
Declaration
Declaration
I declare that I personally carried out the work submitted in this thesis, to the University of Warwick, in support of my application for the degree of Doctor of Philosophy. No part of this work has previously been submitted in any previous application for a degree.
The research presented was carried out by myself except in the cases outlined below:
PABP1 and its domains production and purification were performed by Dr Maja Firczuk.
Crystallography experiments were performed by Dr Maja Firczuk, in collaboration with Prof Alex Cameron.
The PAM2 peptide used in the NMR experiments were synthesized by the group of Dr Andrew Wilson, from the University of Leeds.
Acknowledgements
Acknowledgements
First of all, I would like to thank God for helping me to achieve this goal.
I would like to express my gratitude to my supervisor, Prof. John McCarthy, for the opportunity to perform my research project in his group, and all the support.
I would like to thank Dr Maja Firczuk for co-supervising me during my whole PhD, teaching me, giving advices during the everyday work, helping with experiments (especially providing proteins and performing the crystallographic work), your help was essential for me to complete this work.
I would like also to thank my current and former lab colleagues, Tailise, Xiang, Estelle, Gurd, Paola, Ollie, Byron, Andrew, you all are part of it, thanks for your help and friendship.
Also, thanks to my advisory panel, Dr Orkun Soyer and Dr Robin Allaby, for your help and suggestions along the way.
I would also like to express my gratitude to Dr Alex Cameron, whose help was essential in this work, especially in the crystallographic experiments. Also, thanks to Dr Alex Breeze, Dr Arnoult Kalverda and Dr Simon Skinner, that provided the conditions for the NMR experiments, a fundamental part of this work. Thanks to Dr Andy Wilson and Dr Martin Walko, that provided peptides for our experiments.
I also would like to thank Dr Cleidiane Zampronio, for all the help with the MS analysis, and for the good chat between incubation times. Thanks too to Dr Liz Fullam and Dr Sarah Bennet, that were always happy to help when needed.
I would like to thank my wife Tailise. This thesis is also yours, thanks for all the support, in the lab and at home, all the love and for being always by my side. Without you, this thesis would never have happened. Love you! Te Amo!
I would like to thank my family, my parents, Gisberto and Márcia, my grandma Darcy, my mother-in-law Elisabeth, without your love and support, I would never make it. Love you all.
Abstract
Abstract
Trypanosomatids are eukaryotic parasites that migrate between insect vectors and mammalian hosts. They cause a number of serious diseases with major impacts on human health on a global scale. One example is Leishmania, which causes Leishmaniasis, a disease that affects approximately 12 million people in Asia, Middle East, Africa, South America and Southern Europe. Trans-splicing of trypanosomatid polycistronic transcripts produces polyadenylated monocistronic mRNAs that are modified at their 5’ends to form the cap4 structure
(m7Gpppm36,6,2’Apm2’Apm2’Cpm23,2’U). Two trypanosomatid
translation initiation factor 4E isomers (eIF4E3 and eIF4E4) have extended N-terminal regions that include PAM2 motifs; these regions can interact with PABC domains in the poly(A)-binding proteins PABP1. Using NMR, X-ray crystallography and biophysical quantitation of biomolecular interactions, we show that tight binding between Leishmania eIF4E4 and PABP1, mediated largely by hydrophobic interactions, underpins a novel architecture in the translation factor complex bridging the 5’ and 3’ ends of the monocistronic mRNAs. We
demonstrate that this complex can also accommodate Leishmania
Abbreviations
Abbreviations
a.a. Amino acid
40S Small ribosome subunit 40S
Amp Ampicillin
bp Base Pairs
BP Branching Point
BSA Bovine Serum Albumin
CaCl2 Calcium chloride
CL Cutaneous Leishmaniasis
CoCl2 Cobalt chloride
CuSO4 Copper sulphate
CV Column Volume
ddH2O Double-distilled water
dATP Deoxyadenosine triphosphate
dCTP Deoxycytidine triphosphate
dGTP Deoxyguanosine triphosphate
dTTP Deoxythymidine triphosphate
D2O Deuterium oxide
DNA Deoxyribonucleic acid
DTT Dithiothreitol
EDTA Ethylenediaminetetraacetic acid
eIF4E Eukaryotic Translation Initiation Factor 4E
eIF4G Eukaryotic Translation Initiation Factor 4G
ESI Electrospray Ionization
FeSO4 Ferrous sulphate
FL Full length
Abbreviations
H3BO3 Boric acid
HCD Higher-energy Collisional Dissociation
HEPES 4-(2-hydroxyethyl)-1-piperazineethanesulfonic acid
HSQC Heteronuclear Single Quantum Coherence
IPTG Isopropyl β-D-1-thiogalactopyranoside
IR Infrared
ITC Isothermal Titration Calorimetry
kDNA Kinetoplast mitochondrial DNA
ka Association rate constant
kd Dissociation rate constant
KA Association constant
KD Dissociation constant
Kan Kanamycin
KCl Potassium chloride
KH2PO4 Potassium dihydrogen phosphate
LB Lysogeny Broth
LC Liquid Chromatography
mM mili molar
mAU Milli Absorbance Units
mRNA Messenger RNA
M Molar, i.e., mol/L
MBP Maltose Binding Protein tag
MgCl2 Magnesium chloride
MgSO4 Magnesium sulphate
MnCl2 Manganese chloride
MCL Muco-cutaneous Leishmaniasis
Abbreviations
nt nucleotide
NaCl Sodium chloride
Na2HPO4 Disodium hydrogen phosphate
NAD Nicotinamide adenine dinucleotide
15NH4Cl 15N ammonium chloride
(NH4)6(Mo7) Ammonium molybdate
NMR Nuclear Magnetic Resonance
NTA Nitrilotriacetic acid
OD600 Optical Density at 600 nm
pH log10[H+]
PABC C-terminal PABC domain
PABP Poly(A) Binding Protein
PAM2 PABP interaction motif
PEG8000 Polyethylene glycol 8000
PIC Pre-initiation Complex
PMSF Phenylmethylsulfonyl fluoride
rpm rotations per minute
Rmax Maximum response
RNA Ribonucleic acid
RRM RNA Recognition Motif
SA Streptavidin
SBP Streptavidin Binding Protein
SDS-PAGE Sodium Dodecyl Sulphate - Polyacrylamide Gel Electrophoresis
SL Splice Leader
SL RNA Splice Leader RNA
SPR Surface Plasmon Resonance
tRNA transfer RNA
Abbreviations
Th Thomson (unit of mass-to-charge ratio)
Tris.HCl Tris(hydroxymethyl)aminomethane Hydrochloride
TROSY Transverse Relaxation-Optimized Spectroscopy
UTR RNA Untranslated Region
V volts
VL Visceral Leishmaniasis
WHO World Health Organization
ZnSO4 Zinc sulphate
µM micro molar
oC Degree Celsius
µL microlitre
Amino acid abbreviations:
Amino acid 3 letter
code 1 letter code Amino acid 3 letter code 1 letter code
Alanine Ala A Leucine Leu L
Arginine Arg R Lysine Lys K
Asparagine Asn N Methionine Met M
Aspartate Asp D Phenylalanine Phe F
Cysteine Cys C Proline Pro P
Glutamate Glu E Serine Ser S
Glutamine Gln Q Threonine Thr T
Glycine Gly G Tryptophan Trp W
List of Figures
List of Figures
Figure 1 - Child affected by cutaneous leishmaniasis. Large lesions on the cheek and near the nose and eyes. (Photo from WHO website, http://www.who.int/leishmaniasis/en/, C. Black). …….………..………..2
Figure 2 - Child affected by muco-cutaneous leishmaniasis. Note the severe damage in the nose/ upper lip region. (Photo from WHO website, http://www.who.int/leishmaniasis/en/)………...3
Figure 3 - Child affected by visceral leishmaniasis. Both spleen and liver are massively enlarged, as outlined by green markings on the picture. (Photo from WHO website, http://www.who.int/leishmaniasis/en/). ………...4
Figure 4: Leishmania epidemic map, endemic areas are highlighted in red. Data from WHO 2015 report. ...4
Figure 5: (A) Lieutenant General Sir William Boog Leishman; (B) Major Charles Donovan. (STEVERDING, 2017). ...6
Figure 6: Leishmania main morphologies (A) Promastigote (insect); (B)
amastigote (mammalian host). ...7
Figure 7: Leishmania life cycle. (Adapted from the American Center for
Disease and Prevention website). ...8
Figure 8: Most common drugs used in leishmaniasis treatment, (A) Amphotericin B; (B) Miltefosine; (C) Paromomycin and (D) Sodium Stibogluconate. ...10
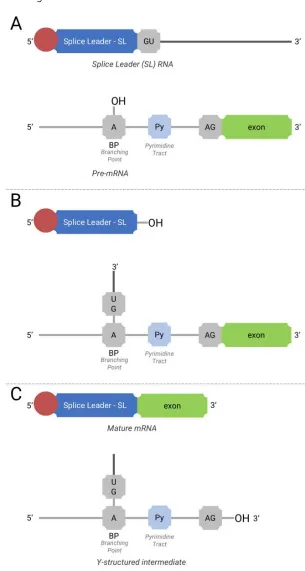
Figure 9: Mechanism of trans-Splicing (adapted from LIANG et al, 2003). (A)Initial components for trans-splicing; (B) first step of trans-splicing; (C) second step of trans-splicing, with Y-structures intermediate and mature RNA formation. ...14
Figure 10: Overview of gene expression leading to protein synthesis. ...15
Figure 11: Model of higher eukaryotes translation initiation complex. Adapted from SHAPIRA, 2012. ...17
List of Figures
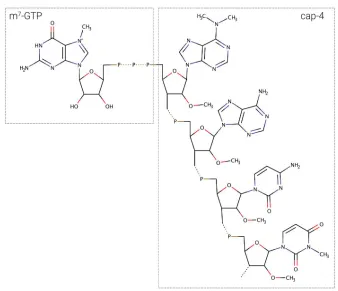
Figure 13: m7GTP-cap-4 structure. ...21
Figure 14: PAM2 key residues interacting with MLLE domain; hydrophobic pockets highlighted in dark blue. ...29
Figure 15: Leishmania eIF4E-4 segmentation in several domains. ...32
Figure 16: Leishmania PABP1 segmentation in several domains. ...34
Figure 17: Gibson Assembly procedure summary. ...36
Figure 18: Chemical shifts in interacting peaks in a HSQC spectrum simulation. ...46
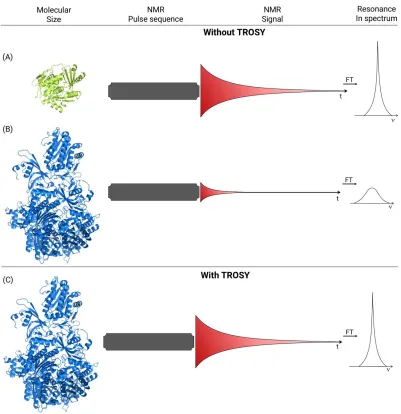
Figure 19: Diagram comparing the difference between TROSY and non-TROSY experiments (Adapted from FERNANDEZ, 2003). ...47
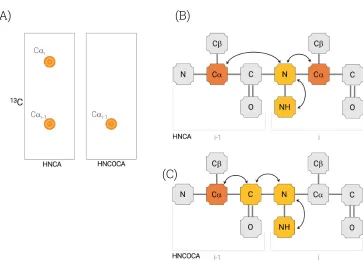
Figure 20: HNCA and HNCOCA diagrams, (A) HNCA and HNCOCA spectra strips, demonstrating the typical profile of each experiment; (B) HNCA magnetization transfer diagram; (C) HNCOCA magnetization transfer diagram. ...48
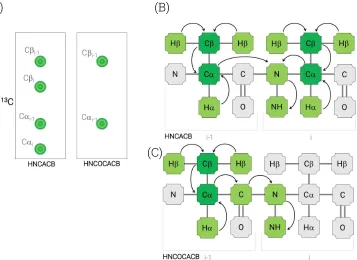
Figure 21: HNCACB and HNCOCACB diagrams, (A) HNCACB and HNCOCACB spectra strips, demonstrating the typical profile of each experiment; (B) HNCACB magnetization transfer diagram; (C) HNCOCACB magnetization transfer diagram. ...49
Figure 22: HNCO and HNCACO diagrams, (A) HNCO and HNCACO spectra strips, demonstrating the typical profile of each experiment; (B) HNCO magnetization transfer diagram; (C) HNCACO magnetization transfer diagram. ...49
Figure 23: Diagram illustrating the process of amino acid residue assignment via triple resonance experiments. ...51
Figure 24: SDS-PAGE gel with the different MBP-fusion constructs of eIF4E4 and PABP1. ...53
List of Figures
Figure 26: Size exclusion chromatogram of eIF4E4(iv), in Superdex Increase 75 10/300 GL column. Aggregated protein peak located between the fraction A5-A9; monomeric protein peak between fraction A12-A15. Void volume = 7.2 mL, 1 CV= 24 mL; molecular weight range= 3-70 kDa. ...55
Figure 27: SDS-PAGE gel of eIF4E4(iv), in Superdex Increase 75 10/300 GL column. Aggregated protein peak located between the fraction A7-A9;
monomeric protein peak between fraction A10-A15.
...56
Figure 28: SDS-PAGE gel of eIF4E4(iv) concentration determination, using BSA standards. Protein concentration is determined by comparing the sample band intensity with a calibration curve obtained by the BSA standards. ...56
Figure 29: Size exclusion chromatogram of isotopically labelled eIF4E4(iv), in Superdex Increase 75 10/300 GL column. Aggregated protein peak located between the fraction A3-A10; monomeric protein peak between fraction A11-A14. ...57
Figure 30: SDS-PAGE gel of isotopically labelled eIF4E4(iv), in Superdex Increase 200/300 GL column. Aggregated protein peak located between the fraction A10-A14; monomeric protein peak between fraction A15-B3. ...58
Figure 31: SDS-PAGE gel of (A) non-labelled eIF4E4(iv); (B) isotopically labelled concentration determination, using BSA standards. ...58
Figure 32: (A) Flow cell modes used in the Yes/No binding experiments; (B) schematic of the Yes/No binding screening experiment. ...60
Figure 33: PABP1 domains used for Yes/No binding experiments. ...61
Figure 34: Yes/No binding sensorgram of PABP1 domains against eIF4E4(iv). ...62
Figure 35: Binding affinity sensorgrams of eIF4E4(iv) against: (A) PABP1 full length; (B) PABP1(C); (C) PABP1(G); (D) PABP1(J)……….…….63
List of Figures
Figure 37: (A) example of SPR curves in experiment to obtain affinity values; (B) KD calculation using data extracted from SPR curves. ...65
Figure 38: Binding affinity sensorgram of eIF4E4(iv) against PABP1 full length, under optimized conditions……….………67
Figure 39: MST sample preparation, the target molecule concentration is kept constant, while the ligand concentration, [L], is varied, with [L]1 > [L]2
> …>[L]16. ……….………...68
Figure 40: Microscale thermophoresis schematic (based on Jerabek-Willemsen, 2014). There are four main stages during the MST measurement, 1: Initial state; 2: Diffusion; 3: Steady state and 4: Back-diffusion. The effect of this stages is reflected in the fluorescence intensity over time, as observed in a typical MST curve. ...69
Figure 41: Relative affinity of PABP1 domains against eIF4E4(iv). ...70
Figure 42: PABP1 full length and C-terminal domains with higher affinities for eIF4E4(iv). ...70
Figure 43: Representation of PABP1 C-terminal deletion constructs. ...71
Figure 44: Microscale thermophoresis affinity plots of: (A) PABP1(C); (B)
PABP1(J); (C) PABP1(G); (D) PABP1 full length; (E) PABP1(ΔC); (F) PABP1(ΔJ)
and (G) BSA (negative control). ...71
Figure 45: (A) Capillaries shape quality check; (B) capillary without protein adsorption; (C) capillary with protein adsorption, with higher degree of adsorption observed at the end of measurement. ...73
Figure 46: (A) MST curves of an aggregate-free sample, displaying smooth curve; (B) MST curves of an aggregate-containing sample, displaying bumps and erratic behaviour. ...74
List of Figures
Figure 49: MST data of eIF4G3 and (A) eIF4E4(iv); (B) PABP1 FL; (C) PABP1(J) and (D) {eIF4E4(v)/PABP1(J)}. ...76
Figure 50: PABP1(J) proton spectrum, with characteristic aspects of a folded protein. ...79
Figure 51: eIF4E4(iv) proton spectrum, with characteristic aspects of an unfolded protein. ………...79
Figure 52: HSQC spectra of PABP1(J) Domain before (in blue) and after (in red) the titration with eIF4E4(iv). The residues that had alterations in their peaks, indicating binding, are highlighted by dashed circles. ...81
Figure 53: HSQC spectra of eIF4E4(iv) before (in blue) and after (in red) the titration with PABP1(iv). The residues that had alterations in their peaks, indicating binding, are highlighted by dashed circles. ...82
Figure 54: HSQC spectra of PABP1(J) Domain before (in blue) and after (in red) the titration with eIF4E4(iv) peptide. The residues that had alterations in their peaks, indicating binding, are highlighted by dashed circles. ...84
Figure 55: PABP1(J) crystal structure, with 5 𝛼-helices assigned. ...85
Figure 56: PABP1(J) 𝛼-helices location within its primary sequence. ...85
Figure 57: PABP1(J) crystal structure, with binding residues identified by NMR highlighted in blue. ...86
Figure 58: (A) PABP1(J) crystal structure with binding motif highlighted in blue; (B) human PABC1 MLLE domain, with binding residues in red, as described in the literature (XIE, 2014). ...87
Figure 59: PABP1(J) crystal structure, with binding residues identified by NMR highlighted in blue and PAM2 peptide in orange sticks/green mesh. ... 87
Figure 60: PABP1(J) and eIF4E4(iv) peptide interaction map, with eiF4E4(iv) peptide residues represented on the top (blue); PABP1(J) residues on the bottom (red). Interactions are indicated by the green dashed lines. ...88
List of Figures
Figure 62: Hydrophobicity mapping of (A) PABP1(J) M140 pocket, (B) PABP1(J) F147 pocket, and (C) eIF4E4(iv) peptide. ...89
Figure 63: Illustration of chemical shift perturbation in a fast-exchange system, with peak slowly changing its position. ...99
Figure 64: Illustration of chemical shift perturbation in a fast-exchange system, with peak intensity decreasing in the initial position; and increasing in a new, final position. ...99
Figure 65: (A) PABP1(J) crystal structure with residues involved in binding to eIF4E4(iv) highlighted in blue; (B) PABP1(J)/eIF4E4(iv) peptide hydrophobicity map; (C) PABP1(J)/eIF4E4(iv) peptide electrostatic map (D) PABP1(J)/eIF4E4(iv) crystal structure with eIF4E4(iv) residues involved in binding to PABP1 highlighted; (E) eIF4E4(iv) peptide hydrophobicity map and (F) eIF4E4(iv) peptide electrostatic map. ...102
List of Tables
List of Tables
Table 1: Pros and cons of the main drugs used in leishmaniasis treatment………..………..11
Table 2: Trypanosomatid eIF4Es affinities and L. major eIF4Es sizes. …22
Table 3: KD calculations of some of the tested proteins. ……….….66
Table 4: PABP1 domains/eIF4E4(iv) KD calculations by Microscale
Thermophoresis. ……….………72
Table 5: Hill coefficient for the C-terminal domains of PABP1, when binding to eIF4E4(iv). ………..………..72
Table 6: PABP1(J) structural properties obtained by crystallography. ..….86
Chapter 1 | Trypanosomatids, Leishmaniasis and the Translation
Initiation Complex
Chapter 1 – Trypanosomatids, Leishmaniasis and
the Translation Initiation Complex
1.1: Trypanosomatids and Leishmaniasis
Leishmaniasis
Leishmaniasis is a neglected tropical disease (NTD) that affects a large number of countries around the globe, the exceptions being Australia and Antarctica (PACE, 2014). The disease is concentrated in countries in Southeast Asia, East Africa, the Middle East and Latin America. Leishmaniasis is also found in several Mediterranean countries in Southern Europe, like France, Italy and Spain (READY, 2010).
According to the World Health Organization, there are over 1 billion people living at endemic areas at risk of infection, with 300,000 new cases of visceral leishmaniasis every year, and more than 1 million cases of cutaneous leishmaniasis reported in the last 5 years - the number of deaths exceed 20,000 every year (WHO Weekly epidemiological record, 2016). The large number of people affected by leishmaniasis makes its study of great importance, especially studies whose outcome may help in the relief of the burden caused by the disease.
There are around 53 known Leishmania species, from which 20 are
Chapter 1 | Trypanosomatids, Leishmaniasis and the Translation
Initiation Complex
leishmaniasis (PACE, 2014). Among the several Leishmania species, the most common are L. major, L. donovani, L. infantum and L. braziliensis. Fossil evidence suggests that the first Leishmania appeared during the Cretaceous (146-65 MYA), and had reptiles as its main targets. The first evidence of humans infected by Leishmania dates from 2000 BC, being found in remains of Egyptian mummies; in the new world, archaeologists found a 6-year-old girl Peruvian mummy, dated 800 BC, infected with leishmaniasis (AKHOUNDI, 2016).
There are 3 major types of leishmaniasis: Cutaneous, Muco-cutaneous and Visceral (Kala-Azar).
1.1.1: Cutaneous leishmaniasis - CL
Cutaneous leishmaniasis (CL) is the most common manifestation of the disease. The disease has a varied incubation period, ranging from weeks to months. It has as characteristic the presence of ulcers on exposed areas of arms, legs, torso, and often appear in large numbers (BARRETT, 2012). These start as papules, that after a developing time, ulcerate. In some cases, the disease can last for more than two years (DOWLATI, 1996), and even after initial cure, relapsing
can occur (VALESKY, 2007). The ulcers caused by CL leave severe scars after treated, causing lasting effects in the individuals afflicted by the disease, even after treatment.
Figure 1 - Child affected by cutaneous leishmaniasis. Large lesions on the cheek and
near the nose and eyes. (Photo from WHO website,
Chapter 1 | Trypanosomatids, Leishmaniasis and the Translation
Initiation Complex
1.1.2: Muco-cutaneous leishmaniasis - MCL
Muco-cutaneous (or mucous) leishmaniasis (MCL) is a disfiguring manifestation, and its lesions can partially or totally destroy the mucous membranes of the nose, mouth and throat cavities - it has great impact on the lives of those affected by MCL (PURSE, 2017). The disease starts when the upper respiratory tract is
infected, displaying cutaneous
lesions. As the infection aggravates, it damages the mucosal tract from oral and nasal cavities, even leading to nasal septum perforation and profound disfiguration (ROYER, 2002).
Figure 2 - Child affected by muco-cutaneous leishmaniasis. Note the severe damage in
the nose/ upper lip region. (Photo from WHO website,
http://www.who.int/leishmaniasis/en/).
1.1.3: Visceral leishmaniasis - VL
Chapter 1 | Trypanosomatids, Leishmaniasis and the Translation
Initiation Complex
Figure 3 - Child affected by visceral leishmaniasis. Both spleen and liver are massively enlarged, as outlined by green markings on the picture. (Photo from WHO website,
http://www.who.int/leishmaniasis/en/).
1.1.4: Epidemiology
According to the World Health Organization, in its 2015 report, Leishmaniasis is present in a large number of countries, especially in the inter-tropical area.
Figure 4: Leishmania epidemic map, endemic areas are highlighted in red. Data from WHO 2015 report.
Chapter 1 | Trypanosomatids, Leishmaniasis and the Translation
Initiation Complex
personnel deployed in endemic areas or that act in areas in combat operations. There are reports from military personnel from the UK armed forces and US army based in countries as Iraq, Belize, Panama and Afghanistan that were infected with Leishmaniasis. (PREEDY, 2014; ROYER, 2002). Leishmaniasis is one of the main parasitic diseases, and its mortality rate is only exceeded by malaria (WHO Technical Report, 2010).
1.1.5: Sandflies
All types of leishmaniasis are transmitted through the bite of the female sandfly. There are two sandfly genera that transmit the disease: Phlebotomus in the Old World, and Lutzomyia in the New World. According to (PACE, 2014), 93 of the around 800 known sandfly subspecies are able to spread leishmaniasis.
Sandfly is an insect that is mostly active at night, in open areas (although there are reports of some species that do bite during daytime, indoors). It has limited mobility, and its ability to travel vertically has a range of around 1.0 metres, and travel horizontally 1500 metres (AKHOUNDI, 2016). The first sandlies are believed to have originated during the Eocene
(55-38 MYA), as Phlebotomus, while the separation into
Chapter 1 | Trypanosomatids, Leishmaniasis and the Translation
Initiation Complex
1.1.6:
Leishmania
The Leishmania parasite was first described in 1900 by the Scottish pathologist William Boog Leishman, that was treating British soldiers in India. Not long after, the Irish doctor Charles Donovan also identified the disease independently. Their findings led to the discovery of the parasite that causes leishmaniasis. (STEVERDING, 2017).
(A) (B)
Figure 5: (A) Lieutenant General Sir William Boog Leishman; (B) Major Charles Donovan. (STEVERDING, 2017).
The parasite Leishmania belongs to the Class Kinetoplastida, Order
Trypanossomatida, Genus Leishmania. It has two main morphologies
during its lifecycle; a flagellated promastigote and a non-flagellated amastigote form. The amastigote cell morphology is smaller, spherical, with limited motility. The other cell morphology, promastigote, is larger, more elongated, and with a long flagellum, that confers mobility to the
Chapter 1 | Trypanosomatids, Leishmaniasis and the Translation
Initiation Complex
(A) (B)
Figure 6: Leishmania main morphologies (A) Promastigote (insect); (B) amastigote (mammalian host).
Chapter 1 | Trypanosomatids, Leishmaniasis and the Translation
Initiation Complex
Chapter 1 | Trypanosomatids, Leishmaniasis and the Translation
Initiation Complex
The Kinetoplastida class has a unique organelle called kinetoplast. Kinetoplasts are condensed disks of mitochondrial DNA (kDNA), organized in large circles (maxicircles - approximately 20 kb) and small circles (minicircles - approximately 1 kb) located in the mitochondria, near the flagellum base (POVELONES, 2014). There are around 25-50 maxicircles and 5000-10000 minicircles, interlocked together in a unique disk-shaped structure forming a single kDNA network (VARGAS-PARADA, 2010). The maxicircles encode genes that correspond to other eukaryotic mitochondrial DNA, like subunits of respiratory complex for example. However, the maxicircle transcripts are cryptic and require further RNA editing, and the minicircles are responsible for controlling RNAs that will act in the RNA editing, “correcting” the maxicircle transcripts (LIU, 2005).
1.1.7: Nutrition, available treatments, side effects and drug
resistance
Chapter 1 | Trypanosomatids, Leishmaniasis and the Translation
Initiation Complex
(A) (B)
(C) (D)
Figure 8: Most common drugs used in leishmaniasis treatment, (A) Amphotericin B; (B) Miltefosine; (C) Paromomycin and (D) Sodium Stibogluconate.
Chapter 1 | Trypanosomatids, Leishmaniasis and the Translation
Initiation Complex
stibugluconate is the most traditional drug for leishmaniasis treatment. Its mechanism of action is not completely understood, but there is evidence that it acts in the parasite’s oxidative pathways (LINDOSO, 2012). It is a significantly toxic drug (toxic to liver, kidneys), being heart problems and acute pancreatitis particularly dangerous side-effects (TIUMAN, 2011; LINDOSO, 2012).
Among the several side effects related to these drugs, the most serious ones are decreased kidney function, liver problems, permanent hearing loss, pancreatitis, veins toxicity and cardiac failure. Also, the administration of these drugs is often unpleasant, like for example through the application very painful intramuscular injections, or through intravenous administration that requires hospitalization. For instance, sodium stibugluconate and miltefosine requires daily injection for at least 28 days, and hospitalization (WHO Frequently asked questions on visceral leishmaniasis kala-azar, 2013).
Table 1: Pros and cons of the main drugs used in leishmaniasis treatment.
Drug Pros Cons
Amphotericin B Capable of destroying the parasites surface membrane, killing it.
Kidney damage, allergic reactions.
Miltefosine It can be used to treat different types of leishmaniasis.
Long treatment; fetus deformity. Requires daily injections. Cannot be administrated to children.
Paromomycin
Alternative treatment,
can be used in
combination with other anti-leishmanial drugs.
Chapter 1 | Trypanosomatids, Leishmaniasis and the Translation
Initiation Complex
Another important aspect related to leishmaniasis is the occurrence of cases in which the parasite is resistant to the current drugs available (CROFT, 2006). This, associated to a number of unpleasant side effects associated to these drugs, make the treatment of leishmaniasis more challenging and needs new drugs and strategies to fight the disease.
1.2: DNA transcription and trans-splicing
1.2.1: DNA transcription
Eukaryotic transcription is the process in which information contained in DNA is converted into RNA, being the first stage in gene expression. It has 3 major steps: transcription initiation, elongation and termination. Transcription initiation begins with DNA sequence, called promoter, binding to RNA polymerase, starting the transcription process.
Any required transcription initiation factors also bind at this stage. The promoter-RNA polymerase complex goes through structural changes, in such way that the DNA starts to unwind, forming a transcription bubble of single stranded DNA. The process occurs in the 5’ to 3’ direction and requires only one DNA strand as template.
During elongation, multiple tasks take place simultaneously; RNA synthesis is catalyzed, DNA is initially unwinded, then reannealed and the RNA product dissociated as the RNA polymerase moves along, and finally, the RNA product is proofread, in a process similar to “quality control”.
Chapter 1 | Trypanosomatids, Leishmaniasis and the Translation
Initiation Complex
1.2.2:
trans
-splicing
Splicing is the process of joining exons in order to form mature mRNA.
The majority of organisms use a cis-splicing method, in which the
introns of the same pre-mRNA transcriptome are removed, and its exons joined together (LIANG, 2003).
One remarkable characteristic of trypanosomatids is their use of trans-splicing. In trans-splicing, exons of distinct pre-mRNA transcripts are joined together, in such a way that the mature mRNA is composed of exons derived from different origins. Although “normal” cis-splicing is observed in a few genes in trypanosomatids, trans-splicing is responsible for almost the totality of mRNA formation.
Splicing requires a short RNA sequence called the Splice Leader RNA (SL RNA), that provides the RNA cap, needed for translation initiation. In trypanosomatids, the SL RNA has around 141 nt, of which 39 nt comprise the SL exon (LASDA, 2011).
Mechanistically, trans-splicing needs SL RNA and pre-mRNA. Typically, the SL exon is followed by a GU dinucleotide sequence (5’ splice site), while in the pre-mRNA, there is an A nucleotide that acts as the Branching Point (BP), followed by a polypyrimidine tract, responsible for spliceossome assembly, and before the exon sequence an AG dinucleotide sequence (3’ splice site).
Chapter 1 | Trypanosomatids, Leishmaniasis and the Translation
Initiation Complex
a Y-structured intermediary, that will undergo debranching and degradation. Figure 9 illustrates this mechanism.
Chapter 1 | Trypanosomatids, Leishmaniasis and the Translation
Initiation Complex
1.3: Trypanosomatid Translation Initiation Complex
Gene expression leading to protein synthesis is a vital process in all organisms, and requires a transcription stage, followed by translation. The translation stage is composed of four essential processes: initiation, elongation, termination and recycling.
Figure 10: Overview of gene expression leading to protein synthesis.
Protein synthesis has a very important role in gene expression. Its first stage, translation initiation, is believed to be the most important point in mRNA translation regulation, and therefore is commonly the main focus of such studies.
Chapter 1 | Trypanosomatids, Leishmaniasis and the Translation
Initiation Complex
in recycling the ribosomal complex on the mRNA is disassembled and prepared for a new round of translation.
It is believed that translation initiation is the main control stage in the process of protein synthesis, since it consumes a very large amount of energy, with works describing the production of more than 10000 protein molecules per cell, every second (FIRCZUK, 2013; VON DER HAAR, 2008). For this reason, studies that focused on translation initiation might provide very important biological data, that can be used, for example in the identification of new therapeutic targets.
The trypanosomatid translation initiation complex has unique characteristics, and has its parts assembled in a different way than observed in other eukaryotes.
Of particular relevance to the present study is the observation that a strong interaction between the translation factors eIF4G and PABP1 plays a significant role in the translation machineries of eukaryotes other than the trypanosomatids. Figures 11 and 13 display the proposed models of translation initiation complex, for higher eukaryotes and trypanosomatids (adapted from ZINOVIEV, 2012).
1.3.1: The Eukaryotic Translation Initiation Complex
Chapter 1 | Trypanosomatids, Leishmaniasis and the Translation
Initiation Complex
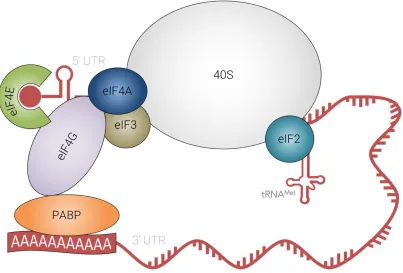
Figure 11: Model of higher eukaryotes translation initiation complex. Adapted from SHAPIRA, 2012.
eIF4E
Initiation factor eIF4E is responsible for m7GDP binding, being therefore
known as the “cap-binding” protein. The eIF4E structure is described as a “cupped hand” that holds the cap structure, and this binding enables the subsequent scanning process that leads to identification of a start codon (HINNESBUSCH, 2012).
PABP
poly-Chapter 1 | Trypanosomatids, Leishmaniasis and the Translation
Initiation Complex
is involved (together with eIF4F) in circularizing mRNA by binding to its 3’ poly(A) tail, and simultaneously to the eIF4F complex (that in its turn binds to the 5’ end of mRNA) (HINNEBUSCH, 2012).
eIF4G
eIF4G plays a recognized role as “scaffolding” protein. The reason for this is that it binds to several translation initiation factors, including eIF4E, PABP eIF4A, eIF1, eIF5, among others. This major role as a recruitment hub for other proteins assemble onto RNA, in such way that the mRNA circularizes by virtue of an interaction chain: 5'cap-eIF4E-eIF4G-PABP-poly(A) tail (KAPP, 2004).
eIF4A
eIF4A is an ATP-dependent DEAD RNA helicase, that is thought to act by removing secondary structure from the mRNA 5’-UTR region.
eIF2
eIF2 is involved in ternary complex formation, which comprises eIF2,
GTP and Met-tRNA. The ternary complex binds to the 40S subunit, thus
helping to prepare the ribosomal subunit for start codon recognition.
eIF3
Chapter 1 | Trypanosomatids, Leishmaniasis and the Translation
Initiation Complex
eIF4B
eIF4B is a RNA-binding factor related to eIF4A, enhancing its helicase activity. It is also involved in mRNA recruitment to the preinitiation
complex (PIC), that is composed of MettRNA, eIF1, eIF1A, eIF2 and eIF3.
eIF1, eIF1A and eIF5
eIF1 and eIF1A are a translation initiation factors that are part of the 43S PIC. They are described as being involved in 43S PIC “open conformation” stabilization. Their activity is required for the correct ribosomal scanning and codon selection. eIF5 is a GTPase-activating protein, involved in initiation codon recognition, interacting with the 40S ribosomal subunit. eIF5 binds to eIF2, inducing GTP hydrolysis during initiation codon recognition. (HINNEBUSCH, 2012).
eIF4F complex
The eIF4F complex is composed of eIF4E, eIF4G and eIF4A, and is responsible for 40S recruitment and is involved in cap-dependent translation initiation.
Chapter 1 | Trypanosomatids, Leishmaniasis and the Translation
Initiation Complex
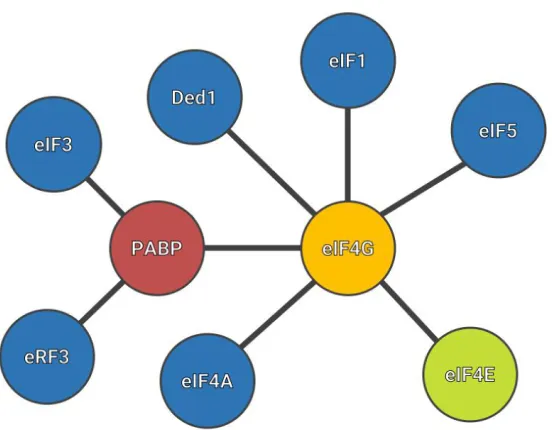
Figure 12: Simplified translation initiation complex interactome.
Among all the translation initiation factors, there are three that are particularly important in this work: eIF4E, PABP and eIF4G. In almost all eukaryotes, eIF4G acts as a “scaffold” factor, assembling a large number of different factors. However, in trypanosomatids, it is proposed that these interactions might be assembled differently, and as will be demonstrated in this work, an interaction between PABP and eIF4E.
Chapter 1 | Trypanosomatids, Leishmaniasis and the Translation
Initiation Complex
Trypanosomatids have multiple translation initiation factors isomers, and in the specific case of Leishmania, there are six eIF4E isoforms, two PABP isoforms and five eIF4G isoforms.
1.3.2:
Leishmania
eIF4E, PABP and eIF4G isoforms
Several Leishmania translation initiation proteins have multiple
isoforms. For instance, L. major has 6 eIF4Es, 3 PABPs and 5 eIF4Gs. A
summary of these proteins is presented below.
eIF4E
Leishmania has six eIF4E isoforms, eIF4E1 to eIF4E6, all located in the cytoplasm (FREIRE, 2017). The literature contains data regarding the first four isoforms, while little is known about the last two, more recently identified isomers. The eIF4E factors are expected to bind to both RNA’s
Chapter 1 | Trypanosomatids, Leishmaniasis and the Translation
Initiation Complex
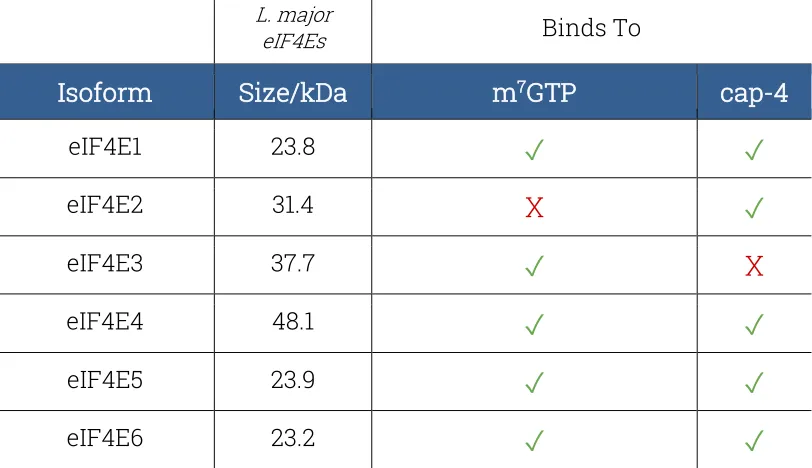
The literature shows that (ZINOVIEV, 2012; FREIRE, 2017) eIF4E1-6 have
different affinities toward m7GTP and cap4.
Table 2 Trypanosomatid eIF4Es affinities and L. major eIF4Es sizes.
L. major
eIF4Es Binds To
Isoform Size/kDa m7GTP cap-4
eIF4E1 23.8
✓
✓
eIF4E2 31.4
X
✓
eIF4E3 37.7
✓
X
eIF4E4 48.1
✓
✓
eIF4E5 23.9
✓
✓
eIF4E6 23.2
✓
✓
A particular feature in the isoforms eIF4E3 and eIF4E4 is the presence of a long, unique N-terminal segment, found only in trypanosomatids. The function of this longer N-terminal is not completely clear, and therefore, has been the object of considerable speculation. One major characteristic of this N-terminal extension is the lack of structure, possibly due to the presence of a large number of prolines in its sequence, since these are expected to destabilize secondary structure formation. eIF4E5 and eIF4E6 are the most recently described and least studied of the trypanosomatid eIF4Es. These are the small isoforms, with eIF4E6 being the smallest, and have limited homology with the other isoforms.
Chapter 1 | Trypanosomatids, Leishmaniasis and the Translation
Initiation Complex
expression depending on the parasite developmental stage, in such way that genes responsible for some of the eIF4E isomers (but not all) expression had their expression increased in the amastigote stage (but not in the promastigote).
There were several attempts in the literature to identify the different functions of each of eIF4E isoforms, and a summary is presented below (FREIRE, 2017).
eIF4E-1
Previous studies have revealed (YOFFE, 2006) that eIF4E-1 levels are significantly higher in amastigotes than in promastigotes. These variations might be associated with differences in environmental changes in temperature, since amastigotes are found in the mammalian host (higher temperatures), and axenic cultures of promastigotes cultivated at higher temperatures undergo a morphology change, losing the flagellum and becoming more rounded, amastigote-like. The expression of the other isoforms did not show significant differences with temperature variation.
eIF4E-2
Little is known regarding eIF4E2 function, but in trypanosomatids studies suggest that it may not be involved in translation (FREIRE, 2017). It binds
to cap-4 but not to m7GTP, and it is suggested that it might be associated
Chapter 1 | Trypanosomatids, Leishmaniasis and the Translation
Initiation Complex
eIF4E-3
eIF4E-3 binds to m7GTP but not to cap4, and for this reason it is unlikely
that it is the essential basal isoform (i.e. the one essential for cell survival) for trypanosomatid translation initiation. If eIF4E-3 is knocked out, cell death takes place both in promastigotes and amastigotes, and there are indications that it participates in translation, at least in promastigotes (FREIRE, 2011).
eIF4E-4
eIF4E-4 is the largest eIF4E isoform in trypanosomatids, and its long terminal sequence largely contributes to its increased size. This N-terminal sequence is not observed in any other eukaryotes, being unique to trypanosomatids. It has a high proline content, and it has been suggested that it is intrinsically disordered. These properties make the N-terminal region of eIF4E4 an important subject of research seeking to
understand its function and behaviour. eIF4E-4 binds both to m7GTP and
cap-4, and its knockout leads to cell death in amastigotes and arrests translation and impairs cell viability in promastigotes.
eIF4E-5 and eIF4E-6
Chapter 1 | Trypanosomatids, Leishmaniasis and the Translation
Initiation Complex
PABP
Trypanosomatid PABPs have a highly conserved structure, composed of 4 RRMs in the N-terminal, a non-conserved linking region, and a conserved PABC domain, in the C-terminal region (DA COSTA LIMA, 2010). In normal conditions, all three isoforms are found in the cytoplasm, with only marginal amounts being detected in the nucleus.
PABP1
The PABP1 is the isoform with the major translation initiation activity, being found in the cytoplasm. PABP1 is responsible for mRNA binding, through its RRM domains. It interacts with eIF4G3, and thus participates in eIF4F complex function (although it is not part of the eIF4F complex).
PABP2 and PABP3
PABP2 and PABP3 are believed to not to participate in translation initiation, being probably involved in other regulatory functions (DA COSTA LIMA, 2010). Experiments in which transcription was inhibited, both PABP2 and PABP3 accumulated in the nucleus, although not directly associated to the chromatin (BATES, 2000). It has been also suggested that PABP2 may play an important role in mRNA metabolism and regulation (DA COSTA LIMA, 2010; BATES, 2000). PABP3 was not studied in detail, so many aspects of its properties and functions are still to be determined.
eIF4G
Chapter 1 | Trypanosomatids, Leishmaniasis and the Translation
Initiation Complex
be divided into two groups with specific characteristics, as described below:
eIF4G1, eIF4G2 and eIF4G5
eIF4G1, eIF4G2 and eIF4G5 have so far not been linked functionally to translation initiation. They bind to eIF4E5 and eIF4E6 (FREIRE, 2014-1), and their functions are not yet clear, although it is suspected that they might have regulatory roles (FREIRE, 2014-2).
eIF4G3 and eIF4G4
eIF4G3 and eIF4G4 have been described as participating in translation initiation (DHALIA, 2004). Besides the characteristic MIF4G domain, the two proteins share several conserved segments, and its N-terminal is the most relevant. Both eIF4G3 and eIF4G4 have very short N-terminal regions, of only around 50 residues and 75 residues, respectively. This contrasts with the long eIF4Gs N-terminals from yeast (600 residues) and humans (700 residues) (MOURA, 2015).
1.3.3: Translation Elongation
Translation elongation is the most conserved step in protein translation (KAPP, 2004; DEVER, 2012), and its mechanism is very similar in different organisms, from bacteria to eukaryotes.
Chapter 1 | Trypanosomatids, Leishmaniasis and the Translation
Initiation Complex
1.3.4: Translation Termination
When a stop codon is found during the elongation process, the nascent peptide is released from the ribosome. The ribosomal subunits can then be recycled, and then used in the formation of a new initiation complex, for the production of another peptide (KAPP, 2004).
1.3.5: Recycling
The last step in translation initiation is recycling. In this step, the ribosomal subunits are disassembled, and then used for a new round of translation initiation. During this process, there is the release of mRNA and tRNA (KAPP, 2004).
1.4: MLLE Domains and PAM2 motifs
1.4.1: MLLE Domain
The MLLE domain is a well-known peptide binding motif, composed of
around 70 aminoacid residues, organized in five α-helices. The MLLE,
Chapter 1 | Trypanosomatids, Leishmaniasis and the Translation
Initiation Complex
1.4.2: PAM2 Motif
The PAM2 motif, or PABP-interacting Motif 2, recognizes proteins containing the MLLE domain, and has the following conserved amino acid sequence:
(L/P/F)
x
(P/V)
x
A
xx
(F/W)
x
P
(1) Or commonly:LN
xx
A
x
EF
x
P
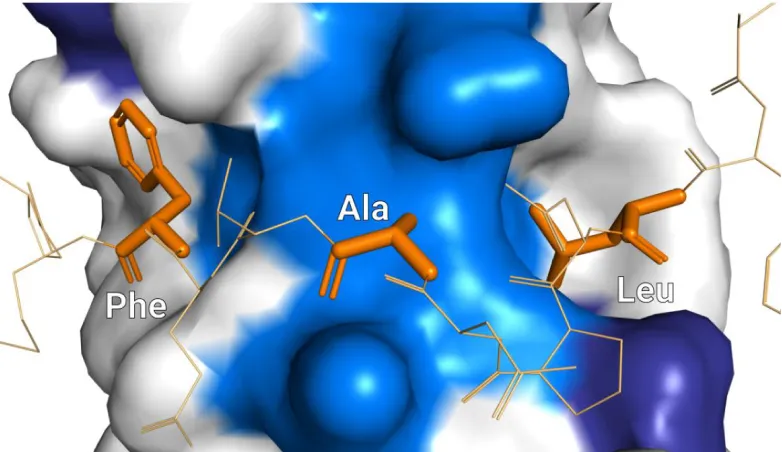
(2)The PAM2 motif binds to MLLE domains by interacting with hydrophobic
pockets that are formed along the MLLE domain α-helices. There are
three amino acid residues in particular in the PAM2 motif that are important for the binding to MLLE, the first conserved leucine, and the conserved alanine and phenylalanine (KOZLOV, 2010; XIE, 2014).
1.4.3: PAM2/MLLE Interaction
The PAM2 residues interact with a number of amino acid residues in MLLE domains (KOZLOV, 2010). However, as described previously, the first conserved leucine, the conserved alanine and the conserved phenylalanine are particularly relevant. The leucine and phenylalanine
bind to hydrophobic pockets located in the α-helices around the central
α-helix in the MLLE domain, while the PAM2 conserved alanine exploits
Chapter 1 | Trypanosomatids, Leishmaniasis and the Translation
Initiation Complex
Figure 14: PAM2 key residues interacting with MLLE domain; hydrophobic pockets highlighted in dark blue.
Chapter 1 | Trypanosomatids, Leishmaniasis and the Translation
Initiation Complex
1.5: Objectives
1.5.1: General Objectives
1. To investigate the architecture of the trypanosomatid translation
complex comprising eIF4E4, PABP1 and eIF4G3. Trypanosomatid eIF4E4 has a unique, long N-terminal, making it an interesting object of research, that could potentially be used as a drug target, since these interactions are not observed in humans.
1.5.2: Specific Objectives
1. To characterize the interactions between Leishmania major
eIF4E4, eIF4G3, and PABP1.
2. To characterize structural details of the eIF4E4-PABP1 interaction.
3. To quantitate the relative affinities of the eIF4E4-PABP1 and the
Chapter 2 | Techniques Overview – Materials and Methods
Chapter 2 – Techniques Overview - Materials and
Methods
2.1: Buffers List
A number of buffers were used in the various experiments, their names and composition are listed below:
Buffer A:
150 mM KCl
10 mM Tris-HCl pH 8 10% glycerol
10 mM MgCl2
10 mM β-Mercaptoethanol
Buffer B:
150 mM KCl
10 mM HEPES pH 7.5 5% glycerol
1 mM DTT
Buffer C
150 mM KCl
20 mM Tris-HCl pH 7.5 5% Glycerol
10mM MgCl2
5 mM β-Mercaptoethanol
0.01 % Triton X-100
Buffer D
100 mM KCl
20 mM Tris-HCl pH 7.5
10 mM MgCl2
5% Glycerol
Buffer E
300 mM KCl
40 mM Tris-HCl pH 7.4 2 mM EDTA
0.1% Triton X-100 5% Glycerol
5 mM β-Mercaptoethanol
1 mM PMSF
Buffer F
50 mM HEPES pH 7.5 100 mM NaCl
1 mM DTT
Chapter 2 | Techniques Overview – Materials and Methods
2.2: Constructs Preparation
Our studies aimed the investigation of interactions between Leishmania’s eIF4E4 and PABP1 proteins. eIF4E4 is a 48kDa protein from Leishmania major, that binds to mRNA’s cap structure, and presents the following primary structure:
10 20 30 40 50
MSTPLDVRAAEYSPSFAVTMKKTVAAAPPKSPAPAKSKISVTRTGVNTTY
60 70 80 90 100
PMPPPMPEKNYAPFFAEGCQTIAASKASMPPVQPASPLPPMHSAPPTASV
110 120 130 140 150
VSNSIPPSSPATAPGERSPAVAARSVPTRFSPATVPRHHMNPNATEFMPG
160 170 180 190 200
RRNGPDGGLEALPTSTADMELAKTPAGAAAAAVHAPSLPGAVRRSLQNSP
210 220 230 240 250
IIQPSRLSVKSASEIEAISKNSALNAAAAAYVPQRTLARVVLTQPSPLAL
260 270 280 290 300
APSEDPAKNNIEMMLDDLWCLFYLPTTLGENIKEEDYNPTLVFRVDSILT
310 320 330 340 350
FWRVVNNIAAPSELQLSTLYLFRDGIDPKWEDPANRDGGIVKVKATAAQV
360 370 380 390 400
DEAWELLLCRTIGDSWSPSVRETVNGVVLKVRERAYWLELWVTKNSSALQ
410 420 430 440 447
KDLAELWHPILGASFATTYLTHAMMQERSHAAAALAAEKQKKNRRRY
Chapter 2 | Techniques Overview – Materials and Methods
PABP1 is a 62kDa protein from Leishmania major, that binds to mRNA’s poly(A) tail, and presents the following primary structure:
10 20 30 40 50 MAAAVQEAAAPVAHQPQMDKPMQIASIYVGDLDATINEPQLVELFKPFGT 60 70 80 90 100 ILNVRVCRDIITQRSLGYGYVNFDNHDSAEKAIESMNFKRVGDKCVRLMW 110 120 130 140 150 QQRDPALRYSGNGNVFVKNLEKDVDSKSLHDIFTKFGSILSCKVMQDEEG 160 170 180 190 200 KSRGYGFVHFKDETSAKDAIVKMNGAADHASEDKKALYVANFIRRNARLA 210 220 230 240 250 ALVANFTNVYIKQVLPTVNKDVIEKFFAKFGGITSAAACKDKSGRVFAFC 260 270 280 290 300 NFEKHDDAVKAVEAMHDHHIDGITAPGEKLYVQRAQPRSERLIALRQKYM 310 320 330 340 350 QHQALGNNLYVRNFDPEFTGADLLELFKEYGEVKSCRVMVSESGVSRGFG 360 370 380 390 400 FVSFSNADEANAALREMNGRMLNGKPLIVNIAQRRDQRYTMLRLQFQQRL 410 420 430 440 450 QMMMRQMHQPMPFVGSQGRPMRGRGGRQQLGGRAQGHPMPMPSPQQPQAP 460 470 480 490 500 AQPQGFATPSAVGFVQATPKHSPGDVPETPPLPPITPQELESMSPQEQRA 510 520 530 540 550 ALGDRLFLKVYEIAPELAPKITGMFLEMKPKEAYELLNDQKRLEERVTEA 560
LCVLKAHQTA
Chapter 2 | Techniques Overview – Materials and Methods
Figure 16: Leishmania PABP1 segmentation in several domains.
2.2.1: Restriction based cloning and Gibson assembly
Subcloning:
Cloning technique was used in order to obtain some of the vectors for protein expression.
The cloning procedure was performed as follows:
The gene of interest was amplified using primers with 5’ overhangs containing the desired restriction sites.
Chapter 2 | Techniques Overview – Materials and Methods
Insert and vector purification was performed using Thermo Scientific GeneJET Plasmid Purification kit, and if required, gel extraction was done using Thermo Scientific GeneJET Gel Extraction Kit.
The insert was digested using 100µL reactions, composed by 10µL of digestion buffer (specific to the restriction enzymes used), and 2µL of each restriction enzyme, and 88µL of nuclease-free water. The vector was digest also in 100µL reactions, composed by 10µL of digestion buffer (specific to the restriction enzymes used), and 2µL of each restriction enzyme, 10µL of vector and 78µL of nuclease-free water. The reactions were then incubated at 37˚C for 1 hour.
Vector dephosphorylation was made by adding 1µL of FastAP Thermosensitive Phosphatase (Fermentas), incubated at 37˚C for 15 minutes, and inactivated by incubation at 75˚C for 5 minutes. The products were then purified using Thermo Scientific GeneJET Plasmid Purification kit and used for ligation.
The insert/vector ligation was performed in 10µL reactions, using 1µL of 10*NEB Ligase buffer, and the appropriate volume of vector/insert in order to achieve a 1:3 vector/insert molar ratio; then 1µL of T4 ligase, and enough nuclease-free water to total 10µL.
The mixture was incubated at room temperature for 30 minutes, ant then transformed into E. coli.
Gibson Assembly:
Chapter 2 | Techniques Overview – Materials and Methods
5x Isothermal Reaction Mix
-Tris-HCl pH 7.5: 500mM
-MgCl2: 100mM
-dATP: 1mM -dCTP: 1mM -dGTP: 1mM -dTTP: 1mM -DTT: 50mM -PEG8000: 30mM -NAD: 5mM
-ddH2O to the desired volume
1.33x Assembly Master Mix
Protocol for 1.2 mL of Master Mix:
-320μL 5X Isothermal Master Mix
-0.64μL 10 U/μL T5 exonuclease
-20μL 2 U/μL Phusion DNA Pol
-0.16μL 40000 U/μL Taq DNA
Ligase
-860μL ddH2O
For the reaction, 15µL of Gibson Master Mix was added to 2.5µL of digested vector, and then split in two 7.0µL aliquots, A and B. To aliquot A, 1.0 µL of sterile, nuclease-free water was added, to be used as negative control. To aliquot B, 1.0 µL of 10µM GeneBLOCK was added, and then incubated in a thermocycler at 50˚C for 30 minutes. After the reaction ended, 2.0 µL of the reaction was transformed into competent cells and plated on selective media. The Figure 17 summarizes the procedure.
Chapter 2 | Techniques Overview – Materials and Methods
2.2.2:
E. coli
transformation
E. coli transformation for protein expression was performed as follows: The appropriate amount of competent cells were thawed and added into a single sterile 1.5mL Eppendorf tube. In another tube, 1.0 µL of vector was added, and then 40-70µL of competent cells were then added to the vector.
The tubes were then incubated on ice for 10 minutes, and then heat-shocked for 30 seconds at 42˚C. The tubes were then cooled down on ice for 1 minute, and 0.5-1.0 mL of sterile LB/SOC media added to the tubes, which were then incubated for 30-60 minutes at 37˚C. Finally, the cells were plated on selective media (LB-agar + antibiotic) and incubated overnight at 37˚C.
2.2.3: Protein overproduction
All proteins were prepared as follows, unless stated otherwise:
The media chosen for protein expression was Terrific Broth with 25 mM
Ampicillin. When the OD600 reached 0.6-0.8, enough IPTG was added to
reach 1.0mM concentration. The overexpression was conducted at 16˚C, for 16h.
Chapter 2 | Techniques Overview – Materials and Methods
After sonication, the cells were pelleted by centrifugation at 16000 rpm for 30 minutes at 4˚C in a Beckman-Coulter Allegra 64R centrifuge using F0685 rotor. The supernatant was collected and then used for protein extraction and purification.
2.3: Protein purification
Protein purification was performed using a combination of methods, essentially affinity and size exclusion.
2.3.1: Affinity purification
The supernatant obtained in the protein overproduction stage was incubated overnight with cobalt resin (HisPur, Thermo Fisher Scientific). After the incubation, the resin was washed thoroughly and then eluted with at least 10 1.0mL elutions of Buffer A with 150 mM imidazole. The elution aliquots were then joined into a single sample, and then concentrated using Sartorius Vivaspin 3000 MWCO PES 20mL concentrators, filter at 3000 rpm in an Eppendorf 5810R centrifuge using S-4-104 rotor until the volume was reduced to 500-1000 µL. The concentrated fractions were then used in size exclusion chromatography, in order to isolate monomeric protein from any aggregates.
2.3.2: Size Exclusion chromatography purification
Chapter 2 | Techniques Overview – Materials and Methods
Increase 75/300 GL and Superdex Increase 200/300 GL (depending on the protein size), equilibrated with 2 CV until constant mAU, in order to separate protein monomers from aggregates (1.0mL loop, emptied with 0.7mL; flow of 0.3mL/min, 600µL fractions). After gel filtration, the fractions containing the protein monomer were, if needed, concentrated (but avoiding aggregation), aliquoted and stored at -80˚C for use in the various experiments.
2.4: Protein identification
In order to verify each step of protein production, it was necessary to confirm protein identities. A combination of electrophoresis and mass spectrometry was used, according to the stage of protein production/purification.
2.4.1: SDS-PAGE
After protein production and purification, these were subject to analysis by SDS-PAGE and Mass Spectrometry in order to confirm the success in its attainment.
Chapter 2 | Techniques Overview – Materials and Methods
2.4.2: Mass spectrometry
The identification of protein identities was performed by mass spectrometry, using a nanoLC-ESI-MS/MS approach. For this purpose, SDS-PAGE sections containing protein bands of interest were digested and analyzed according to the following protocol:
Initially, the bands containing the proteins of interest were cut from the SDS-PAGE gels and digested with trypsin, and then the peptides separated by reversed phase chromatography. For the separation, two columns were utilized, an Acclaim PepMap µ-precolumn cartridge 300
µm i.d. x 5 mm 5 μm 100 Å and an Acclaim PepMap RSLC 75 µm x 25 cm
2 µm 100 Å (Thermo Scientific), installed on an Ultimate 3000 RSLCnano system (Dionex). Two mobile phases were also used; the mobile phase A was composed by 0.1% formic acid in water and mobile phase B 0.1 % formic acid in acetonitrile. In the next step, the samples were loaded onto the µ-precolumn equilibrated in 2% aqueous acetonitrile containing 0.1% trifluoroacetic acid for 8 min at 10 µL min-1 after which peptides were eluted onto the analytical column at 300 nL min-1 by increasing the mobile phase B concentration from 4% B to 25% over 22 min then to 90% B over 3 min, followed by a 10 min re-equilibration at 4% B.
The isolated peptides were then subjected to electrospray ionization and analyzed on a Thermo Orbitrap Fusion system (Q-OT-qIT, Thermo Scientific). Precursor peptides scanning from 375 to 1500 m/z were
performed at 120K resolution (at 200 m/z) with a 2 × 10⁵ ion count target.
Chapter 2 | Techniques Overview – Materials and Methods
103 and the max injection time was 200 ms. Precursors with charge state
2–6 were selected and sampled for MS2. The dynamic exclusion duration was set to 30 s with a 10 ppm tolerance around the selected precursor and its isotopes. Monoisotopic precursor selection was turned on. The instrument was run in top speed mode with 1 s cycle.
Data Analysis
The obtained MS raw data was processed using MSConvert in ProteoWizard Toolkit (version 3.0.5759)1. All the MS2 spectra were searched with Mascot engine (Matrix Science, version 2.4.1) against
provided Leishmania database and the common Repository of
Adventitious Proteins Database
(http://www.thegpm.org/cRAP/index.html). Peptides were generated from tryptic digestion with up to two missed cleavages, carbamidomethylation of cysteines as fixed modifications, and oxidation of methionines as variable modifications. Precursor mass tolerance was 10 ppm and product ions were searched at 0.8 Da tolerances.
Chapter 2 | Techniques Overview – Materials and Methods
2.5: Surface Plasmon Resonance
Surface Plasmon Resonance is a technique that detects changes of the refractive index on a surface upon ligand binding. In this technique, a gold-coated chip is covered with a chemical matrix, often dextran, that can then be used for a range of different methods of target immobilization. Protein-ligand studied can explore a number of different immobilization methods, such as amine coupling, thiol coupling, His-tag affinity, to mention a few.
The usual strategy involves the immobilization of a target protein on the surface chip, using one of the methods aforementioned. After immobilization, the ligand binding can then be investigated, by its addition at varied concentrations. If the ligand binds to the target protein, the local refractive index changes, and this change can be measured by changes in the angle of a laser that is irradiating the chip. The refractive index change is proportional to ligand binding, and through this measure, a number of data can be obtained, as affinity, kon koff rates, among others.
The SPR experiments were performed using a GE Biacore T200 instrument, and surface-binding chip CM5.
The immobilization strategy used was amine coupling, using eIF4E4(iv) (0.2mM) protein as the ligand, Buffer B, flow-path number 2, until an immobilization level of around 1000 units was obtained.
2.5.1: Yes/No binding experiment
Chapter 2 | Techniques Overview – Materials and Methods
experiment is used to screen a number of ligands and verify if they bind to an immobilized partner on the chip’s surface.
Experimental Conditions: -Buffer C
-Regeneration Solution: MgCl2 1M
-Injection Time: 300 s -Regeneration Time: 120 s
-Dissociation Time: 300 s -Cell Flow: 10µL/min -Cell Flow Mode: 2-1
2.5.2: Binding affinity experiment
The Affinity experiment comprises of the sequential run of different analytes, in this case PABP1 domains, at varied concentrations. These experiments are useful to assess the binding behaviour of a ligand, and in ideal conditions, determine its affinity towards a binding partner. Experimental Conditions:
-Buffer C
-Regeneration Solution: MgCl2 1M
Chapter 2 | Techniques Overview – Materials and Methods
2.6: Microscale Thermophoresis
The MST experiments were performed in a Nanotemper Monolith NT.115 instrument, using standard Monolith NT.115 Capillaries. Protein labelling with fluorescent tag was made using Monolith Protein Labelling Kit Red-Maleimide.
MST experiments detects binding on the basis of alterations in thermal diffusion when a complex is formed, when compared with the thermal diffusion of the individual complex components.