warwick.ac.uk/lib-publications
Manuscript version: Author’s Accepted Manuscript
The version presented in WRAP is the author’s accepted manuscript and may differ from the
published version or Version of Record.
Persistent WRAP URL:
http://wrap.warwick.ac.uk/108977
How to cite:
Please refer to published version for the most recent bibliographic citation information.
If a published version is known of, the repository item page linked to above, will contain
details on accessing it.
Copyright and reuse:
The Warwick Research Archive Portal (WRAP) makes this work by researchers of the
University of Warwick available open access under the following conditions.
Copyright © and all moral rights to the version of the paper presented here belong to the
individual author(s) and/or other copyright owners. To the extent reasonable and
practicable the material made available in WRAP has been checked for eligibility before
being made available.
Copies of full items can be used for personal research or study, educational, or not-for-profit
purposes without prior permission or charge. Provided that the authors, title and full
bibliographic details are credited, a hyperlink and/or URL is given for the original metadata
page and the content is not changed in any way.
Publisher’s statement:
Please refer to the repository item page, publisher’s statement section, for further
information.
Characterizing and Predicting Early Reviewers
for Effective Product Marketing on E-Commerce
Websites
Ting Bai, Wanye Xin Zhao
Member, IEEE,
Yulan He
Member, IEEE,
Jian-Yun Nie
Member, IEEE,
Ji-Rong Wen
Member, IEEE
Abstract—Online reviews have become an important source of information for users before making an informed purchase decision. Early reviews of a product tend to have a high impact on the subsequent product sales. In this paper, we take the initiative to study the behavior characteristics of early reviewers through their posted reviews on two real-world large e-commerce platforms,i.e.,Amazon
and Yelp. In specific, we divide product lifetime into three consecutive stages, namelyearly,majorityandlaggards. A user who has
posted a review in the early stage is considered as an early reviewer. We quantitatively characterize early reviewers based on their rating behaviors, the helpfulness scores received from others and the correlation of their reviews with product popularity. We have found that (1) an early reviewer tends to assign a higher average rating score; and (2) an early reviewer tends to post more helpful reviews. Our analysis of product reviews also indicates that early reviewers’ ratings and their received helpfulness scores are likely to influence product popularity. By viewing review posting process as a multiplayer competition game, we propose a novel margin-based embedding model for early reviewer prediction. Extensive experiments on two different e-commerce datasets have shown that our proposed approach outperforms a number of competitive baselines.
Index Terms—Early reviewer, Early review, Embedding model.
F
1
I
NTRODUCTIONThe emergence of e-commerce websites has enabled users to publish or share purchase experiences by posting product reviews, which usually contain useful opinions, comments and feedback towards a product. As such, a ma-jority of customers will read online reviews before making an informed purchase decision [1]. It has been reported about 71% of global online shoppers read online reviews before purchasing a product [2]. Product reviews, especially the early reviews (i.e.,the reviews posted in the early stage of a product), have a high impact on subsequent product sales [3]. We call the users who posted the early reviews early reviewers. Although early reviewers contribute only a small proportion of reviews, their opinions can determine the success or failure of new products and services [4], [5]. It is important for companies to identify early reviewers since their feedbacks can help companies to adjust mar-keting strategies and improve product designs, which can eventually lead to the success of their new products.
For this reason, early reviewers become the emphasis to monitor and attract at the early promotion stage of a company. The pivotal role of early reviews has attracted extensive attention from marketing practitioners to induce consumer purchase intentions [6]. For example, Amazon, one of the largest e-commerce company in the world, has
• T. Bai, W. X. Zhao (contact and co-first author) and J. Wen are with School of Information in Renmin University of China, China. Both of them are also with Beijing Key Laboratory of Big Data Management and Analysis Methods, Beijing, China.
• Y. He is with the School of Engineering and Applied Science, Aston University, United Kingdom.
• J.Nie is with Department of Computer Science and Operations Research, University of Montreal.
advocated theEarly Reviewer Program1, which helps to
ac-quire early reviews on products that have few or no reviews. With this program, Amazon shoppers can learn more about products and make smarter buying decisions. As another related program, Amazon Vine2 invites the most trusted reviewers on Amazon to post opinions about new and pre-release items to help their fellow customers make informed purchase decisions.
Based on the above discussions, we can see that early reviewers are extremely important for product marketing. Thus, in this paper, we take the initiative to study the behavior characteristics of early reviewers through their posted reviews on representative e-commerce platforms, e.g.,Amazon and Yelp. We aim to conduct effective analysis and make accurate prediction on early reviewers. This prob-lem is strongly related to the adoption of innovations. In a generalized view, review posting process can be considered as an adoption of innovations3, which is a theory that
seeks to explain how, why, and at what rate new ideas and technology spread [8]. The analysis and detection of early adopters in the diffusion of innovations have attracted much attention from the research community. Three fundamental elements of a diffusion process have been studied: attributes of an innovation, communication channels, and social net-work structures [8]. However, most of these studies are
1.https://www.amazon.com/gp/help/customer/ display.html? nodeId=202094910
2.https://www.amazon.com/gp/vine/help
theoretical analysis at the macro level and there is a lack of quantitative investigations. With the rapid growth of online social platforms and the availability of a high volume of so-cial networking data, studies of the diffusion of innovations have been widely conducted on social networks [9]–[12]. However, in many application domains, social networking links or communication channel are unobserved. Hence, existing methods relying on social network structures or communication channels are not suitable in our current problem of predicting early reviewers from online reviews.
To model the behaviors of early reviewers, we develop a principled way to characterize the adoption process in two real-world large review datasets,i.e.,Amazon and Yelp. More specially, given a product, the reviewers are sorted according to their timestamps for publishing their reviews. Following [8], we divide the product lifetime into three con-secutive stages, namelyearly,majority andlaggards. A user who has posted a review in the early stage is considered as an early reviewer. In our work here, we mainly focus on two tasks, the first task is to analyze the overall characteristics of early reviewers compared with the majority and laggard reviewers. We characterize their rating behaviors and the helpfulness scores received from others and the correlation of their reviews with product popularity. The second task is to learn a prediction model which predicts early reviewers given a product.
To analyze the characteristics of early reviewers, we take two important metrics associated with their reviews, i.e.,their review ratings and helpfulness scores assigned by others. We have found that (1) an early reviewer tends to assign a higher average rating score to products; and (2) an early reviewer tends to post more helpful reviews. Our above findings can find relevance in the classic principles of personality variables theoryfrom social science, which mainly studies how innovation is spread over time among the participants [8]: (1) earlier adopters have a more favorable attitude toward changes than later adopters; and (2) earlier adopters have a higher degree of opinion leadership than later adopters. We can relate our findings with the per-sonality variables theory as follows: higher average rating scores can be considered as the favorable attitude towards the products, and higher helpfulness votes of early reviews given by others can be viewed as a proxy measure of the opinion leadership. Our analysis also indicates that early reviewers’ ratings and their received helpfulness scores are likely to influence product popularity. We further explain this finding with the herd behavior widely studied in eco-nomics and sociology [13]–[15]. Herd behavior refers to the fact that individuals are strongly influenced by the decisions of others.
To predict early reviewers, we propose a novel approach by viewing review posting process as a multiplayer compe-tition game. Only the most competitive users can become the early reviewersw.r.t.to a product. The competition pro-cess can be further decomposed into multiple pairwise com-parisons between two players. In a two-player competition, the winner will beat the loser with an earlier timestamp. Inspired by the recent progress in distributed representa-tion learning [16], [17], we propose to use a margin-based embedding model by first mapping both users and products into the same embedding space, and then determining the
order of a pair of users given a product based on their respective distance to the product representation.
Previous studies have highly emphasized the phe-nomenon that individuals are strongly influenced by the decisions of others, which can be explained by herd behav-ior[6], [13]–[15], [18]–[20]. The influence of early reviews on subsequent purchase can be understood as a special case of herding effect. Early reviews contain important product evaluations from previous adopters, which are valuable reference resources for subsequent purchase decisions. As shown in [19], when consumers use the product evalua-tions of others to estimate product quality on the Internet, herd behavior occurs in the online shopping process [19]. Different from existing studies on herd behavior, we focus on quantitatively analyzing the overall characteristics of early reviewers using large-scale real-world datasets. In addition, we formalize the early reviewer prediction task as a competition problem and propose a novel embedding based ranking approach to this task. To our knowledge, the task of early reviewer prediction itself has received very little attention in the literature. Our contributions are summarized as follows:
• We present a first study to characterize early review-ers on an e-commerce website using two real-world large datasets.
• We quantitatively analyze the characteristics of early reviewers and their impact on product popularity. Our empirical analysis provides support to a series of theoretical conclusions from the sociology and economics.
• We view review posting process as a multiplayer competition game and develop a embedding-based ranking model for the prediction of early reviewers. Our model can deal with the cold-start problem by incorporating side information of products.
• Extensive experiments on two real-world large datasets,i.e., Amazon and Yelp have demonstrated the effectiveness of our approach for the prediction of early reviewers.
2
P
RELIMINARIESWe first introduce the concepts and notations used in this paper. The symbols and notations used in what follows are summarized in Table 1 .
LetU denote a set of e-commerce users, andP denote a set of e-commerce products. A user review d, a sequence of text tokens, is associated with a set of six elements
hu, p, r, s, nY, nNi, which denotes that user u ∈ U (a.k.a.,
review writer or reviewer) has posted a review on product
p ∈ P with the ratingr at the timestamps, and review d
receivesnY ‘yes’ votes andnN ‘no’ votes from other users. We assume that a product pis associated with a category label cp and a title description tp. Our focus is to study the adoption process of a product, hence, we first build a sorted review list for the product. Given a productp, we can sort itsNp reviews according to the corresponding publish timestamps to derive a list of ordered reviews, denoted by
TABLE 1 Notations and Descriptions.
Notations Descriptions
U a set of e-commerce users,u∈ U P a set of e-commerce products,p∈ P
r, s ratingrposted by a user with a timestampson a product nY, nN the number of ‘yes’ votes and ‘no’ votes a review received
d a reviewdis composed ofhu, p, r, s, nY, nNi cp, tp the category labelcpand title descriptiontpof a product
Lp a list of ordered reviews of a productp, Lp:d1→d2...→di...→dNp ∆(Lp) the leading gap for productp ∆(Tp) the trailing gap for productp ∆(Mp) the maximum interval for productp
vp,vu low-dimensional representation vector of productpand useru
vtp,vcp title embedding and category embedding of productp S(p, u) the likelihood that userubecomes an early reviewer of productp
received reviews within an observation window. Based on these notations, we first introduce several important defini-tions used throughout the paper, as well as their estimation on our datasets.
2.1 Products with Complete Lifetime
Definition 1. Product Review Time Span refers to the time span between the first and last received reviews for a product. Formally, given a productp, itsproduct review time spanis the range between the timestamps of its first and last reviews,i.e.,
[s1, sNp].
Our observation window is defined as the period be-tween the start and end time of datasets. Amazon dataset contains product reviews ranging from May 1996 to July 2014, and Yelp dataset contains product reviews ranging from July 2004 to January 2017. The observation windows are 18 years and 13 years respectively. It might be the case that some products have their reviews falling outside of our observation window. We propose the following strategy to determine whether a product’s review time span is complete within our observation window.
2.1.1 Determining the Complete Review Time Span
We first introduce the concepts ofleading gapandtrailing gap. Given an observation window[sstart, send], the leading gap
of a productp, denoted by∆(Lp), is defined as the time dif-ference betweens1(when the first review was found within the observation window) andsstart, while the trailing gap
∆(Tp)of a productpis defined as the time difference between
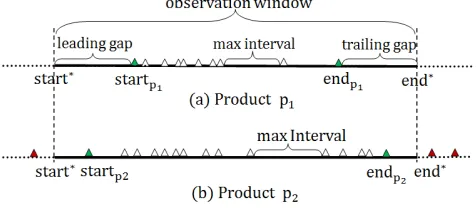
sNp(when the last review was found within the observation window) and send. Our key idea is that if the maximum interval between two consecutive reviews of a productpis smaller than both the leading and trailing gaps of product
p, then we have observed a complete review time span (e.g., Figure 1(a)). However, if it is not the case, then we have only observed a partial product review time span (e.g., Figure 1(b)). We denote the maximum interval for product p by
∆(Mp), and it is computed as:∆(Mp) = maxNp−1
i=1 si+1−si
. Based on our idea, we consider the lifetime for productpis complete if it satisfies:∆(Lp)>∆(Mp)and∆(Tp)>∆(Mp).
2.1.2 Estimating the Product Lifetime
[image:4.612.49.303.66.205.2]Given a product, we take its complete review time span as a proxy measure of its lifetime. It should be noted the time
Fig. 1. An illustrative example on the complete and incomplete review time span for a product. In our observation window, productp1has a complete review time span while productp2 has an incomplete review time span. Green triangles indicate the observed boundaries of product review time span, and red triangles represent reviews which are outside the observation window.
span derived from product reviews may not exactly align with the actual product lifetime from a customer’s point of view, i.e., the period of time over which a product is first brought to market and eventually removed from market. Since our current datasets do not contain any explicit pur-chase information, it is not possible to accurately derive the product lifetime. Nevertheless, as indicated in [7], many of the reviews indeed correspond to actual purchases. Also, as will be discussed later, the estimated product lifetime is used for dividing reviewers into different groups. Hence, it is reasonable to estimate a product’s lifetime by its review time span. In our current work, we are only interested in products with complete lifetime,i.e.,complete review time spans.
2.2 Early Reviewer Identification
Given a complete product lifetime, we study how to divide the product lifetime into different stages so as to identify early reviewers. In the e-commerce website, the review posting process of users can be viewed as an adoption process of innovations. The process of adoption over time is typically illustrated as a classical normal distribution or “bell curve” and is divided into five stages [8]. Users are then categorized accordingly into five different groups, called innovators, early adopters, early majority, late majority and laggards (see Figure 2). Following [8], [11], we apply the classic Rogers’ bell curve theory to divide the product lifetime into five consecutive stages. In our datasets, the number of innovatorsis usually very small, and hence we combineinnovatorsand early adoptersas theearly reviewers. In addition, we also combineearly majorityandlate majority asmajority, since it is usually difficult to reliably distinguish these two groups. Also, we transform the original intervals expressed in terms of the number of standard deviations from the mean into probabilities using simple cumulative distribution computation. The probability ranges for early, majority andlaggards are [0,0.16),[0.16,0.84)and [0.84,1]
respectively. Our final categorization of users is presented in Figure 2. With the staged lifetime of a product, we are ready to defineearly reviewandearly reviewer.
Definition 2. Early review and early reviewer. Given a
Fig. 2. An illustrative example on the stage division using Roger’s theory [8]. The x-axis denotes the adoption time. The probability ranges for the three review categoriesearly,majorityandlaggardsare[0,0.16), [0.16,0.84)and[0.84,1]respectively.
early reviewfor productp. The user (a.k.a.,reviewer) who wrote the reviewdis called anearly reviewerfor productp.
Note that both early review and early reviewer are product-specific. A user might post a number of reviews, but only a fraction of these reviews are early reviews of some products. We assume that a user would only post one review for a given product, which is true most of the time in our datasets. As such, the number of early reviews is equal to the number of times that she acts as an early reviewer for some products. The early reviewers are particularly crucial to business organisations since their opinions have high impact on both the decisions of subsequent adopters and marketing strategies or product designs of companies [5]. An important topic in the diffusion of innovations is to find out what kind of traits determine users’ tendency to adopt an innovation [8], [21].
In what follows, Section 3 first describes the datasets construction. Section 4 then analyzes the characteristics of early reviews and early reviewers. Section 5 proposes a margin-based ranking model for the prediction of early reviewers given a product. Experimental setup and results are presented in Section 6. Related work is discussed in Section 7. Finally Section 8 concludes the paper.
3
D
ATAP
REPARATIONIn this paper, we use the Amazon [7], [22] and Yelp4 datasets. Amazon dataset originally contains 142.8 million product reviews ranging from May 1996to July 2014and Yelp dataset contains 4.7 million product reviews ranging from July 2004 to January 2017. Each review is a textual comment posted by a user on a product, and is accompanied with its publish timestamp which accurates to days in our study. A review is associated with a rating score in a five-star scale. Each product is associated with a category label and a textual description. Given a review, other Amazon users can vote on its helpfulness using a binary choice ofYesor No button. The number of votes on positive attitude (i.e., Yes) and negative attitude (i.e., No) can be recorded. While in Yelp dataset, other users can only vote on the helpfulness of a review by clicking theUsefulbutton, and explicit negative attitude on the helpfulness is not recorded.
4.https://www.yelp.com/dataset
0 2 4 6
1 2 3 4 5 6 7
# Early Reviews
# Users
Log Log
(a) Amazon
0 1 2 3 4 5
2 4 6 8
# Users
Log
Log # Early Reviews
(b) Yelp
Fig. 3. #early reviewsv.s.#users. #early reviews is the number of early
reviews that a user has posted,i.e.,the number of times that a user has
acted as an early reviewer of a product.
3.1 Data Cleaning
Our data cleaning contains two main steps as follows.
3.1.1 Preprocessing
We first remove reviews from anonymous users, since we would like to associate each review with a unique user. We then remove duplicate reviews often caused by multiple versions of the same product. We also remove inactive users and unpopular products: we only keep the users who have posted at least ten and five reviews, and products which have received at least ten and five reviews in Amazon and Yelp datasets respectively. For review text, we remove stopwords and very infrequent words.
3.1.2 Review Spammer Detection and Removal
Our focus is to study the early adoption behaviors of gen-uine Amazon and Yelp users. However, as shown in [23], the number of spam reviews has increasingly grown on e-commerce websites, and it was found that about 10% to
15% of reviews echoed earlier reviews and might be posted by review spammers. It is possible that spam reviews are posted to give biased or false opinions on some products so as to influence the consumers’ perception of the products by directly or indirectly inflating or damaging the product’s reputation. The existence of spam reviews could lead to erroneous conclusions in our study. Therefore, we need to remove review spammers as part of our data cleaning process.
Here, we adopt the approach proposed in [24] to remove review spammers. Overall, the approach considers three factors: Early deviation spamming (ED), Review text spam-ming (RT) and Time based spamspam-ming (TS). We employ a linear regression model to combine the three factors to make the final decision, and calculate the score of a reviewer’s spamming behavior as: S(u) = αSED(u) +βSRT(u) + γST S(u). SED(u), SRT(u) and ST S(u) are the scores of spamming behavior by the above three factors,α, β, γ are the tuning weights for combining these three factors and we haveα+β+γ= 1. In our experiments, we empirically setα=β =γ= 1/3, and finally have identified4.65% and
[image:5.612.327.559.46.170.2]Fig. 4. The percentage of Amazon users posting early reviews in differ-ent bins by product categories.Three bins are considered,i.e.,[0,50], (50,100]and(100,+∞).
3.2 Basic Statistical Analysis
Using the categorization thresholds listed in Figure 2, we label each review with a stage label (i.e.,early, majority and laggard). Given a product, the review with anearlylabel is an early review and the user who wrote the review is an early reviewer. We can count the number of times that a user has acted as an early reviewer,i.e.,the number of early reviews she has posted.
Early reviews present power-law probability distribution. In Figure 3, we plot the statistics of the number of usersv.s. the number of early reviews that a user has posted. It can be observed that the distribution of data points is very similar to power law. Both figures indicate that the vast majority of users acted as early reviewers very few times. Based on our statistics, about 70% and 85% users in Amazon and Yelp datasets acted as early reviewers no more than ten times. Such results are consistent with our intuition: Early reviews are about a small and emerging market segment; Most users are cautious when making purchase decisions.
Product category influences user’s enthusiasm of
adopt-ing new products. We further examine more closely the
statistics by each product category. Our datasets contain products from twenty main categories. For each category, we compute the number of early reviews that a user has posted for the products within this category. We discretize users into three bins based on the total number of early reviews they have posted:[0,50],(50,100]and (100,+∞)
[image:6.612.52.299.42.188.2]in Amazon dataset and [0,10], (10,20] and (20,+∞) in Yelp dataset and present the results in Figure 4 and 5. It is interesting to see that different product categories tend to get different number of early reviews from users. For example, in the Baby category in Amazon dataset, over 97% users posted less than 50 early reviews. This shows that users are more cautious in adopting new products for babies. In Yelp dataset, over 25% users posted more than 10 early reviews in theFashioncategory. This indicates that users are more likely to adopt new fashionable products.
Fig. 5. The percentage of Yelp users posting early reviews in different bins by product categories. Three bins are considered, i.e., [0,10], (10,20]and(20,+∞).
4
Q
UANTITATIVELYA
NALYZING THEC
HARACTER-ISTICS OF
E
ARLYR
EVIEWERSIt has been reported that early adopters are important to the diffusion of innovations [8]. Hence, we hypothesize that early reviewers play a key role in future product adoptions. There has been a lack of quantitative analysis of the corre-lations between the early reviewers and product adoptions on large datasets,i.e.,Amazon and Yelp. In this section, we study how early reviewers are different from others and how they impact product popularity.
4.1 Characteristics of Early Reviewers
To understand how early reviewers are different from other-s, we start with an analysis of their posted early reviews by looking into average ratings of the reviews and helpfulness scores voted by others. Using the categorization method discussed in Section 2, we assign each review into one of the three categories defined in Figure 2. Recall that each review is associated with a rating score and votes on its helpfulness. The rating score is in a five-star scale. For helpfulness, in Amazon dataset, we count the number ofYesandNovotes respectively and then normalize them to the range of[0,1]. While in Yelp dataset, users vote on the helpfulness of a review by clicking theUsefulbutton. We count the number
ofUsefuls as the review’s helpfulness score. Given the three
categories of reviews, we compute the average ratings and helpfulness scores in each review category.
Early reviewers tend to assign a higher average rating score.We compare the average rating scores of reviews by the three categories in Figure 6. It is observed that early reviews are more likely to associate with a higher rating score than those from the other two categories. Note that we have removed spam reviews since their ratings tend to be extreme, either too high or too low.
Early reviewers tend to post more helpful reviews. We
compare the average helpfulness scores of reviews by the three categories in Figure 7. Note that Amazon dataset contains both Yes and No votes of reviews, we use the percentage ofYesvotes to represent the helpfulness scores of a review. While in Yelp dataset, we use the number
1 2 3 4 5
Rating
Mean
4.09 Mean3.94 Mean3.86
Early Majority Laggard
(a) Amazon
1 2 3 4 5
Rating
Early Laggard
Mean
3.71 Mean
3.47 Mean 3.57
Majority
[image:7.612.55.300.50.135.2](b) Yelp
Fig. 6. Comparisons of the rating scores by the three categories of reviews.
0 0.2 0.4 0.6 0.8
’Yes’ Votes Proporation
Majority Laggard Early
Mean 0.56 Mean
0.44
Mean 0.31
(a) Amazon
0 4 8 12
# Useful Votes
Laggard Majority
Early Mean
1.92 Mean1.22 Mean0.95
(b) Yelp
Fig. 7. Comparisons of the helpfulness scores by the three categories of reviews.
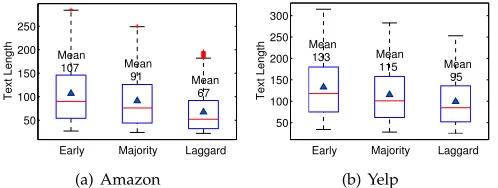
Amazon and Yelp datasets indicate that early reviews are more helpful with higher helpfulness scores than those from the other two categories. This might be caused by the accumulation time of review data: early reviews themselves tend to receive more attention. To reduce the effect of time span, in Amazon dataset, we report both the count ofYes and No votes and the normalized Yes and No votes (i.e., the proportion ofYesandNovotes) by the three categories in Table 2. It can be observed that the counts of bothYes and No votes for early reviews are significantly higher than those of the other two categories, especially the count of Yes votes. The higher normalized Yes votes of early reviews indicates that early reviewers tend to post more helpful reviews. To further understand why early reviews are more helpful, we conduct the analysis on the text length of reviews. Figure 8 presents the boxplot for the distribution of review length for the three categories. It is observed that on average early reviews are longer than reviews in the other two categories. By inspecting early reviews, we find that long reviews tend to contain much important feedback or comment information about the product attributes or features, which is very helpful as reference resources for users’ subsequent purchase.
50 100 150 200 250
Text Length
Mean
107 Mean
91 Mean
67
Early Majority Laggard
(a) Amazon
50 100 150 200 250 300
Text Length
Majority Laggard
Mean
133 Mean
115
Early
Mean 95
(b) Yelp
[image:7.612.53.297.184.273.2]Fig. 8. Comparisons of review text length by the three categories of reviews.
TABLE 2
Comparisons of the helpfulness scores by the three categories of reviews in the Amazon dataset.
Categories No. of ‘Yes’ No. of ‘No’ Normalized ‘Yes’ Normalized ‘No’ Early 15.5±0.21 3.28±0.05 0.72±0.002 0.28±0.002 Majority 4.98±0.05 2.28±0.02 0.68±0.001 0.32±0.001 Laggards 2.23±0.04 1.44±0.03 0.67±0.003 0.33±0.003
Connection with personality variables theory. Our above findings can find relevance in the well-known principles in personality variables theory which mainly studies how innovation is spread over time among the participants [8]. The theory emphasizes two important traits of the early adopters:
• Principle about personality variables: Earlier adopters have a more favorable attitude toward changes than later adopters;
• Principle about communication behavior: Earlier adopters have a higher degree of opinion leadership than later adopters.
We can relate our findings to the personality variables theory as follow:
• higher average rating scores can be considered as the favorable attitude towards the products;
• higher helpfulness votes of early reviews given by others can be viewed as a proxy measure of the opinion leadership.
Therefore, our analysis results are consistent with the per-sonality variables theory, and provide empirical evidence to the latter.
4.2 The Impact on Product Popularity
In this subsection, we investigate how early reviews impact product popularity. We do not have the actual product purchase transactions in our datasets. However, the num-ber of online reviews of a product indicate the product’s popularity since customers usually only write reviews after they make product purchases. As such, for a product, we approximate its daily popularity as the average daily num-ber of reviews posted in the majority stage. In computing popularity values, reviews in both the early and laggards stages are discarded since reviews in the former group are used to identify their impact on product popularity while reviews in the latter group introduce noises for popularity value calculation. We use the rating and helpfulness scores to check the impact of early reviews on the change of popularity. For ease of analysis, we first discretize both kinds of continuous scores into disjoint value intervals. For ratings, we use four bins:[1,2],(2,3],(3,4],(4,5]in Amazon and Yelp datasets. For helpfulness scores, we discretize the helpfulness scores of [0,1] into two consecutive bins in Amazon dataset, i.e., A : [0,0.5], B : (0.5,1]; In Yelp dataset, the helpfulness score is represented as the number
ofUsefulvotes. We first compute the median and then use
[image:7.612.52.301.621.715.2]A B C D 0 0.2 0.4
Books A B C D 0.1 0.2 0.3
Electronics
A B C D 0 0.5 1
Home and Kitchen
A B C D 0 0.1 0.2
Pet Supplies
A B C D 0 0.5 1
Office Products A B C D 0 2 4
Digital Music
(a) Amazon
A B C D 0.02 0.04 0.06
A B C D 0.01 0.02
A B C D 0.01 0.02 0.03
A B C D 0.02 0.04 0.06
A B C D 0.02 0.04 0.06
A B C D 0 0.02 0.04
Bars Coffee & Tea Nightlife
Beauty & Spas Shopping
Restaurants
[image:8.612.51.297.48.156.2](b) Yelp
Fig. 9. Daily popularity vs. different rating bins for six product categories. The y-axis denotes the average popularity per day over the products in a category. We discretize the early review rating score of [1,5] into four consecutive bins,i.e.,A: [1,2),B: [2,3),C: [3,4)andD: [4,5].
A B 0 0.2 0.4 A B 0 0.2 0.4 A B 0 0.3 0.6 A B 0 0.1 0.2 A B 0 0.5 1 A B 0 1 2 Electronics Books
Home and Kitchen Pet Supplies
Office Products Digital Music
(a) Amazon A B 0 0.05 0.1 A B 0 0.05 A B 0 0.05 A B 0 0.05 A B 0.02 0.04 0.06 A B 0 0.05 0.1 Restaurants Shopping Bars Beauty & Spas
Coffee & Tea Nightlife
(b) Yelp
Fig. 10. Daily popularity vs. different helpfulness bins for six product categories in Amazon and Yelp datasets. We consider two kinds of reviews, i.e., positive reviews (red lines) and negative reviews (blue
lines). The y-axis denotes the average popularity per day over the products in a category. In Amazon dataset, we discretize the helpfulness scores of [0,1] into two consecutive bins,i.e.,A: [0,0.5],B: (0.5,1];
In Yelp dataset, we use the median to set the two bins for helpfulness scores:A: [0, median],B: (median,+∞).
Due to space constraint, we only report the results from six product categories in Amazon and Yelp datasets.
A higher average rating score of early reviews is likely to indicate a higher product popularity. Given a product, we first calculate its average rating score of its early reviews, and then assign it to the corresponding rating bin defined above. We present the average daily popularity over the products in different product categories by rating bins in Figure 9. Overall, the figure shows a upward trend with the increment of the average rating scores from the early reviews.
A higher helpfulness score of early reviews is likely to increase or decrease product popularity. Different from rating scores, a high helpfulness score does not necessarily indicate positive opinions towards a product. If a negative review gives very good reasons behind its negative feed-back, the review is likely to be perceived as helpful by other customers and hence would receive a fairly high number
of Yes or Useful votes. Hence, to examine the impact of
review helpfulness scores, we need to discriminate between two types of reviews, i.e., positive reviews (a rating of at least four stars) or negative reviews (a rating of at most two stars). We report the daily popularity with different helpfulness bins in Figure 10. It is interesting to observe
that a higher helpfulness score on positive reviews generally leads to higher product popularity, whereas it is the reverse for negative reviews.
Connection with the herd behavior theory. In economics
and sociology, herd behavior is an important concept [13]– [15], which describes that individuals are strongly influ-enced by the decisions of others in various situations. Herd behavior emphasizes the influence from existing adoption behaviors of others, especially the early adopters. It has been verified that online herd behavior occurs when people use the product evaluations of others to indicate product quality on the Web [14]. Our findings can be explained with the herd behavior theory in a specific setting, where existing online adoption information is reflected via the rat-ed reviews. We characterize the influence of early adopters using two metrics, namely average rating and helpfulness scores. Our work provides clear quantitative evidence to the herd behavior through the analysis on two real-world e-commerce datasets. Interestingly, besides the well-known positive influence, we have observed a negative impact of early adopters on product sales when they assign low rating scores to a product.
5
PREDICTING EARLY REVIEWERS
We have so far shown that early reviews are indeed impor-tant to product popularity. Next a practical question is: giv-en a product, can we predict who will become its reviewers at the early stage of its release to market? Such a prediction can have the following potential benefits. First, identifying early reviewers is helpful to monitor and manage early promotion. Second, early reviewers are very likely to be the actual adopters of a product, leading to direct purchase. In what follows, we first formally define the early reviewer prediction task, and then propose a novel embedding-based ranking approach for predictive modeling.
5.1 Problem Formulation
Given a product p and a candidate user set Up :
{u1, u2, ..., uNp}, the task of predicting early reviewersaims to produce a top-Klist of users from Up, who would post
reviews on p at the early stage of product p in market. Producing a top-K list can be formulated as a ranking problem. We propose to use a ranking function S(p, u)
to select users, which measures the likelihood that user
u becomes an early reviewer of product p. To learn such a function, we assume that a training set of past early adoption records is available, i.e., {hpi,Lii}. Each training
instance consists of a productpi with a complete lifetime,
and Li : hu (i) 1 , s
(i)
1 i → hu (i) 2 , s
(i)
2 i... → hu (i) Np, s
(i)
Npii is an
ordered list of reviewers {u(ji)} on pi by the timestamps
{s(ji)}when publishing the reviews.
[image:8.612.53.294.219.344.2]information to help with this ranking problem. We assume that a product p is with a category label cp and a title description tp and use the two types of side information to learn product representations or embeddings as will be discussed in Section 5.2.
A competition-based viewpoint to the ranking task. To
address the ranking problem, we draw our inspiration from multiplayer competition to develop our approach. Generally speaking, given a productpand two candidate usersuand
u0, we seek to model the partial order between them. We consider the review posting process as multiplayer compe-tition [26]: only the most competitive users can become the early reviewersw.r.t.a product. The competition process can be further decomposed into multiple pairwise comparisons between two player. A competition is carried out between two users given a product. In a two-player competition, the winner will beat the loser with an earlier timestamp. Formally, we useup u0 denote that useruhas an earlier
review timestamp thanu0for productp. Competition-based ranking has been previously explored for community ques-tion answering [27] and player ranking [26]. However, to the best of our knowledge, it has never been explored for early reviewer or early adopter prediction.
5.2 A Margin-based Embedding Model for Predicting Early Reviewers
The essence of this task is to model the partial order between two candidate usersuandu0 given a productp. Hence, we can cast the total order ranking problem into a pairwise comparison problem. Inspired by the recent progress in distributed representation learning [16], [17], we propose to use an embedding model for this task. We assume that both users and products are mapped into a latent space. In this way, a user u is modeled with a low-dimensional representation vectorvu, and a productpis modeled with a
low-dimensional dense representation vectorvp. In the
em-bedding space, we can reconstruct the partial order relations in the training set and learn the model parameters.
5.2.1 Modeling the Pairwise Comparison
Based on the embedding representation, we can define the objective functionS(p, u)as an inner product between user and product embeddings,i.e.,
S(p, u) =vp>·vu. (1)
In the embedding space, it is expected that vp> ·vu >
v>
p ·vu0 whenup u0. Given the original training setA=
{hpi,Lii}, we first transform them into a set of partial order
pairsT ={up u0|u, u0 ∈ Lp}, whereLp is the reviewer
list of productp.
To learn such embeddings, we minimize a margin-based ranking criterion [17] over the training setT:
`(T) = X
upu0∈T
[m+S(p, u0)−S(p, u)]+, (2)
= X
upu0∈T
[m+v>u0·vp−vu>·vp]+,
where[x]+ = max(0, x)andmis the margin coefficient set to 0.1 in our experiments. The objective function in Eq. 2 is very intuitive. Whenup u0 andS(p, u)< S(p, u0), there
would incur a cost. We would like to optimize the objective function by trying to fit all the partial order pairsup u0.
5.2.2 Learning the Product Embeddings
A major problem with the above objective function is that the learning of product embeddings relies on the past re-view data. When a new product is released, we are not able to learn its embedding since no review data exists. Recall that a productpis with a category labelcpand a title descriptiontp. These two kinds of side information can be used to pre-train the product embeddings. A title descrip-tion is a sequence of word tokens. To learn effective semantic representations for text,word2vec is a commonly adopted model. It will be possible if we can utilize the learned word embeddings to derive the product embeddings in current cold-start setting. To achieve this, a simple method will be to aggregate the embeddings of the words in the title description of a product as its embedding. In our work, we borrow the idea from thedoc2vecmodel [28] which learns feature representations from variable-length pieces of texts, and produces the representations for both documents and words.
The document embedding in doc2vec can be used to summarize the information of the entire text in a document. If we consider a title of a product as a document,doc2vec will produce a representation for the product. In the CBOW architecture ofword2vec, each wordwi is generated based on its surrounding word contextwi−c:wi+c,i.e.,modeling P r(wi|wi−c : wi+c). As a comparison, in doc2vec, a doc
ID is also incorporated into the context of word w, i.e., modeling P r(wi|wi−c : wi+c, tp), wheretp represents the
title of a productp. In our data, we also have the category label for a product. As shown in Figure 4 and 5, the category information has an impact on early user adoption behaviors. To incorporate both the title and category label, we model the generative probability P r(wi|wi−c : wi+c, tp, cp). The titletpwill influence the generation of all the words in the
title description of a productp, while the category will serve as the context of all the title words from the products in this category. To derive the word context, average pooling is used. Based on the context, the word generation is modeled with the softmax function as a multi-classification problem. Since we incorporate the product category label here, we call our modellabeleddoc2vec. Although we only consider product title and category here, it is possible to extend our model to incorporate other information, such as the brand of a product.
We assume that all the embeddings (except the final embedding vu and vp in Eq. 2) in this model have the
dimension number of L. When the model is learned, we can obtain the embeddings for words (vw ∈ RL), titles
(vtp ∈ R L
) and category labels (vcp ∈ R L
). Our product embedding representation is finally a vectorized concate-nation of title embedding and category embedding, i.e., vp =vec(vtp,vcp), where vec(·,·)takes two column vectors and returns a concatenated column vector. Withvp ∈R2L,
we have to set the dimension number for vu to 2L, i.e.,
Algorithm 1The learning algorithm for user embeddings.
Inputtraining instancesT ={upu
0
|u, u0∈ U }, products embeddings set{vp},
learning rateλ, margin coefficientm, embedding dimensionsL.
Outputuser embeddings{vu|∀u∈ U }
Procedure:
1:initialize user embeddings: 2: vu←unif orm(−√6
L, 6
√
L),∀u∈ U
3: vu←vu/||vu||,∀u∈ U
4: loop
5: sample a training instancehupu0i ∈ T do
6: update user embeddings:
7: vu:=vu−∂`∂(vT)
u ,
8: vu0 :=vu0−∂`(T)
∂v
u0
. 9: until convergence
5.2.3 Learning the User Embeddings
To learn the embedding parameters in Eq. 2, we can simply apply Stochastic Gradient Descent (SGD) for updating user embeddings{vu}and product embedding{vp}. However,
the available review data of a product may not be sufficient for training its product embedding well, especially for new products which have received few reviews. To handle the cold start problem, we incorporate the title and category information to pre-learn the product embeddingsvp.
Dur-ing the learnDur-ing process, we fix the product embeddDur-ings obtained with the labeled doc2vec, and only optimize the user embeddings.
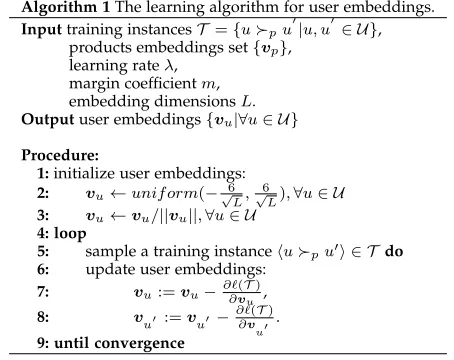
To learn our parameters, we propose to use SGD for opti-mization. The detailed optimization procedure is described in Algorithm1. All embeddings for users are first initialized randomly according to uniform distribution, the strategy proposed in [29]. At each main iteration of the algorithm, a training triplethp, u, u0i, where we have the partial order
up u0, is sampled from the training set for optimizing the
margin-based ranking criterion function`(T). The parame-ters,i.e.,user vectorsvuandvu0, are then updated by taking
a standard gradient descent step. Assume that the number of reviews of a product isn, the total number of comparison pairs that can be generated is roughly estimated asO(n2). When the number of products is very large, the number of comparison pairs will become enormous. A commonly used acceleration method for stochastic gradient descent is to use random sampling over the instances in the training set. However, we argue that all comparison pairs should not be treated equally. Recall that each review is assigned with a category label in a complete product lifetime, i.e., early, majority and laggards. We are more interested in deriving more accurate comparisons between an early reviewer and a non-early reviewer. Hence, we keep all the comparison pairs involving an early reviewer and a non-early reviewer, while other comparison pairs are selected with random sampling.
6
E
XPERIMENTS ONE
ARLY REVIEWERP
REDIC-TION
[image:10.612.60.287.41.221.2]In this section, we conduct experiments to evaluate our pro-posed margin-based embedding model for early reviewer prediction.
TABLE 3
Statistics of the evaluation sets in early reviewer prediction. ANRU and ANRP are the abbreviations of Average Number of Reviews posted by each User and Average Number of Reviews received by each Product.
Dataset #Product #User #Pairs ANRU ANRP
Amazon 12,814 16,355 3,122,797 18 23
Yelp 2,545 3,912 282,718 14 22
6.1 Datasets
Since it is unreliable to include users or products with very few reviews for evaluation, we remove the products which are associated with less than 50 reviews in Amazon dataset and 10 reviews in Yelp dataset, and users who posted less than 50 reviews in Amazon dataset and 10 reviews in Yelp dataset. The statistics of the data sets used in our experiment are shown in Table 3. Note that “#Pairs” indicates the total number of comparison pairs that can be generated in our evaluation set following the method discussed in Section 5.2. Given a product, although its associated reviews in our evaluation set are only a subset of all reviews found about this product in the original dataset, the temporal order of these reviews (and the corresponding reviewers) remains the same. We assign the category labels to reviewers based on the original dataset and use them as our ground truth.
6.2 Evaluation metrics
Given a product, each candidate method will produce an ordered list of users. Hence, we adopt three ranking-based metrics for evaluation of predicting results.
Overlapping Ratio at rankk(OR@k). Given the predicted ordered list of users for a product,OR@kis defined as:
OR@k=|L
(k)∩ G(k)|
k , (3)
where L(k) and G(k) denote the sets of users returned by a candidate method and obtained by sorting according to actual timestamps for the first k reviewers respectively. Note that whenkis larger than the actual number of early reviewers given a product, G(k) would contain users who are not early reviewers.
Hit ratio at rank k (Hit@k). Given the predicted ordered list of users for a product,Hit@kis definedp as:
Hit@k=
Pk
i=1I(p, ui)
Np(E)
, (4)
where I(p, ui) returns 1 if ui was an early reviewer for
product p in original dataset, and 0 otherwise; and Np(E)
is the actual number of early reviewers for productp.
Ratio of Correct Comparison Pairs (RCCP). Since our
model is trained from comparison pairs, we also use RCCP to measure the quality of pairwise ranking, which is defined as:
RCCP =#correctly predicted pairs
reviewers are more important to consider. Hence, we mainly use the aforementioned metrics for top-kranking.
6.3 Methods to Compare for Early Reviewer Prediction
Our task is to predict who will become early reviewers of a product. We consider three kinds of methods for compar-isons: statistics-based methods, competition-based models and our margin-based embedding ranking model.
6.3.1 Simple Statistics-based Methods
A straightforward approach to this task is to calculate the number of times (or the ratio) that a user has acted as an early reviewer in history data. Intuitively, if a user has posted many early reviews in the past, she is also likely to post early reviews on a new product. So we use the following metrics to estimate users’ ranking score of being early reviewers.
• NR: Rank the users simply based on the Number of Reviews (NR) that they have previously posted. • NER: Rank the users based on the Number of times
that a user has previously acted as an Early Reviewer (NER).
• PER: Rank the users based on the Proportion that a user has acted as an Early Reviewer (PER). PER is defined as:
P ER(u) =N ER(u)
N R(u) . (6)
• SPER: Rank the users based on Smoothed PER. The PER might be biased when NR is small. We propose to use the Smoothed Proportion that a user acts as an Early Reviewer (SPER), which is defined as:
SP ER(u) = N R(u)
N R(u) +ρP ER(u) (7)
+ ρ
N R(u) +ρP ERavg,
whereρ= |U |1 ·P
u∈UN R(u), andP ERavg = |U |1 ·
P
u∈UP ER(u).
The above statistics-based methods are only able to generate a single ranklist of users for all the products, which cannot incorporate pairwise comparisons and the product information. We further propose competition-based models and margin-based embedding ranking model.
6.3.2 Competition-based Models
The competition based methods take competition relation into consideration, which we utilize in our task of predicting early reviewers. We consider four methods for comparison.
• TS: [26]: TrueSkill is a Bayesian skill rating system which is designed to calculate the relative skill levels of players in multiplayer games. It assumes that the practical skill level of each competitor u follows a normal distributionN(µu, σu2), whereµis the
aver-age skill level andσis the estimation uncertainty. In our experiment, we set the initial values of the skill levelµand the standard deviation σof each player to the default values used in [26].
• SVMComp: [27]: The SVMComp model learns the
weight of each user based on pairwise comparisons using the classic Support Vector Machine (SVM). Given a two-player competition k with a winner
u and a loser u0, there are two training instances generated: ya = 1, xa[u] = 1, xa[u0] = −1 and
y0a = 0, x0a[u] = −1, x0a[u0] = 1. We use the toolkit SVM LibLinearwith linear kernel [30].
• B-T[31]: Bradley-Terry (B-T) model is a probability model that can predict the outcome of a comparison. It learns a scalar parameter for each of the player from historic pairwise comparison data. These pa-rameters usually represent the ranks or strengths of individuals, with higher ranks favored for the win over lower ranks in future comparisons. Following the method in [32], we use the maximum likelihood estimation to obtain the strengthγuof useru. • B-C[32]: The above methods use a single number
to represent a player, which is a bit simplistic. In contrast, Blade-Chest (B-C) model learns a multi-dimensional representation for each player from pairwise comparisons. We adopt the open-source code to implement this model5.
The above four models consider pairwise comparisons between users, but it still can not utilize the information from the product side. In other words, the partial order of two users remains the same for all the products in these models. Hence we propose our margin-based embedding ranking model which involves both competition compar-isons and the information of the products and learns the representation of users automatically.
6.3.3 Margin-based Embedding Model
This is our proposed Margin-based Embedding Ranking Model (MERM) proposed in Section 5.2. To our knowledge, no previous studies applied embedding models for predict-ing early reviewers. Our model can characterize both user comparison relations and the information from the product side. Hence, it is expected to give better performance than the above baseline methods. Currently, we mainly utilize the title and category information. It will be straightforward to incorporate other kinds of product information as the context of a competition between two users.
For all the methods, we report the performance using five-fold cross-validation. Note that we split data into five folds based on products,i.e.,the entire reviews of a product are either in the training set or test set. The parameters of a method are optimized using cross-validation. In B-C, we set the number of dimensions of blade and chest vectors to 200 and 300 in Amazon and Yelp datasets respectively. In our model MERM, we also set the number of embedding dimensions2L = 200and2L = 300in Amazon and Yelp datasets respectively. For each product, we consider all the users who have posted a review of it as candidate users. To make the evaluation more realistic, we also sample five times of “negative” users who did not review the target product but review other products in the same category.
TABLE 4
Performance comparison on the results of early reviewer prediction.
Datasets Amazon Yelp
Models OR@5 OR@10 Hit@5 Hit@10 RCCP OR@5 OR@10 Hit@5 Hit@10 RCCP
NR 0.0910 0.1416 0.1105 0.2088 50.15% 0.0704 0.1187 0.0605 0.1110 55.26 %
NER 0.1018 0.1516 0.1260 0.2131 61.17% 0.0810 0.0982 0.1134 0.2052 60.53%
PER 0.1114 0.1577 0.1334 0.2218 64.96% 0.0738 0.0896 0.0971 0.1794 56.21%
SPER 0.1125 0.1614 0.1353 0.2261 65.31% 0.0763 0.1025 0.1060 0.2149 57.27%
B-T 0.0931 0.1437 0.1120 0.2050 64.31% 0.0864 0.0939 0.1044 0.1859 59.89%
B-C 0.1132 0.1635 0.1361 0.2390 62.23% 0.0931 0.1016 0.1120 0.1952 59.36%
TS 0.1265 0.1720 0.1450 0.2465 67.54% 0.0904 0.1013 0.1350 0.2300 59.82%
SVMComp 0.1283 0.1747 0.1483 0.2503 67.97% 0.0955 0.1045 0.1341 0.2201 60.13%
MERM 0.1524∗ 0.2273∗ 0.1665∗ 0.2823∗ 69.25%∗ 0.1212∗ 0.1333∗ 0.1462∗ 0.2360∗ 68.57%∗
Note:“∗”indicates the statistically significant improvements (i.e.,two-sidet-test withp <0.01) over the best baseline.
6.4 Results and Analysis
[image:12.612.317.561.224.332.2]We present the results on early reviewer prediction in Table 4. It can be observed that the simplest baseline of ranking users based on the number of reviews posted before (NR) performs the worst. It indicates that users posted a large number of reviews are not necessarily active in early adoption of products. NER improves over NR, which shows that a user who has acted as an early reviewer for other products before is more likely to adopt new products in the future. PER, outperforms NER in Amazon dataset, while underperforms NER in Yelp dataset. The smoothed PER, i.e.,SPER, performs better than PER. The two comparison-based baselines B-T and B-C outperform the statistics-comparison-based methods only in some cases, and do not yield significant improvement. These results are consistent with the finding previously reported in [27] that a simple ratio based method works well when the training data is sufficiently large. Over-all, B-C performs better than B-T. Instead of using a single value, B-C adopts a vectorized representation for model-ing the player strength. Furthermore, the two competition-based methods TS and SVMComp improve upon all the above baselines. Although SVMComp is slightly better than TS, there is no significant difference between them. TS is a classic competition model for characterizing the player strength, while SVMComp has been shown to be effective in QA expert finding task [27]. These two methods perform best among our baselines.
Our proposed model MERM achieves significant im-provement in comparison to all the baselines. Compared with other baselines which only measure the earliness level of a user with a single value, MERM learns the mutil-dimensional representation of users from comparative pairs. Although B-C also adopts a mutil-dimensional representa-tion for modeling player strength, it does not perform very well in our task. A possible reason is that B-C needs to learn more parameters (i.e.,both blade vectors and chest vectors); while, in our datasets, the comparison pairs for training are sparse. The key difference of MERM is that it learns product embeddings also based on the side information in-volving both the title and category information of products. It effectively projects both product and user embeddings into the same continuous space for direct comparison and ranks users by optimizing a margin-based ranking objective function in a product dependent manner.
In our second sets of experiments, we further examine
20% 40% 60% 80% 100%
0.04 0.08 0.12
SPER TS SVMComp B−T B−C MERM
OR@5
Proportion of training data
(a) Varying the size of training da-ta.
100 200 300 400 500 0.04
0.08 0.12
SPER TS SVMComp B−T B−C MERM
OR@5
Proportion of training data
(b) Varying the embedding dimen-sions (i.e.,2L).
Fig. 11. Early reviewer prediction performance with different sizes of training set or embedding dimensions in Amazon dataset.
the impact of the amount of training data on the results of early reviewer prediction. We present the results of A-mazon dataset, the results of Yelp dataset are similar and are omitted here. By fixing the test data at 20%, we vary the remaining 80% training data at five different splits:
{20%,40%,60%,80%,100%}. The results are presented in Figure 11(a). Overall, we observe that all the methods suffer from performance drop with the decrement of training data. Our method MERM performs generally better than other methods with any amount of training data. We also vary the number of dimensions (i.e., 2L) for user and product representation in B-C and MERM, and report the results in Figure 11(b). It can be observed that the dimensionality of 200 yields the best performance.
7
RELATED WORK
Our current study is mainly related to the following three lines of research.
7.1 Early Adopter Detection
to the studies of herd behavior [6], [13]–[15], [18]–[20], which describes that individuals are strongly influenced by the decisions of others, such as in stock market bubbles, decision-making, social marketing and product success. As for product marketing, consumers frequently select popular brands because they believe that popularity indicates better quality [13]. For example, in digital auctions, buyers tend to bid for listings that others have already bid for, while ignoring similar or more attractive unbid-for listings [33]. Similarly, an experimental study shows that the social in-fluence of early adopters’ choices of songs leads to both inequality and unpredictability of the songs in terms of download counts [3]. Some further investigations also reveal that product evaluations from previous adopters, such as star ratings and sales volume, influence customers’ online product choices [13]. The analysis and detection of early adopters in the diffusion of innovations have attracted much attention from the research community. Generally speaking, three elements of a diffusion process have been studied: attributes of an innovation, communication channels, and social network structures [8]. Early studies are mainly theo-retical analysis at the macro level [5], [34]. With the rapid growth of online social platforms and the availability of a high volume of social networking data, studies of the diffusion of innovations have been largely conducted on so-cial networks, including resource-constrained networks [9], following or retweet networks [10], user-click graphs [12] and text-based innovation networks [11].
7.2 Modeling Comparison-based Preference
Comparison-based preference has been studied for several decades [31], [35], [36], and a survey of the classic approach-es and methods was given in [37]. By modeling comparison-based preference, we can essentially perform any ranking task. For example, in information retrieval (IR), learning to rank aims to learn the ranking for a list of candidate items with manually selected features [38]. Three categories of widely used learning to rank approaches include pointwise, pairwise and listwise methods [39]. Apart from IR, the competition-based ranking methods have also been widely studied in games and matches, where the aim is to evalu-ate the skill level of each involved player [40]–[43]. These studies typically only use a scalar value as the measure of the skill rating of an individual player. For example, based on the two-player model [44], TrueSkill ranking system [26] developed by Microsoft uses a univariate Gaussian distri-bution to model each player’s skill and uncertainty. There are also studies that aim at inferring each player’s strength through learning from group competition [45], [46]. These methods represent the properties of each item or player as a single number, which can not well adapt to many complex real-world settings. To address this problem, several studies propospe to use more expressive ways of modeling players, such as generalized Bradley-Terry model with vectorized representations for the preference ranking task [47], [48]. More recently, Chen et al. have proposed to use multi-dimensional representations to capture both intransitivi-ty [32] and context information [49] for modeling pairwise comparison relations. In sociology, it is a common sense that competition is usually correlated with expertise [50].
Following this, many studies try to model the expertise level of a user using a competition-based ranking approach,e.g., community question and answering platforms [27], [51] and generalized crowdsourcing systems [50], [52].
7.3 Distributed Representation Learning
Since its seminal work [53], distributed representation learn-ing has been successfully used in various application areas including natural language processing (NLP), speech recog-nition and computer vision. The main idea of distributed representations is to utilize low-dimensional dense vectors to represent information entities. For example, in NLP, several semantic embedding models have been proposed, including word embedding [16], phrase embedding [54], and sentence embedding [55]. Word embedding models such as word2vec [16], have generalized the classic n-gram language models by using continuous variables to repre-sent words in a vector space and have been successfully applied to capture latent semantics for NLP tasks. Specially, word2vec has given two major model architectures, namely skip-gram (SG) and continuous bag-of-words (CBOW). SG predicts the surrounding words based on the current word, while CBOW predicts the current word using the surround-ing words as contexts. In CBOW, the contextual information is modeled as an embedding vector using an average pool-ing over the embeddpool-ings of surroundpool-ing words. Based on word2vec, doc2vec [55] further incorporates the document-specific embeddings into the word2vec model. Similar to word2vec, it also provides two model architecture: distribut-ed bag-of-words model and distributdistribut-ed memory model. More recently, the concept of distributed representations has been extended beyond pure language modeling to various text related tasks, such as knowledge graph completion [17], [56], text-based attribute representation [57] and multimodal modeling [58]. In addition to model text data, the dis-tributed representation approach has been widely applied to various applications in other fields, such as network analysis [59] and recommendation [60] [61] [62].
7.4 Summary
![Fig. 2. An illustrative example on the stage division using Roger’stheory [8]. The x-axis denotes the adoption time](https://thumb-us.123doks.com/thumbv2/123dok_us/9427720.447444/5.612.327.559.46.170/illustrative-example-stage-division-roger-stheory-denotes-adoption.webp)
![Fig. 4. The percentage of Amazon users posting early reviews in differ-ent bins by product categories.Three bins are considered, i.e., [0, 50],(50, 100] and (100, +∞).](https://thumb-us.123doks.com/thumbv2/123dok_us/9427720.447444/6.612.319.561.39.183/percentage-amazon-posting-reviews-differ-product-categories-considered.webp)