For Peer Review Only
A novel unsupervised Levy flight particle swarm optimization (ULPSO) method for multispectral remote
sensing image classification
Journal: International Journal of Remote Sensing Manuscript ID TRES-PAP-2017-0028.R2
Manuscript Type: IJRS Research Paper
Date Submitted by the Author: 28-Jul-2017
Complete List of Authors: Li, Huapeng; Northeast Institute of Geography and Agroecology Chinese Academy of Sciences
Zhang, Shuqing; Northeast Institute of Geography and Agroecology Chinese Academy of Sciences
Zhang, Ce; Lancaster University, Lancaster Environment Centre Li, Ping; Northeast Institute of Geography and Agroecology Chinese Academy of Sciences; University of the Chinese Academy of Sciences; Jilin Province Academy of Social Sciences, Urban Development Institute Cropp, Roger; Griffith University School of Environment
Keywords: optical remote sensing, clustering, multispectral classification, algorithm
Keywords (user defined): image clustering, particle swarm optimization, Levy flight
For Peer Review Only
A novel unsupervised Levy flight particle swarm
optimization (ULPSO) method for multispectral
remote sensing image classification
Huapeng Lia*, Shuqing Zhanga, Ce Zhangb, Ping Lia,c,d and Roger Croppe
a
Northeast Institute of Geography and Agroecology, Chinese Academy of Sciences, Changchun, 130012, China; bLancaster Environment Centre, Lancaster University, Lancaster
LA1 2YQ, UK; c University of Chinese Academy of Sciences, Beijing, 100049, China; d
Urban Development Institute, Jilin Academy of Social Sciences, Changchun, 130000, China; e
Griffith School of Environment, Griffith University, Gold Coast, 4222, Australia
*Corresponding author. Email: [email protected]
The rapid development of earth observation technology has produced large quantities of remote sensing data. Unsupervised classification (i.e. clustering) of remote sensing image, an important means to acquire land use/cover information, has become increasingly in demand due to its simplicity and ease of application. Traditional methods such as k-means struggle to solve this NP-hard (Non-deterministic Polynomial hard) image classification problem. Particle swarm optimization (PSO), always achieving better result than k-means, has recently been applied to unsupervised image classification. However, PSO was also found to be easily trapped on local optima. This paper proposes a novel unsupervised Levy flight particle swarm optimization (ULPSO) method for image classification with balanced exploitation and exploration capabilities. It benefits from a new searching strategy: the worst particle in the swarm is targeted and its position is updated with Levy flight at each iteration. The effectiveness of the proposed method was tested with three types of remote sensing imagery (Landsat TM (Thematic Mapper), FLC (Flightline C1), and QuickBird) that are distinct in terms of spatial and spectral resolution, and landscape. Our results showed that ULPSO is able to achieve significantly better and more stable classification results than k-means and the other two intelligent methods based on genetic algorithm (GA) and particle swarm optimization (PSO) over all of the experiments. ULPSO is, therefore, recommended as an effective alternative for unsupervised remote sensing image classification.
1....Introduction
Land use/cover data, reflecting the basic natural and social processes, plays an important role in the earth sciences (Loveland et al. 2000; de Colstoun et al. 2006; Huang and Laffan 2009; Deng et al. 2015). It serves as the basis for a variety of predictive models (e.g. ecosystem, hydrologic, and atmospheric models) that simulate the functioning of the Earth system (Bounoua et al. 2002; Jung et al. 2006; Verburg et al. 2011). Furthermore, land use/cover data is essential to understand the complex interactions between human activities and global change (Bonan, 1997; Gong et al. 2013). Currently, it is widely accepted that remote sensing 3
For Peer Review Only
is the mainstream means to produce land cover data because of its distinct advantages over fieldwork including cost-effectiveness, instantaneous measurement, synoptic view, and high multi-temporal coverage (Li et al. 2016b). Yet, remote sensing data does not mean that directly usable information is available. In fact, classifying remote sensing image to practical land cover data is regarded as one of the core tasks of the remote sensing community (Li et al. 2011; Wilkinson 2005).
Generally speaking, there are three basic learning approaches to image classification, namely supervised, semi-supervised and unsupervised. Although supervised methods generally produce relatively accurate results, they involve a significant amount of human effort for training sample collection (Duda and Canty 2002). Semi-supervised methods utilize a relatively small amount of labeled data to aid unsupervised training for image classification (Camps-Valls et al. 2007). In other words, training samples, whose acquisition is labour-intensive and time consuming, are required either in the supervised or in the semi-supervised. However, along with the fast development of earth observation technology, remote sensing data set grows rapidly with massive quantities of data currently archived, thus posing a great challenge for the two types of approaches. In contrast, unsupervised (i.e. clustering) methods are in no need of training samples, thereby dawning increasingly attention in the remote sensing community (Yu et al. 2012; Xu et al. 2013).
Two commonly used unsupervised methods, k-means and fuzzy c-means (FCM), in which simple iterative rules are employed, generally converge rapidly (Li et al. 2016a). However, they often have difficulty reaching the global optimal solution (Bandyopadhyay and Maulik 2002; Yildirim 2014). As a matter of fact, unsupervised image classification can be transformed into an optimization problem, to which artificial intelligent algorithms could take full advantage. In consequence, methods such as genetic algorithm (Maulik and Bandyopadhyay 2000) and artificial immune systems (Zhong et al. 2006) have been employed for image clustering. Recently, particle swarm optimization (PSO), a newly proposed nature-inspired algorithm, has become popular because of its impressive performance when solving a broad range of optimization problems such as function optimization (Seo et al. 2006), flow-shop scheduling (Tseng et al. 2008), and image processing (Chang et al. 2009). The feasibility of PSO in solving the complex remote sensing image classification has also been demonstrated (Omran et al. 2005; Wong et al. 2011; Mukhopadhyay et al. 2015). However, some studies found that PSO was more likely to become trapped on local optima when solving large-scale complex problems (like multi-peak-searches) (Das et al. 2016), such as the image clustering problem (Li et al. 2016b). Currently, the global best solution is employed in the evolution process of PSO (called “elitism strategy”) to accelerate the convergence of PSO. However, this might cause the swarm to converge prematurely (i.e. on local optima) since population diversity decreases with the evolution of particles (Yu et al. 2013), leading to a local optimum without guaranteeing global convergence (Yang 2010).
Some efforts have been made to improve the performance of PSO-based image clustering. For example, Xu and Zhang (2009) developed a fuzzy PSO method for image clustering. Paoli et al. (2009) clustered hyperspectral image by using multiobjective PSO. Yang et al. (2009) presented a hybrid clustering algorithm based on PSO and K-harmonic means. Wang et al. (2012) employed PSO to increase the accuracy of sub-pixel mapping created by a 3
For Peer Review Only
sub-pixel/pixel spatial attraction model (SPSAM). Naeini et al. (2014) integrated PSO with decision analysis to improve the dynamic clustering of image. Most of the current studies, however, just combined other algorithms or classifiers with PSO in hope of gaining a better clustering result, whereas few efforts have been dedicated to the improvement of PSO from a standpoint of searching mechanism. Such a fundamental innovation of PSO would benefit its applications not only in image clustering, but also in the other fields.
In this paper, a novel unsupervised Levy flight particle swarm optimization (ULPSO) method is proposed for remote sensing image classification. The main contribution of this work is the establishment of a new searching mechanism for PSO by using Levy flight, which is a class of random walk employed by some animals when foraging foods (Edwards et al. 2007). In theory, Levy flight with various step lengths exhibiting non-Gaussian distributions could maintain the level of population diversity of standard PSO, thereby improving the likelihood of approaching (or reaching) the optimal solution to the classification problem. To the best of our knowledge, this is the first application of Levy flight to improve the swarm intelligence based image classification. The proposed method has been tested with three kinds of multispectral images (Landsat TM (Thematic Mapper), FLC (Flightline C1), and QuickBird) that are different in terms of spatial and spectral resolution, and landscape. The experiments results have demonstrated the superiority of the proposed method.
2 Particle swarm optimization and Levy flight
2.1 Particle swarm optimization
PSO, a meta-heuristic optimization algorithm (Kennedy and Eberhart 1995), is inspired by the behaviours of bird flocking and fish schooling in the process of food searching. It acquires intelligence through mutual communication and cooperation among the individuals (Paoli et al. 2009). For PSO, a particle of swarm, denoting a candidate solution to the optimization problem, is initially assigned by a random position within the search space; the particle then strives to move towards the promising positions according to its own experience and the experience from neighbour particles, in other words, the particle updates positions by tracking its personal best position (pbest) and the global best position (gbest) memorized in each iteration (Masoomi et al. 2013); by doing so, the whole swarm gradually moves to the promising areas, thus approaching (or achieving) the optimal solution in the end.
Figure 1 is here
Figure 1 illustrates the evolution process of a particle in a 2-D spatial space (Liu et al. 2008). In the figure,
X
i(
t
)
andV
i(
t
)
, respectively, denote the position and velocity ofthe
i
-th particle at timet
;X
ipbest andX
gbest are the best positions found by thei
-thparticle and the whole swarm, respectively. Two velocities
V
ipbest and Vgbestpointing topbest i
X
andX
gbest, respectively, are then combined withV
i(
t
)
to generate the velocity)
1
(
t
+
i
V
of the particle at timet
+
1
. The particle then moves to its new position)
1
(
t
+
i
X
with the newly generated velocity ofV
i(
t
+
1
)
, which is closer to the globaloptimal solution. A detailed calculation of velocity and position of particle can be found in Section 3. By iterating the above process, the particle swarm could progressively approach the 3
For Peer Review Only
global optimum.
2.2 Levy flight
It is widely accepted that randomization exerts an important effect on both exploration and exploitation of meta-heuristic algorithm. The essence of such randomization is the random walk, a process consisting of taking a number of consecutive random steps (Yang 2010). Brownian random walks (Yang 2010), obeying a Gaussian distribution, are the most popular walks in nature. Levy flight, a class of random walk, has the potential to maximize the efficiency of resource searching in uncertain environments (Nayak et al. 2009). Thus, it has been employed by a variety of animals when foraging foods, such as albatrosses and fruit flies, and spider monkeys (Edwards et al. 2007). Similarly, researchers found that Levy flight could also improve the performance of nature-inspired algorithms (Senthilnath et al. 2013; Senthilnath et al. 2016).
In fact, Levy stochastic process with diverging moments can be characterized by probability density (called Levy distribution). Once the distribution is given, the step length (
s
) of Levy flight can then be estimated. In general, the Levy distribution (L
(
s
)
) can be represented with a simple power-law formulaL
(
s
)
~s
−1−β, where 0 < β ≤ 2 is an index controlling the shape of the distribution. Mathematically, a Levy distribution can be simply defined as (Yang and Deb 2013):
∞
<
<
<
−
−
−
=
otherwise
0
0
)
(
1
]
)
(
2
exp[
π
2
)
(
s
,
,
s
s
3 2,
s
L
µ
µ
/µ
γ
γ
µ
γ
, (1)where
µ
is the location parameter, andγ
is a scale parameter controlling the scale of distribution.Levy distribution can also be described in terms of Fourier transformation as shown in Equation (2) (Yang 2010):
( ) = exp[−
α
],0 <β
≤ 2β
k
k
F
, (2)where
α
andβ
determine the distribution of the Fourier transformation. Specifically,α
(∈[−1,1]) is a scale parameter (known as skewness or scale factor) indicating the skew direction;β
is a parameter that controls the shape of the probability distribution within(
0
,
2
]
: the smaller theβ
is, the longer the possible jump is because of the longer tail.Since the analytic form of the integral is unobtainable for general
β
, a few special cases, instead, were usually employed in real applications. In particular, forβ
=
1
andβ
=
2
, the Fourier transform corresponds to a Cauchy distribution (F
(k
)= exp[−α
k
]) and a Gaussian distribution (F
(k
) = exp[−α
k
2]), respectively.3 Unsupervised Levy flight particle swarm optimization method
The ULPSO method was developed from PSO and Levy flight for the purpose of unsupervised remote sensing image classification. Suppose a remote sensing image consists of
N
pixels withD
attributes andK
classes for classification. In principle, ULPSOclassifies the image by searching for a fixed number (
K
) of optimal cluster centres 3For Peer Review Only
(
C
1,C
2,…,C
K) withinℜ
D, so that the clustering metric (M
), i.e. the sum of the Euclidean distances from the pixels to their respective cluster centres (Maulik and Bandyopadhya 2000), can be minimized. The clustering metric can be mathematically denoted as follows:
∑ ∑
= ∈−
=
Ki x
i j
i j
z
x
M
1 C
,
(3)
where
x
j is an arbitrary pixel of the image belonging to classi
(i
=
1, 2, …,K
), withi
z
as its cluster centre, andj
is the pixel number of classi
.Figure 2 shows the flowchart of ULPSO, in which the main procedures, including particle position initialization, fitness evaluation, particle position searching, pbest and gbest updating, and position searching by Levy flight, are detailed in the next few sections.
Figure 2 is here
3.1 Particle representation and initialization
In PSO, a particle, denoting a candidate solution to the problem of clustering centre optimization, is formed by connecting the cluster centre of each class represented with a sequence of real numbers. The length of the particle is
D
×
K
(K
, the number of classes), where the firstD
positions represent the cluster centre of class one, the secondD
positions represent that of class two, and so on. Suppose the number of released particles (Npop) isn
, at the beginning of iteration, each particle of the swarm is randomly assigned a position, which can be generated as follows:min
(
max min)
j j jj
i
X
r
X
X
X
=
+
−
, (4)where
X
ij is the position at thej
-th attribute for thei
-th particle,X
minj and jX
maxare the minimum and maximum values of the
j
-th attribute, respectively, andr
is drawn from a uniform distribution [0, 1].3.2 Fitness evaluation
The clustering metric (
M
) is inversely proportional to the quality of clustering, i.e. the lower the value of cluster metric, the better the quality of the clustering, since pixels in the same cluster should be as close (i.e. have high similarity) as possible (Li et al. 2016a). Thus, the fitness function is defined on the basis of clustering metric as follows:
f
=
1
/(
M
+
1
)
, (5)where
M
is calculated using Equation (3).The fitness of a single particle at each iteration is calculated using Equation (5). For the
i
-th particle, its fitness (f
ipbest) as well as the position (pbest i
X
) are then memorized. Inaddition, the global best fitness of the whole swarm (
f
gbest) and its corresponding position (X
gbest) are also identified and recorded, respectively.3.3 Optimal position searching of particle
After having assessed the fitness, the velocity of each particle is updated using the following 3
For Peer Review Only
equation:
(
1
)
(
(
))
(
(
))
gbest 2 2 pbest
1
1
r
t
c
r
t
c
w
t
i i i ii
V
X
X
X
X
V
+
=
+
−
+
−
, (6)where
V
i(
t
+
1
)
andV
i(
t
)
are the velocities of thei
-th particle at timet
+
1
andt
,respectively;
X
ipbest andX
i(
t
)
are the historical best position and the position at timet
for the
i
-th particle, respectively;X
gbest is the historical best position of the whole swarm;1
r
andr
2 are two uniformly distributed random numbers in the range [0, 1];c
1 andc
2 are acceleration coefficients;w
is the inertia weight determining the effect of velocity attime
t
on the current (at timet
+
1
) velocity.Accordingly, the position of each particle is involved with the newly generated velocity (Figure 1):
X
i(
t
+
1)
=
X
i(
t
)
+
V
i(
t
+
1)
, (7)where
X
i(
t
+
1
)
and Xi(t) are the positions of the
i
-th particle at timet
+
1
andt
,respectively.
3.4 Updating pbestand gbest
When all particles of the swarm having finished their movements, the corresponding fitness values are recalculated using Equation (5). The personal best position for the
i
-th particle is then updated in the following way:
+
<
+
=
otherwise
)
1
(
)
1
(
pbest pbest pbest i i i i it
f
f
,
t
X
X
X
, (8)where
f
i(
t
+
1
)
denotes the fitness of thei
-th particle at timet
+
1
. The global best position can be assigned as follows:
+
<
+
=
otherwise
)
1
(
)
1
(
gbest gbest gbest gbest gbestX
X
X
t
,
f
f
t
,(9)
where
f
gbest(t
+ 1) denotes the best fitness of the whole swarm at timet
+
1
, with) 1 ( gbest
t
+X as the corresponding position.
3.5 Global searching by Levy flight
As mentioned before, Levy flight is more efficient than Brownian random walks when exploring in a large-scale search space. There are several ways of simulating Levy distribution. One of the most efficient ways is to employ the Mantegna algorithm (Mantegna 1994), in which the step length
s
of Levy flight can be calculated as follows:
λ
ν
µ
β 101
0
.
s
=
, (10)For Peer Review Only
walks/flights (Yang 2010), where
L
is the typical length scale;β
is a constant varyingbetween 1 and 2;
µ
,ν
andλ
are, respectively, drawn from normal distributions:µ
~ (0, )2 µ
σ
N
,ν
~N
(
0
,
σ
ν2)
,λ
~N
(0,1), (11) where , , β β Γ β β Γ v β 1 2 ) 2 ) (1 ( ) 2 )sin(π (1 1 2 1) ( = + += − σ
σ
β
µ
(12)
where
Γ
is the gamma function.Global searching can be initiated by exploring new search areas. To enhance the swarm’s exploration capacity, the worst particle (i.e. the particle with the lowest fitness) at the current iteration is targeted and its position is then updated with Levy flight (step
s
):s
i i
=
X
+
X
new ,(13)
where
X
inewdenotes the newly position for thei
-th particle (the worst particle), whoseoriginal position is Xi.
The fitness of the updated particle is subsequently recalculated.
3.6 Stopping condition
Herein, the search iteration stops only when the number of maximum iterations (Miter) is reached. In this case, the optimal position, i.e. a group of cluster centres as the solution to the unsupervised classification problem, is acquired. The image is then classified on the basis of the solution.
3.7 Pseudocode of ULPSO
The proposed ULPSO can be represented by using the following pseudocode: Initialize the control parameters (Npop, Miter, w, c1, and c2)
Randomly initialize the positions of particles using Equation (4) Evaluate the fitness of particles using Equation (5)
Memorize the gbest and pbest of particles while iter < Miter do
for i=1: Npop
Update the velocity of each particle using Equation (6) Update the position of each particle using Equation (7) end for
Evaluate the fitness of new particles using Equation (5) for i=1: Npop
Update pbest using Equation (8) end for
Update gbest using Equation (9)
Identify the particle with the lowest fitness
For Peer Review Only
Update the fitness of the updated particle using Equation (5) iter=iter+1
end while
Output the optimal solution
4 Experiments and analysis
The effectiveness of the proposed method was tested with three kinds of remote sensing images, namely Landsat TM, FLC, and QuickBird. At the same time, traditional k-means as well as two intelligent unsupervised classification methods based on standard genetic algorithm (denoted as UGA) and particle swarm optimization (denoted as UPSO), respectively, were also implemented for accuracy comparison (Srinivasan and Seow 2003). Note, an experiment denotes the classification of a particular imagery with the four methods (k-means, UGA, UPSO, and ULPSO), e.g. QuickBird experiment.
The number of image clustering can be either predefined or estimated during iteration (i.e. automatic clustering). In an automatic clustering method, varied numbers of clusters, instead of a fixed one, are usually produced during iterations (Maulik and Saha 2010). The numbers of variables to be optimized may thus vary for different classification methods, leading to an incomparable classification environment. Therefore, this study uniformly assigned the number of clusters for all of the methods in each experiment.
To evaluate the performance of methods quantitatively, a number of commonly used measures of classification accuracy were calculated for each classification, namely overall accuracy (OA), producer’s accuracy (PA), user’s accuracy (UA), and kappa coefficient (κ). For detailed information on how to calculate these measures, readers are referred to the paper of Foody et al. (2002).
4.1 Data sets
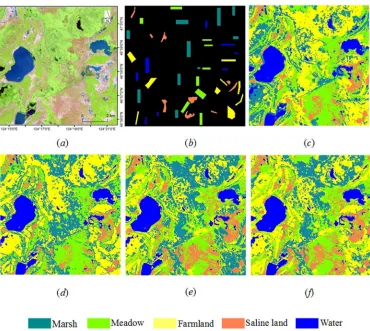
Landsat TM: The imagery (Row/Path: 120/27) was collected by Landsat Thematic Mapper on 27 August 2007. A subset of the image (sized by 310×310 pixels) over Zhalong National Nature Reserve (ZNNR) of China was chosen as our test image (Figure 3). It has six spectral bands (bands 1-5 and band 7) with spectral wavelengths ranging from 0.45 to 2.35 µm. The spatial of the image is 30 m. The image has a typical heterogeneous landscape, integrated by natural wetland and anthropic farmland. In reference to the field work, five classes including marsh, meadow, farmland, saline land, and water were identified for the image. A total of 7607 samples (see Figure 3(b)) were gathered for evaluating the image classification results.
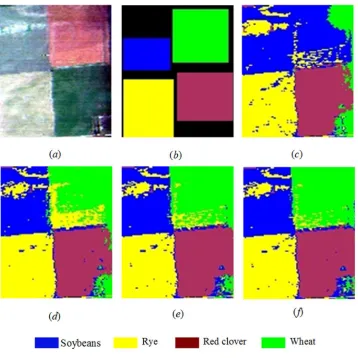
FLC: The image was acquired by the M7 scanner over Tippecanoe County, Indiana, US, in June 1966 (Tadjudin and Landgrebe, 2000). A subset of the original image with a size of 100×118 pixels and 12 multispectral bands was employed in this experiment. The spectral wavelengths of bands range from 0.40 to 1.00 µm. It is of a typical farmland landscape consisting of four classes: soybeans, rye, red clover, and wheat. A total of 7936 samples were available along with the image for accuracy assessment (Figure 4(b)).
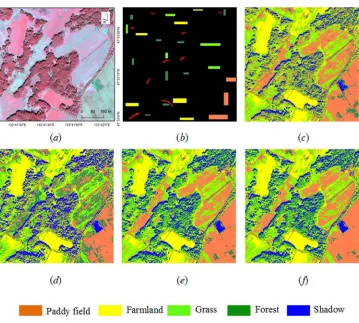
QuickBird: The image was gathered over the Yalvhe farm, Heilongjiang province, China, on 4 September 2005. The image provides 2.4 m spatial resolution in four multispectral bands with the spectral wavelength ranging from 0.45-0.90µm (Wang et al. 2004). A subset of the image with a size of 350×350 pixels, covering mostly farmland and woodland, was chosen 3
For Peer Review Only
for this experiment. According to the field investigation, the image is mainly covered by five classes, namely paddy field, farmland, grass, forest, and shadow. A total of 5781 samples were collected to evaluate the classification results of the image (Figure 5(b)).
4.2 Parameters initialization
To make a fair comparison, the same values, i.e. the maximum iteration number of 1000 and population size of 40, were assigned for the common parameters of the three intelligent
methods (UGA, UPSO, and ULPSO). In addition, in order to achieve comparable results with previous studies, other specific parameters that were widely adopted for each of the methods were utilized as follows: for UGA, generation gap
p
s = 0.9, crossover ratep
c = 0.8,mutation rate
p
m = 0.01 (Karaboga and Akay 2009); for UPSO and ULPSO, accelerationcoefficients
c
1=
c
2 = 1.8, inertia weightw
= 0.6 (Vesterstrom and Thomsen 2004). As a benchmark, traditional k-means was also implemented with control parameters: the maximum iteration number = 1000, the pixel change threshold = 0%; the number of clusters assigned tothe three images was five, four, and five, respectively. It is noted that candidate solutions of the UGA, UPSO, and k-means were initialized in the same way as ULPSO (i.e. by using Equation (4)).
4.3 Classification Results
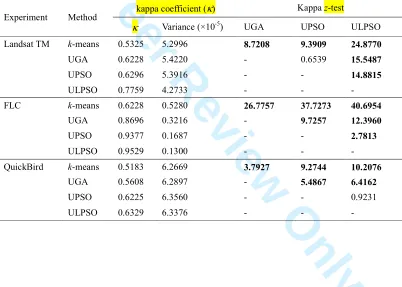
Figures 3, 4 and 5 respectively show the land-cover classification results of the three experiments, i.e. the classifications of the three images achieved by the four methods (k-means, UGA, UPSO, and ULPSO). The corresponding classification accuracies including PA, UA, and OA of the four methods are summarized in Tables 1-3, respectively. Table 4 provides the Kappa z-test results for the classifications. In general, ULPSO outperformed the other methods (k-means, UGA, and UPSO) over all three experiments. The overall accuracy achieved by ULPSO was higher than k-means, UGA, and UPSO by 19.01%, 11.80%, and 11.31%, respectively, for the TM experiment, and by 25.62%, 6.13%, and 1.12%,
respectively, for the FLC experiment. For the QuickBird experiment, the improvements were 8.67%, 5.83%, and 0.83%, respectively (Table 3).
Figures 3-5 are here
For the TM experiment, a large part of marsh areas were misidentified as farmland in the k-means classification (Figure 3 (c)), resulting in low accuracies (both PA and UA) of both marsh and farmland (Table 1). The results of the three intelligent methods (UGA, UPSO, and ULPSO) were more accurate than k-means because of their better differentiations between marsh and farmland (Figure 3). However, both UGA and UPSO tended to overestimate the marsh class, thus leading to a low UA (lower than 62%) for the class. Fortunately, the proposed ULPSO could better identify the marsh class (UA > 82%), thereby providing the best classification accuracy. The Kappa z-test further indicated that ULPSO performed significantly better than k-means, UGA, and UPSO (Table 4).
Tables 1-4 are here 3
For Peer Review Only
For the FLC experiment, the performance of k-means was also very poor, in which a majority of wheat was misclassified as soybeans (Figure 4 (c)). UGA notably improved the identification of wheat, but mislabeled some rye pixels as wheat (Figure 4 (d)), leading to a low PA for wheat (< 76%) and UA for rye (< 80%) (Table 2). In comparison, satisfactory results (OA > 95%) were yielded by UPSO and ULPSO, in which the four classes were relatively well separated (Figure 4 (e, f)). Yet even so, ULPSO still outperformed UPSO in the experiment due to its better discrimination between wheat and rye (Figure 4 (f)). Thus, similar to the TM experiment, ULPSO achieved statistically significantly better result than k-means, UGA, and UPSO (Table 4).
As for the QuickBird experiment, k-means and UGA produced lower but comparable classification results (with OA around 65%). In the k-means classification, only a small part of forest was correctly identified (Figure 5 (c)), resulting in an extraordinarily low PA for forest (< 20%). UGA improved the accuracy of forest, but a large part of grass was misidentified as forest (Figure 5(d)). In contrast, similar but better results were achieved by UPSO and ULPSO, with overall accuracies larger than 70%. The z-test results showed that ULPSO performed significantly better than k-means and UGA. The difference between UPSO and ULPSO was not significant, despite the slight outperformance of ULPSO over UPSO (Table 4).
4.4 Robustness and searching capacity of methods
To evaluate the robustness of the proposed method, ULPSO as well as k-means, UGA, and UPSO were implemented 30 times with randomly generated initial population for each experiment. The average OA and κ were summarized in Table 5. It can be observed from the table that the highest accuracy was obtained by ULPSO over all of the three experiments, followed by UPSO and UGA, while k-means demonstrated the worst. Besides, ULPSO worked much more stable (i.e. robust) than the other methods in view of its lower variance of accuracy (Table 5). To further compare the means of the classification accuracies produced by the four methods, the student’ t-test (Dietterich 1988) was performed on κ (Table 5). As shown in the table, the presented ULPSO beat the other methods in a statistically significant manner in the first two experiments. But there was no significant difference among the three intelligent methods in the QuickBird experiment, despite ULPSO yielded the highest average accuracy (Table 5).
Table 5 is here
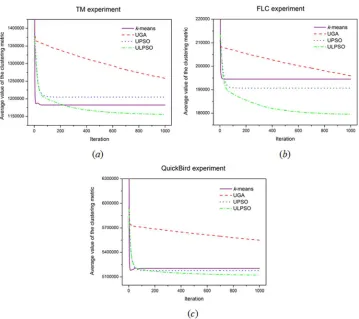
The average clustering metric values (number of repetition: 30 times) running versus numbers of iterations were calculated to investigate the searching capacity of the methods. Figure 6 illustrated the corresponding results over the three experiments. It was shown that each method presented similar patterns over the three experiments. In specific, UGA had the slowest rate of convergence, thus incapable of acquiring a lower cluster metric value, even if reaching the maximum number of iteration. In comparison, the fastest convergence rate was achieved by k-means, which became stable in the early stages (about 60 iterations) of the optimization; a similar convergence pattern was revealed by UPSO, maturing at about 100 3
For Peer Review Only
iterations (Figure 6). However, both k-means and UPSO converged to high-level values of clustering metric, indicating they were vulnerable to being fallen into local optimum prematurely. As for ULPSO, it not only maintained the same advantage of rapid convergence at the early optimization stage as UPSO, but also continuously and strongly optimized (decreased) the value of objective function, which stabilized at about 800 iterations (Figure 6). As a result, obviously lower clustering metric value was achieved by ULPSO, where Levy flight played a crucial role in helping PSO jump out of local optima and eventually approached (or reached) the optimal solution.
Figure 6 is here
4.5 Computational complexity analysis
In this paper, the same number of outer iterations (Niter) was utilized in each method for the
sake of a fair comparison. Therefore, the computational complexity of the four methods
differs mainly from their numbers of inner loops. Suppose
n
,K
are the number of population and the number of clusters, respectively. Among the four methods, k-means, withK
inner loops and Niter outer iterations, has the least complexity: O(NiterK
); for UGA, it canbe expressed as O(Niter(
nK
+np
s+1/2np
c+np
m)), where O(nK
) is the complexity of theobjective function, while O(
np
s), O(1/2np
c), and O(np
m) denote that of the three operatorsrespectively: selection, cross, and mutation; UPSO and ULPSO have a relatively high complexity: O(Niter(
nK
+2n
)) and O(Niter(nK
+2n
+K
)), respectively. Compared withUPSO, a little bit more complexity hold by ULPSO was noticed.
The computing time of classifications in the three experiments is listed in Table 6. Note that all the three methods were implemented in a MATLAB environment, and run on a personal computer with 3.20-GHz CPU and 8.0-GB memory. As expected, the intelligent methods (UGA, UPSO, and ULPSO) required much more computation time than the simple k-means. This is because k-means uses only one candidate solution during each iteration of clustering, while 40 candidate solutions are simultaneously evolved for the three intelligent methods. The computational time was almost the same for UGA and UPSO, while a little bit more time was needed by ULPSO because of the computation of step length of Levy flight. But it is acceptable in view of the significant better results.
Table 6 is here
5 Discussion
In this paper, the problem of image clustering is transformed into an optimization problem. The number of variables contained in each candidate solution is fixed, i.e. the product
(
D
×
K
) of dimensions of attributes (D
) and the number of clusters (K
). The aim of clustering is to find out proper variables in the solution space to achieve an optimal solution, so that the clustering metric (objective function) can be minimized. However, it is not a trivialtask since image clustering usually has a huge solution space. This paper is thus to establish 3
For Peer Review Only
an effective and reliable searching mechanism in the space.
The proposed ULPSO proves superior to traditional k-means, UGA, and UPSO over all of the three experiments. In UGA, candidate solutions were randomly crossed and mutated (Yen et al. 1998), without further seeking candidates around the current optimum. Achieving the slowest convergence rate (Figure 6), UGA is therefore in short of the necessary exploitation capacity for handling complex remote sensing image. As for UPSO, the evolution is carried out by considering the global (i.e. the whole swarm) optimal solution and personal (i.e. an individual particle) optima (Equation (6)). UPSO hence owns a high exploitation capacity (Kusetogullari et al. 2015), which well explains the reason of its rapid convergence (Figure 6). Yet, such an evolving strategy would make all individual particles resemble each other (Arani et al. 2013), thus having difficulty maintaining the diversity of population. As a consequence, the swarm tends to be premature (i.e. trapping on local optima) in the early evolution stage (Figure 6) due to the lack of exploration capacity (Kaveh and Zolghadr 2014).
Satisfactorily, by adopting Levy flight, the proposed ULPSO method possesses not only the inherent exploitation capacity (like UPSO) but also a powerful exploration capacity, as illustrated by Figure 6. The searching step produced by Levy flight can differ in length, thus enabling to offer long steps with a certain probability (Yang 2010). The worst particle (with the lowest fitness), whose new position was assigned by Levy flight in each iteration, can then be served as a scout particle to pioneer new spaces. Such a searching strategy guarantees the local exploitation capability of the population; at the same time, the particles are able to travel throughout the whole solution space, thus providing a global searching ability. The integration of Levy flight and the PSO would provide a complementary behaviour in terms of both exploration and exploitation. Thanks to this novel searching strategy (the major contribution of this research), significant better results were achieved by ULPSO in comparison with UPSO.
Some previous researches enhanced the PSO-based image clustering by integrating other algorithms (e.g. decision-making; Naeini et al. 2014) or classifiers (e.g. Support Vector Machine; Venkatalakshmi and Shalinie 2005). There are also some studies employing PSO to optimize other clustering algorithms (e.g. fuzzy c-means; Samadzadegan and Naeini 2011; Niazmardi et al. 2012). The basic searching strategy of PSO, however, has received little attention in the literature. Toward this end, Levy flight was introduced to enhance the exploration capacity of PSO, i.e. to fundamentally improve the algorithm from the underlying searching mechanism. That’s why different types of remote sensing images adopted in this study (including TM, FLC and QuickBird) were effectively handled by ULPSO. In fact, the proposed method is universally applicable, not only to different kinds of remotely sensed images but also to a variety of application programs of geosciences and remote sensing, such as image band selection (Su et al. 2014), land use allocation (Liu et al. 2013), and urban growth modeling (Feng et al. 2011).
We note that a few early efforts had been made to improve PSO by Levy flight for function optimization, and presented the corresponding methods: Levy flight particle swarm optimization (LFPSO, Hakli and Uguz 2014) and particle swarm optimization with Levy flight (PSOLF, Jensi and Jiji 2016). However, the searching strategies employed in these methods were in short of balanced exploitation and exploration capabilities, thus having difficulty addressing the complex problem of image clustering. For LFPSO, a particle’s 3
For Peer Review Only
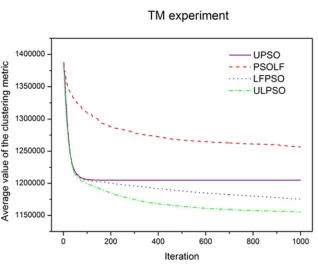
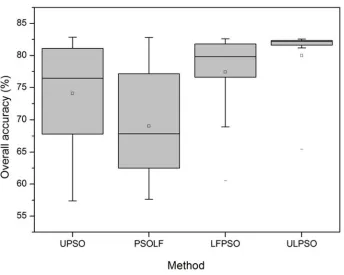
position is updated by Levy flight, only if it cannot be improved after reaching a predefined searching time limitation. Such a searching mechanism may reduce the exploration capacity of LFPSO, since those continuously evolved particles with low fitness could still survive after a large number of iteration. This leads to a waste of valuable searching sources. Besides, it is hard to determine a proper value of searching time limitation. As for PSOLF, positions of as many as one-half particles are regenerated by Levy flight at each iteration, leading to an intense fluctuation of the population. This may substantially weaken the exploitation capacity of the method. By taking the TM experiment as an example, the searching capacity of the four PSO-based methods (i.e. UPSO, LFPSO, PSOLF, and ULPSO) was compared, with each method performed 30 times. As illustrated by Figure 7 in which variations of the average clustering metric values for each method were provided, the proposed ULPSO achieved the best result, followed by LFPSO and UPSO, while PSOLF performed the worst. Furthermore, better and more stable classification results could be achieved by the proposed method than the others as shown by Figure 8.
Figures 7 and 8 are here
6 Conclusions
Unsupervised remote sensing image classification, often having an extremely large solution space, belongs to the family of NP-hard (Non-deterministic Polynomial hard) problems. Traditional k-means and common intelligent methods (such as genetic algorithm) tend to become trapped on local optima due to their limited exploitation and/or exploration capacities. In this paper, we developed a novel ULPSO methodology in which a new searching strategy with Levy flight was adopted for unsupervised image classification. Similar to UPSO with powerful exploitation ability, ULPSO converged very rapidly at the early optimization stage. More importantly, it could jump out of local optima and continuously approach (or reach) the optimal solution, thanks to the relatively powerful exploration capacity benefiting from Levy flight. Therefore, ULPSO is in possession of both
exploration and exploitation capacities, which results in its superiority to the other three benchmark methods (k-means, UGA, UPSO), as well as to existing approaches (LFPSO and PSOLF) integrated by PSO and Levy flight. The proposed method is, thus, suggested to be an alternative for unsupervised remote sensing image classification.
Despite having achieved promising results in general, ULPSO was still hard to cope with the very high resolution (VHR) image, as illustrated by Figure 5 in which serious 'salt-and-pepper' phenomenon occurred. Incorporating spatial information of remote sensing image into ULPSO thus deserves further investigation. In addition, we would like to explore the possibility of developing an automatic clustering method based on the presented method. In that case, both intra criterion (clustering metric in our experiments) and inter criterion should be simultaneously considered in the process of optimization.
Acknowledgements
We would like to thank the editor and the four anonymous reviewers for their constructive 3
For Peer Review Only
comments which helped improve the paper substantially.
Disclosure statement
No potential conflict of interest was reported by the authors.
Funding
This research was supported by the National Natural Science Foundation of China (grant number: 41301465), the Scientific and Technological Development Program of Jilin Province (grant number: 20170520087JH), and the National Key Research and Development Program of China (2017YFB0503602).
References
Arani, B. O., P. Mirzabeygi and M. S. Panahi. 2013. "An improved PSO algorithm with a territorial
diversity-preserving scheme and enhanced exploration-exploitation balance." Swarm and Evolutionary Computation 11: 1-15. doi:10.1016/j.swevo.2012.12.004.
Bandyopadhyay, S. and U. Maulik. 2002. "Genetic clustering for automatic evolution of clusters and
application to image classification." Pattern Recognition 35: 1197-1208. doi:Pii S0031-3203(01)00108-X.
Bonan, G. B. 1997. "Effects of land use on the climate of the United States." Climatic Change 37: 449-486. doi: 10.1023/A:1005305708775.
Bounoua, L., R. Defries, G. J. Collatz, P. Sellers and H. Khan. 2002. "Effects of land cover conversion
on surface climate." Climatic Change 52: 29-64.doi: 10.1023/A:1013051420309.
Camps-Valls, G., T. V. Bandos and D. Y. Zhou. 2007. "Semi-supervised graph-based hyperspectral
image classification." Ieee Transactions on Geoscience and Remote Sensing 45: 3044-3054. doi:10.1109/Tgrs.2007.895416.
Chang, Y. L., J. P. Fang, L. N. Chang, J. A. Benediktsson, H. A. Ren and K. S. Chen. 2009. "Band
Selection for Hyperspectral Images Based on Parallel Particle Swarm Optimization Schemes." 2009 Ieee International Geoscience and Remote Sensing Symposium, Vols 1-5: 3509-3512.
Das, P. K., H. S. Behera and B. K. Panigrahi. 2016. "A hybridization of an improved particle swarm
optimization and gravitational search algorithm for multi-robot path planning." Swarm and Evolutionary Computation 28: 14-28. doi:10.1016/j.swevo.2015.10.011.
De Colstoun, E. C. B. and C. L. Walthall. 2006. "Improving global scale land cover classifications with
multi-directional POLDER data and a decision tree classifier." Remote Sensing of Environment 100: 474-485. doi:10.1016/j.rse.2005.11.003.
Deng, X. Z., Q. L. Shi, Q. Zhang, C. C. Shi and F. Yin. 2015. "Impacts of land use and land cover
changes on surface energy and water balance in the Heihe River Basin of China, 2000-2010."
Physics and Chemistry of the Earth 79-82: 2-10. doi:10.1016/j.pce.2015.01.002.
Dietterich, T. G. 1998. "Approximate statistical tests for comparing supervised classification learning
algorithms." Neural Computation 10: 1895-1923. doi:10.1162/089976698300017197.
Duda, T. and M. Canty. 2002. "Unsupervised classification of satellite imagery: choosing a good
algorithm." International Journal of Remote Sensing 23: 2193-2212. doi: 10.1080/01430060110078467.
Edwards, A. M., R. A. Phillips, N. W. Watkins, M.P. Freeman, E.J. Murphy, V. Afanasyev, et al. 2007.
"Revisiting Levy flight search patterns of wandering albatrosses, bumblebees and deer." Nature 449: 3
For Peer Review Only
1044-1045. doi:10.1038/nature06199.
Feng, Y. J., Y. Liu, X. H. Tong, M. L. Liu and S. S. Deng. 2011. "Modeling dynamic urban growth
using cellular automata and particle swarm optimization rules." Landscape and Urban Planning 102: 188-196. doi:10.1016/j.landurbplan.2011.04.004.
Foody, G. M. 2002. "Status of land cover classification accuracy assessment." Remote Sensing of Environment 80: 185-201. doi:Pii S0034-4257(01)00295-4.
Gong, P., J. Wang, L. Yu, Y.C. Zhao, Y.Y. Zhao, L. Liang, Z.G. Niu, X. Huang, et al. 2013. "Finer
resolution observation and monitoring of global land cover: first mapping results with Landsat TM and ETM+ data." International Journal of Remote Sensing 34: 2607-2654. doi:10.1080/ 01431161.2012.748992.
Hakli, H. and H. Uguz. 2014. "A novel particle swarm optimization algorithm with Levy flight."
Applied Soft Computing 23: 333-345. doi:10.1016/j.asoc.2014.06.034.
Huang, X. and L. P. Zhang. 2010. "Comparison of Vector Stacking, Multi-SVMs Fuzzy Output, and
Multi-SVMs Voting Methods for Multiscale VHR Urban Mapping." Ieee Geoscience and Remote Sensing Letters 7: 261-265. doi:10.1109/Lgrs.2009.2032563.
Jensi, R. and G. W. Jiji. 2016. "An enhanced particle swarm optimization with levy flight for global
optimization." Applied Soft Computing 43: 248-261.doi:10.1016/j.asoc.2016.02.018.
Jung, M., K. Henkel, M. Herold and G. Churkina. 2006. "Exploiting synergies of global land cover
products for carbon cycle modeling." Remote Sensing of Environment 101: 534-553. doi:10.1016/j.rse.2006.01.020.
Karaboga, D. and B. Akay. 2009. "A comparative study of Artificial Bee Colony algorithm." Applied Mathematics And Computation 214: 108-132.doi:10.1016/j.amc.2009.03.090.
Kaveh, A. and A. Zolghadr. 2014. "Democratic PSO for truss layout and size optimization with
frequency constraints." Computers & Structures 130: 10-21.doi:10.1016/j.compstruc.2013.09.002. Kennedy, J. and R. Eberhart. 1995. "Particle swarm optimization." 1995 Ieee International Conference
on Neural Networks Proceedings, Vols 1-6: 1942-1948. doi: 10.1109/Icnn.1995.488968.
Kusetogullari, H., A. Yavariabdi and T. Celik. 2015. "Unsupervised Change Detection in
Multitemporal Multispectral Satellite Images Using Parallel Particle Swarm Optimization." Ieee Journal of Selected Topics in Applied Earth Observations and Remote Sensing 8: 2151-2164. doi:10.1109/Jstars.2015.2427274.
Li, H. P., S. Q. Zhang, X. H. Ding, C. Zhang and P. Dale. 2016a. "Performance Evaluation of Cluster
Validity Indices (CVIs) on Multi/Hyperspectral Remote Sensing Datasets." Remote Sensing 8: 295. doi:10.3390/rs8040295.
Li, H. P., S. Q. Zhang, X. H. Ding, C. Zhang and R. Cropp. 2016b. "A novel unsupervised bee colony
optimization (UBCO) method for remote-sensing image classification: a case study in a
heterogeneous marsh area." International Journal of Remote Sensing 37: 5726-5748. doi:10.1080/01431161.2016.1246771.
Li, H. P., S. Q. Zhang, Y. Sun and J. Gao. 2011. "Land cover classification with multi-source data
using evidential reasoning approach." Chinese Geographical Science 21: 312-321. doi: 10.1007/s11769-011-0465-1.
Liu, X. P., J. P. Ou, X. Li and B. Ai. 2013. "Combining system dynamics and hybrid particle swarm
optimization for land use allocation." Ecological Modelling 257: 11-24. doi:10.1016/j.ecolmodel.2013.02.027.
Liu, X. P., X. Li, X. J. Peng, H. B. Li and J. Q. He. 2008. "Swarm intelligence for classification of 3
For Peer Review Only
remote sensing data." Science in China Series D-Earth Sciences 51: 79-87. doi:10.1007/s11430-007-0133-6.
Loveland, T. R., B. C. Reed, J. F. Brown, D. O. Ohlen, Z. Zhu, L. Yang and J. W. Merchant. 2000. "Development of a global land cover characteristics database and IGBP DISCover from 1 km
AVHRR data." International Journal of Remote Sensing 21: 1303-1330. doi: 10.1080/014311600210191.
Mantegna, R. N. 1994. "Fast, Accurate Algorithm for Numerical-Simulation of Levy Stable
Stochastic-Processes." Physical Review E 49: 4677-4683. doi: 10.1103/PhysRevE.49.4677.
Masoomi, Z., M. S. Mesgari and M. Hamrah. 2013. "Allocation of urban land uses by Multi-Objective
Particle Swarm Optimization algorithm." International Journal of Geographical Information Science
27: 542-566. doi:10.1080/13658816.2012.698016.
Maulik, U. and S. Bandyopadhyay. 2000. "Genetic algorithm-based clustering technique." Pattern Recognition 33: 1455-1465. doi: 10.1016/S0031-3203(99)00137-5.
Mukhopadhyay, S., P. Mandal, T. Pal and J. K. Mandal. 2015. "Image Clustering Based on Different
Length Particle Swarm Optimization (DPSO)." Proceedings of the 3rd International Conference on Frontiers of Intelligent Computing: Theory and Applications (Ficta) 2014, Vol 1 327: 711-718. doi:10.1007/978-3-319-11933-5_80.
Naeini, A. A., S. Homayouni and M. Saadatseresht. 2014. "Improving the Dynamic Clustering of
Hyperspectral Data Based on the Integration of Swarm Optimization and Decision Analysis." Ieee Journal of Selected Topics in Applied Earth Observations and Remote Sensing 7: 2161-2173. doi:10.1109/Jstars.2014.2307579.
Nayak, S. K., K. R. Krishnanand, B. K. Panigrahi and P. K. Rout. 2009. "Application of Artificial Bee
Colony to Economic Load Dispatch Problem with Ramp Rate Limits and Prohibited Operating
Zones." 2009 World Congress on Nature & Biologically Inspired Computing (Nabic 2009): 1236-1241.
Niazmardi, S., A. A. Naeini, S. Homayouni, A. Safari and F. Samadzadegan. 2012. "Particle swarm
optimization of kernel-based fuzzy c-means for hyperspectral data clustering." Journal of Applied Remote Sensing 6. doi:Artn06360110.1117/1.Jrs.6.063601.
Omran, M., A. P. Engelbrecht and A. Salman. 2005. "Particle swarm optimization method for image
clustering." International Journal of Pattern Recognition and Artificial Intelligence 19: 297-321. doi: 10.1142/S0218001405004083.
Paoli, A., F. Melgani and E. Pasolli. 2009. "Clustering of Hyperspectral Images Based on
Multiobjective Particle Swarm Optimization." Ieee Transactions on Geoscience and Remote Sensing
47: 4175-4188. doi:10.1109/TGRS.2009.2023666.
Samadzadegan, F. and A. A. Naeini. 2011. "Fuzzy clustering of hyperspectral data based on particle
swarm optimization." 2011 3rd Workshop on Hyperspectral Image and Signal Processing: Evolution in Remote Sensing (WHISPERS), 1-4.
Senthilnath J., S. Kulkarni, D.R. Raghuram, M. Sudhindra, S.N. Omkar, V. Das and V. Mani. 2016, “A
Novel Harmony Search Based Approach for Clustering Problems”. International Journal of Swarm Intelligence, 2: 66 – 86. doi: 10.1504/IJSI.2016.077434.
Senthilnath, J., V. Das, S. N. Omkar and V. Mani. 2013. "Clustering using Levy Flight Cuckoo
Search." Proceedings of Seventh International Conference on Bio-Inspired Computing: Theories and Applications (Bic-Ta 2012), 202: 65-75. doi:10.1007/978-81-322-1041-2_6.
Seo, J. H., C. H. Im, C. G. Heo, J. K. Kim, H. K. Jung and C. G. Lee. 2006. "Multimodal function 3
For Peer Review Only
optimization based on particle swarm optimization." Ieee Transactions on Magnetics 42: 1095-1098. doi:10.1109/TMAG.2006.871568.
Srinivasan, D. and T.H. Seow. 2003. "Particle Swarm Inspired Evolutionary Algorithm (PS-EA) for Multiobjective Optimization Problem." Proceedings of the 2003 Congress on Evolutionary Computation, Canberra, Australia, 2292–2297.
Su, H. J., Q. Du, G. S. Chen and P. J. Du. 2014. "Optimized Hyperspectral Band Selection Using
Particle Swarm Optimization." Ieee Journal of Selected Topics in Applied Earth Observations and Remote Sensing 7: 2659-2670. doi:10.1109/JSTARS.2014.2312539.
Tadjudin, S. and D. A. Landgrebe. 2000. "Robust parameter estimation for mixture model." Ieee Transactions on Geoscience and Remote Sensing 38: 439-445. doi:10.1109/36.823939.
Tseng, C. T. and C. J. Liao. 2008. "A discrete particle swarm optimization for lot-streaming flowshop
scheduling problem." European Journal Of Operational Research 191: 360-373. doi:10.1016/j.ejor.2007.08.030.
Verburg, P. H., K. Neumann and L. Nol. 2011. "Challenges in using land use and land cover data for
global change studies." Global Change Biology 17: 974-989. doi:10.1111/j.1365-2486.2010.02307.x.
Vesterstrom, J. and R. Thomsen. 2004. "A comparative study of differential evolution, particle swarm optimization, and evolutionary algorithms on numerical benchmark problems." Cec2004: Proceedings of the 2004 Congress on Evolutionary Computation, Vols 1 and 2: 1980-1987. doi: 10.1109/Cec.2004.1331139.
Wang, L., W. P. Sousa, P. Gong and G. S. Biging. 2004. "Comparison of IKONOS and QuickBird
images for mapping mangrove species on the Caribbean coast of Panama." Remote Sensing of Environment 91: 432-440. doi:10.1016/j.rse.2004.04.005.
Wang, Q. M., L. G. Wang and D. F. Liu. 2012. "Particle swarm optimization-based sub-pixel mapping
for remote-sensing imagery." International Journal of Remote Sensing 33: 6480-6496. doi:10.1080/01431161.2012.690541.
Wilkinson, G. G. 2005. "Results and implications of a study of fifteen years of satellite image
classification experiments." Ieee Transactions on Geoscience and Remote Sensing 43: 433-440. doi:10.1109/TGRS.2004.837325.
Wong, M. T., X. J. He and W. C. Yeh. 2011. "Image Clustering Using Particle Swarm Optimization."
2011 Ieee Congress on Evolutionary Computation (Cec): 262-268.
Xu, K., W. Yang, G. Liu and H. Sun. 2013. "Unsupervised Satellite Image Classification Using
Markov Field Topic Model." Ieee Geoscience and Remote Sensing Letters 10: 130-134. doi:10.1109/LGRS.2012.2194770.
Xu, Y. F. and S. L. Zhang. 2009. "Fuzzy Particle Swarm Clustering of Infrared Images." Icic 2009: Second International Conference on Information and Computing Science, Vol 2, Proceedings: 122-124.doi:10.1109/Icic.2009.139.
Yang, F. Q., T. E. L. Sun and C. H. Zhang. 2009. "An efficient hybrid data clustering method based on
K-harmonic means and Particle Swarm Optimization." Expert Systems with Applications 36: 9847-9852. doi:10.1016/j.eswa.2009.02.003.
Yang, X. S. 2010. Nature-Inspired Metaheuristic Algorithms. Luniver Press, 2nd edition.
Yang, X. S. and S. Deb. 2013. "Multiobjective cuckoo search for design optimization." Computers & Operations Research 40: 1616-1624. doi:10.1016/j.cor.2011.09.026.
Yen, J., J. C. Liao, B. J. Lee and D. Randolph. 1998. "A hybrid approach to modeling metabolic 3
For Peer Review Only
systems using a genetic algorithm and simplex method." Ieee Transactions on Systems Man and Cybernetics Part B-Cybernetics 28: 173-191. doi:10.1109/3477.662758.
Yildirim, A. 2014. "Unsupervised classification of multispectral Landsat images with multidimensional particle swarm optimization." International Journal of Remote Sensing 35: 1217-1243. doi:10.1080/01431161.2013.877617.
Yu, P., A. K. Qin and D. A. Clausi. 2012. "Unsupervised Polarimetric SAR Image Segmentation and
Classification Using Region Growing With Edge Penalty." Ieee Transactions on Geoscience and Remote Sensing 50: 1302-1317. doi:10.1109/TGRS.2011.2164085.
Yu, Y. F., G. Li and C. Xu. 2013. "An Improved Particle Swarm Optimization Algorithm." Frontiers of Manufacturing Science and Measuring Technology Iii, Pts 1-3 401: 1328-1335. doi:10.4028/www.scientific.net/AMM.401-403.1328.
Zhong, Y. F., L. P. Zhang, B. Huang and P. X. Li. 2006. "An unsupervised artificial immune classifier for multi/hyperspectral remote sensing imagery." Ieee Transactions on Geoscience and Remote Sensing 44: 420-431. doi:10.1109/TGRS.2005.861548.
List of figure captions:
Figure 1. Illustration of the evolution process of a particle in a 2-D spatial space.
Figure 2. Flowchart of ULPSO for remote sensing image classification.
Figure 3. Classification maps of the TM image achieved by the four methods: (a) TM image (bands 5, 4, 3); (b) ground reference data; and (c-f) classification maps produced by k-means, UGA, UPSO, and ULPSO methods, respectively.
Figure 4. Classification maps of the FLC image achieved by the four methods: (a) FLC image (bands 9, 6, 3); (b) ground reference data; and (c-f) classification maps produced by k-means, UGA, UPSO, and ULPSO methods, respectively.
Figure 5. Classification maps of the QuickBird image achieved by the four methods: (a) QuickBird image (bands 4, 3, 2); (b) ground reference data; and (c-f) classification maps produced by k-means, UGA, UPSO, and ULPSO methods, respectively.
Figure 6. Variations of the average value of clustering metric (number of repetition: 30 times) for the four classification methods over the three experiments.
Figure 7. Variations of the average value of clustering metric (number of repetition: 30 times) for the four PSO-based methods in the TM experiment.
Figure 8. Box plots of overall accuracies for the four PSO-based methods in the TM experiment.
3
For Peer Review Only
Figure 1. Illustration of the evolution process of a particle in a 2-D spatial space.
121x99mm (150 x 150 DPI) 3
For Peer Review Only
Figure 2. Flowchart of ULPSO for remote sensing image classification.
138x156mm (150 x 150 DPI) 3
For Peer Review Only
Figure 3. Classification maps of the TM image achieved by the four methods: (a) TM image (bands 5, 4, 3); (b) ground reference data; and (c-f) classification maps produced by k-means, UGA, UPSO, and ULPSO
methods, respectively.
140x122mm (150 x 150 DPI) 3
For Peer Review Only
Figure 4. Classification maps of the FLC image achieved by the four methods: (a) FLC image (bands 9, 6, 3); (b) ground reference data; and (c-f) classification maps produced by k-means, UGA, UPSO, and ULPSO
methods, respectively.
133x131mm (150 x 150 DPI)
For Peer Review Only
Figure 5. Classification maps of the QuickBird image achieved by the four methods: (a) QuickBird image (bands 4, 3, 2); (b) ground reference data; and (c-f) classification maps produced by k-means, UGA, UPSO,
and ULPSO methods, respectively.
137x122mm (150 x 150 DPI) 3
For Peer Review Only
Figure 6. Variations of the average value of clustering metric (number of repetition: 30 times) for the four classification methods over the three experiments.
142x123mm (150 x 150 DPI) 3
For Peer Review Only
Figure 7. Variations of the average value of clustering metric (number of repetition: 30 times) for the four PSO-based methods in the TM experiment.
110x82mm (150 x 150 DPI)
For Peer Review Only
Figure 8. Box plots of overall accuracies for the four PSO-based methods in the TM experiment.
133x107mm (150 x 150 DPI) 3
For Peer Review Only
Table 1. Classification accuracies achieved by the four methods with TM image.
Producer’s accuracy (%) User’s accuracy (%)
k-means UGA UPSO ULPSO k-means UGA UPSO ULPSO
Marsh 19.58 48.75 76.42 68.75 34.93 61.08 57.30 82.31
Meadow 85.14 76.01 77.20 84.19 84.24 75.02 90.75 92.40
Farmland 68.70 81.25 33.61 81.67 43.28 57.32 50.00 67.03
Salineland 79.83 65.85 94.41 94.15 96.52 98.35 83.82 88.81
Water 100.00 100.00 100.00 100.00 99.63 99.63 99.63 99.51
OA (%) 63.47 70.68 71.17 82.48 - - - -
For Peer Review Only
Table 2. Classification accuracies achieved by the four methods with FLC image.
Producer’s accuracy (%) User’s accuracy (%)
k-means UGA UPSO ULPSO k-means UGA UPSO ULPSO
Soybeans 99.07 97.90 99.33 99.50 37.65 94.17 92.12 91.07
Rye 95.54 98.78 98.08 97.99 90.89 79.02 90.78 94.28
Red clover 92.50 94.16 95.82 95.68 100.00 99.95 100.00 100.00
Wheat 13.35 75.04 90.43 94.35 69.32 95.15 98.34 98.93
OA (%) 70.90 90.39 95.40 96.52 - - - -
For Peer Review Only
Table 3. Classification accuracies achieved by the four methods with QuickBird image.
Producer’s accuracy (%) User’s accuracy (%)
k-means UGA UPSO ULPSO k-means UGA UPSO ULPSO
Paddy field 84.82 75.02 87.72 88.38 57.89 76.73 71.82 72.69
Farmland 69.31 76.33 71.12 72.41 92.18 89.43 91.51 90.99
Grass 49.23 48.18 52.64 53.61 38.08 43.77 39.43 40.50
Forest 17.10 32.66 50.34 50.92 38.73 29.16 74.54 75.83
Shadow 86.87 96.68 93.20 93.20 97.86 86.67 94.85 96.24
OA (%) 62.83 65.67 70.67 71.50 - - - -
For Peer Review Only
Table 4. Kappa z-test results for comparing the performance of the four classifications (bold numbers:
significant difference at 95% confidence level).
Experiment Method kappa coefficient (κ)
Kappa z-test
κ Variance (×10-5) UGA UPSO ULPSO
Landsat TM k-means 0.5325 5.2996 8.7208 9.3909 24.8770
UGA 0.6228 5.4220 - 0.6539 15.5487
UPSO 0.6296 5.3916 - - 14.8815
ULPSO 0.7759 4.2733 - - -
FLC k-means 0.6228 0.5280 26.7757 37.7273 40.6954
UGA 0.8696 0.3216 - 9.7257 12.3960
UPSO 0.9377 0.1687 - - 2.7813
ULPSO 0.9529 0.1300 - - -
QuickBird k-means 0.5183 6.2669 3.7927 9.2744 10.2076
UGA 0.5608 6.2897 - 5.4867 6.4162
UPSO 0.6225 6.3560 - - 0.9231
ULPSO 0.6329 6.3376 - - -