© 2019, IRJET | Impact Factor value: 7.211 | ISO 9001:2008 Certified Journal
| Page 675
CFD ANALYSIS OF WIND TURBINE BLADE FOR LOW WIND SPEED
Siva Subramanian S
Department of Mechanical Engineering, Loyola ICAM College of Engineering and Technology, Tamil Nadu, INDIA
---***---Abstract - The power generation problem is one of the important aspects of the world that has to address with high level of scientific reasoning and profound knowledge in the field of energy sources. Power can also be obtained from renewable resources, which include hydro power plants, solar power plants, solar thermal power plants and most importantly wind turbines. Hence harnessing and exploiting the energy comprised in the wind is important. Development of horizontal axis wind turbines (HAWTs) for small-scale application is important. A six bladed wind turbine system using the airfoils- Gottingen 364,384,428,480 and 682 were taken for the research. Using the design knowledge of on airfoils, key factors lift, drag and stall of the airfoil where studied and twist of the blade segments are designed with precision. Hence, the blades for a six bladed wind turbine system is designed for the optimal coefficient of lift value using Q-blade software with careful consideration at each location. Further, the aerodynamic parameters i.e. drag force, lift force, coefficient of drag, coefficient of lift and lift to drag ratio., pertaining to the wind turbine, the necessary calculations are formulated with the aid of Computational Fluid dynamics (CFD). Using the appropriate procedure of K-ϵ method to solve for the wind flow over the blade in an enclosed medium, the output parameters are calculated from the flow pattern in two functional form. By this method it is possible to reach the maximum amount of accuracy in carrying out the analysis and one can also obtain a very detailed output results. To check the aerodynamic design performance, the six bladed wind turbine system is validated using Numerical Study Computational Fluid Dynamics (CFD) using standard software’s(ANSYS-FLUENT) which forecast the performance of blades at low wind velocities. The parameters which are taken for analysis are carefully checked and correlated with IEC- 61400 Standard of small wind turbine system. The average wind velocity at hub height 3m/s is taken as wind designed input and the proposed designed six bladed wind turbine for each airfoils is carried for analysis. A six bladed wind turbine system having Gottingen airfoils 364,384,428,480 and 682 respectively were studied.Key Words- Gottingen, MRF, Mesh, Contour, K-ϵ.
1. INTRODUCTION
Wind Energy is the exercising of air flow through wind turbines to automatic power generators for electric power is a handy source of renewable energy. Wind power has been harnessed since before the Industrial Revolution in the form of windmills to thresh grains and for water pumping applications. The gradual and unceasing growth of this technology has led to the expansion of power generating massive wind turbines that we see these days. Wind Turbines largely, are huge in dimensions, noisy and require a wide space to function. This calls for installation of Wind Turbines in uninhabited rural areas, which are categorized by a robust flow of wind. Micro wind turbines can help to trim down high electricity costs and provide a cushion against ever increasing electricity demands. At remote locations in India, a micro wind turbine would be a practical and economical solution for the electricity complications, which might reduce our dependence on fossil fuels and circumvent greenhouse gases. Depending on the local wind resource and utility rates, a small wind energy system can minimize a
customer’s electricity bill by 50% to 60%. It can be installed as a standalone system, eliminating the high cost of extending utility power lines to a remote location, or it can be connected to the power grid, enabling the customer to sell excess power to the grid or buy additional power when needed through a reverse metering system. Payback on capital investment is within the life span of the wind turbine. Given that a large portion of the Indian land will not be viable for the use of traditional windmills due to low wind speeds, efficient blades and a generator that would produce energy even at very low wind 2 speed are requisite. As the transmission losses in India are very high, placing the turbine near the place of power consumption could prove to be a feasible solution.
1.1 HISTORY OF AIRFOILS
© 2019, IRJET | Impact Factor value: 7.211 | ISO 9001:2008 Certified Journal
| Page 676
studied behavior of blades could generate unexpected high torque. At the same time, the non-dimensional pitch rate and reduced frequency are too small to suggest a significant increase of the torque through the effects of unsteadiness. The torque subsequently decreased owing to inappropriate blade angles of attack, which lead to a substantial “idle time” at both high andlow wind speeds, in which the rotating blades are accelerated only slowly and the angles of attack decreased slowly.
Sikandar Khan et al. (2012) had a work on the aerodynamic analysis and dynamic modelling of small horizontal axis wind turbine. This research work, mainly focus on dynamic analysis and Pitch control of horizontal axis wind turbine. Pitch control is one of the most useful and important control, present in all of the current wind turbine models. For dynamic analysis and pitch control, simulation techniques and experimental works were done side by side.
Habali (2000) et al gave an overview of the operation of wind turbines at low cut-in wind speeds and he able to find possible way through aerodynamic optimization of the rotor blades, which is the most important part of a wind turbine.
Chen (2011) et al made experimental study and he briefed about the Aerodynamic shape optimization, which is one of the main research fields that is directly related to power production of a wind turbine. The optimum distributions of the chord length and the pitch angle in each section can be acquired according to the design parameters, which include the rated wind speed, number of blades, design tip speed ratio and design angle of attack.
Arifujjaman et al (2008) modeled a small wind turbine with furling mechanism and investigated the model resulting in dynamics. He simulates by regulating the speed of the wind turbine via a load control method. Tip speed ratio and hill climbing control methods provides maximum power extraction from a small wind turbine. Small-scale wind 3 turbines installed within the built environment is classified as micro generation technology.
Ditkovich et al. (2014) had provided an overview on a method for estimating the fixed and variable speed turbine performance index. The approach is based on Weibull wind probability distribution function and manufacturer provided power curve.
Xu et al. (2013) gave a brief study on building and explained about miniature wind turbine which received great attention recently for powering low power devices with a physics based comprehensive model for predicting the performance of miniature horizontal axis wind turbine.
Dong Ok Yu & Oh Joon Kwon et al (2014) designed a small wind turbine generator system which can be mounted in coastal areas and islands slop with a good structures and a protective system for reliable operation. A small wind turbine prototype with high reliability is designed and examined in the real island conditions.
Johansen et al (2002) made a study on wind turbine blades and he investigated Flows near blade tip and hub numerically. He found the flow through an untwisted blade HAWT is quite complicated to solve numerically because of the rotation of the turbine, coupled with turbulence and stall effects, hence The rotating wind turbine can be modelled with static or dynamic grid method.
2.2.
NUMERICAL STUDY ON BLADES© 2019, IRJET | Impact Factor value: 7.211 | ISO 9001:2008 Certified Journal
| Page 677
McKittrick et al (2001) gave a detailed report on analyzing the CFD techniques and it is found CFD methodology’s can
effectively predict the load characteristics of wind turbines and it is reasonable to employ pressure distributions obtained from CFD calculations as load conditions to This work highlighted two areas in computational fluid dynamics (CFD) which require for investigation transition point prediction and turbulence modelling. The laminar to turbulent transition point was modelled in order to get accurate results for the drag coefficient at various Reynolds numbers.
Karna Patel et al. (2014) made a brief study on CFD analysis of a airfoil and he provided information on relationship of drag, life and forces and it impact on airfoils. From the study, it is clear to find drag and lift forces using CFD methodology. The analysis of the two dimensional subsonic flow over a NACA 0012 airfoil at various angles of attack and operating at a Reynolds number of 3×E+06 is made and the CFD simulation results show close agreement with those of the experiments, thus suggesting a reliable alternative to experimental method in determining drag and lift. He also explained about the wind tunnel testing method to determine airfoil lift and drag forces where the process is quite laborious & costly more than CFD techniques. Thus validation of the research work has gone through analytical method then validation by experimental testing.
Kevin Cox & Andreas Echtermeyer et al (2012) gave an overview on the structural design and analysis of a 4 10MW wind turbine blade. The structural aspects of a 70- meter-long blade in an upwind, horizontal-axis wind turbine were developed and build into use at high wind speed location. The structure of the blade was build using hybrid composites which have glass and carbon fiber plies for yielding a lightweight design with a low tip deflection. The blade was subjected to FEA studies to demonstrate its ability to withstand the extreme loading conditions as per the international offshore wind standard. The results confirmed the design to have acceptable performance with regard to tip deflection, maximum and minimum strains, and critical buckling load.
Wenlei Sun et al. (2010) gave an overview on the design and the research re-search difficulty in building a largescale wind turbine blades to work. Where the major drawbacks are in the work occupy in the blades designs because of threedimensional blades model.
Chalothorn Thumthae & Tawit Chitsomboon et al (2006) recommended the importance of optimal angle of attack for untwisted blade in wind turbine. Hence the numerical simulation of horizontal axis wind turbines (HAWTs) with untwisted blade was performed to determine the optimal angle of attack that produces the highest power output. The numerical solution was carried out by solving conservation equations in a rotating reference frame wherein the blades and grids were fixed in relation to the rotating frame. Computational results of the 12° pitch compare favorably with the field experimental data of The National Renewable Laboratory (USA), for both inviscid and turbulent conditions. Numerical experiments were conducted by varying the pitch angles and the wind speeds. The power outputs reach maximum at pitch angles: 4.12°, 5.28°, 6.66° and 8.76° for the wind speeds 7.2, 8.0, 9.0 and 10.5 m/s, respectively. The optimal angles of attack were then obtained from the data.
Amano & Ryan Malloy et al (2013) explained about the improvement of blade aerodynamics and explore the possibility of increasing the number of profitable sites by optimizing wind turbine blade design for low wind speed areas.
Pedro Bañuelos-Sánchez et al. (2011) he gave a overview on low power-low cost horizontal axis wind turbine for 350Watt application. He describes a design and implementation of a low power Horizontal Axis Wind Turbine where the axis of rotation is parallel to the ground. Rotor, blades, supporting hub, and drive train are designed using computational software. Implemented wind turbine was tested and experimental results were obtained for 3.5 m/s to 9 m/s wind speed.
2.3.
SCOPE• The scope of the research work is to design a six
• bladed small horizontal axis wind turbine system - suitable for • low speed wind condition, which would be an alternative • The source for conventional large diameter wind turbine blades.
2.4.
OBJECTIVESThe main objectives of this research is:
• To design a wind turbine which is cost effective and generates high power output.
© 2019, IRJET | Impact Factor value: 7.211 | ISO 9001:2008 Certified Journal
| Page 678
Rotor tip is designed with great attention and precision as the tip of the blade moves substantially faster than the root of the blade. To select the suitable wind turbine, three design speed parameters, namely cut-in wind speed Vcut in, rated wind speed Vrated and cut out wind speed Vcutout can be calculated by using equations.Based on the average wind speeds in Tamil Nadu the rotor blades are to be designed. In this research, the annual average wind
speed (ū) of Tamil Nadu is anticipated to be
3m/s. The cut in speed is 1.4m/s and the cut out speed is 9m/s for the average wind speed taken. This average wind speed is the rated speed of the wind turbine.
4. AIRFOIL SELECTION
The main purpose of choosing this airfoil when compared to
other airfoils is to generate maximum lift force by minimizing drag force. This airfoil produced efficient results for wind turbines for different domestic applications. Lift force for the airfoil is high which is highly suited for low wind speed turbines. A higher L/D ratio is also possible with non- symmetrical profiles. This airfoil is chosen because it satisfies
many of the design criteria for optimal wind turbine rotor performance.
5. AIRFOIL DESIGN METHODOLOGY
The process of airfoil design proceeds from a knowledge of the boundary layer properties and the relation between geometry and pressure distribution. The goal of an airfoil design varies. Some airfoils are designed to produce low drag (and may not be required to generate lift at all.) Some
sections may need to produce low drag while producing a given amount of lift. In some cases, the drag doesn't really matter - it is maximum lift that is important. The section may
be required to achieve this performance with a constraint on thickness, or pitching moment, or off-design performance, or other unusual constraints. The relative thickness of aero foil changes in the span direction. For wing, shape Max. Relative
thickness, it decreases from 40% of root to 10%of leaf apex, to gain Max. Wind energy utilizing coefficient. The methods for airfoil design can be classified into two categories: direct and inverse design.
5.1.
DIRECT DESIGN METHODThe direct airfoil design method involves with specification of respective airfoils which are geometry sections, Calculated pressure and performance. Using the above parameters or specifications of the airfoil, its later tends to evaluates the given shape and then modifies the shape to improve the performance. The two main sub problems in Direct method of airfoil analysis are
© 2019, IRJET | Impact Factor value: 7.211 | ISO 9001:2008 Certified Journal
| Page 679
• The approach to changing the shape so that the performance is improved
The simplest form of direct airfoil design involves starting
with an assumed airfoil shape (such as a NACA airfoil), determining the characteristic of this section that is most problems some, and fixing this problem. The process involves fixing the most obvious problems with a given airfoil and it is repeated until no major problem with the section is able to found. The design of such airfoils does not require a specific definition of a scalar objective function, but it requires some expertise to identify the potential problems and often considerable expertise to fix them.Due to the complication and expertise involvement, the present research work for airfoil design uses inverse design of airfoils which is discussed below.
5.2.
INVERSE DESIGN METHODAnother type of objective function is the target pressure distribution. It is sometimes possible to specify a desired Cp distribution and use the least squares difference between the actual and target Cp's as the objective. This is the basic idea behind a variety of methods for inverse design. As an example, thin airfoil theory can be used to solve for the shape of the camber line that produces a specified pressure difference on an airfoil in potential flow. The second part of the design problem starts when one has somehow defined an objective for the airfoil design. This stage of the design involves changing the airfoil shape to improve the performance. This may be done in several ways:
By hand:
Using knowledge of the effects of geometry changes on Cp and Cp changes on performance.
By numerical optimization:
Using shape functions to represent the airfoil geometry and letting the computer decide on the sequence of modifications needed to improve the design. The airfoils used in this research are Gottingen airfoils which have non-dimensional linear chord length having profile thickness of unit length. Hence, the airfoils are then scaled to the chord length of the airfoil at each section. Different airfoils are noted and tested for the wind patterns and the airfoil most suited for the implementation of the wind turbine is selected.
6. GOTTINGEN PROFILES
6.1.
GOTTINGEN 364 AIRFOILGottingen 364 is proposed for analysis. It has Max
thickness of 10.8% at 30% chord and Max camber of 6.5% at 30% chord. Table 3.2 represents the non-dimensional linear chord length and profile thickness of Gottingen 364. This profile is an asymmetric profile and profile thickness on either side of the mean line may vary based on the profile.
© 2019, IRJET | Impact Factor value: 7.211 | ISO 9001:2008 Certified Journal
| Page 680
Figure 6.2. Gottingen 364 non-dimensional linear chord length and profile thickness6.2.
GOTTINGEN 384 AIRFOILGottingen 384 is proposed for analysis. It has Max thickness of 19.6% at 29.3% chord and Max camber of 6.9% at 39.3% chord. Table represents the non-dimensional linear chord length and profile thickness of Gottingen 384. This profile is an asymmetric profile and profile thickness on either side of the mean line may vary based on the profile.
Figure 6.3. Gottingen 384 airfoil
© 2019, IRJET | Impact Factor value: 7.211 | ISO 9001:2008 Certified Journal
| Page 681
6.3.
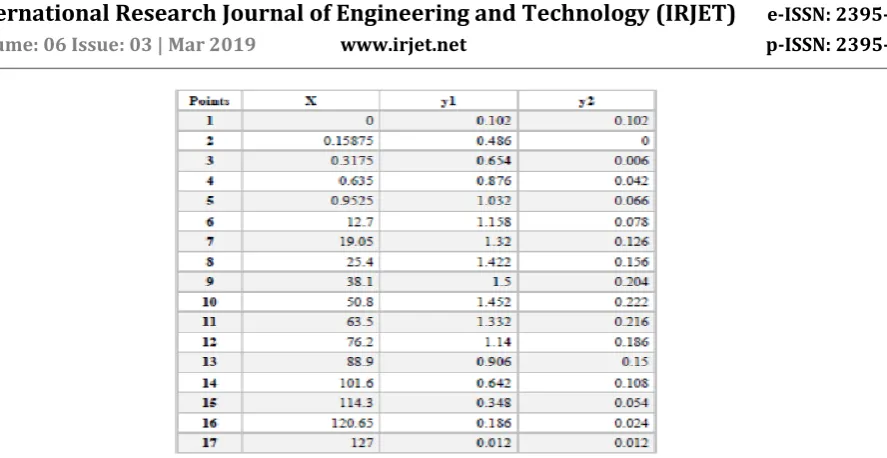
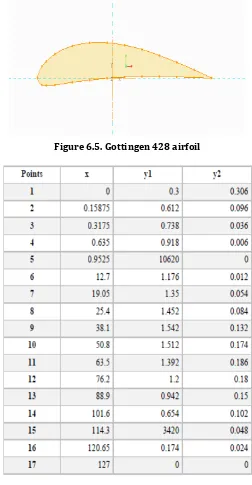
GOTTINGEN 428Gottingen 428 is proposed for analysis. It has Max thickness of 7.9% at 30% chord and Max camber of 5.2% at 40% chord. Table represents the non-dimensional linear chord length and profile thickness of Gottingen 428. This profile is an asymmetric profile and profile thickness on either side of the mean line may vary based on the profile.
[image:7.595.170.422.166.651.2]Figure 6.5. Gottingen 428 airfoil
Figure 6.6. Gottingen 428 non-dimensional linear chord length and profile thickness
6.4.
GOTTINGEN 682© 2019, IRJET | Impact Factor value: 7.211 | ISO 9001:2008 Certified Journal
| Page 682
Figure 6.7. Gottingen 682 airfoilFigure 6.8. Gottingen 682 non-dimensional linear chord length and profile thickness
6.5.
GOTTINGEN 480© 2019, IRJET | Impact Factor value: 7.211 | ISO 9001:2008 Certified Journal
| Page 683
Figure 6.9. Gottingen 480 airfoilFigure 6.10. Gottingen 480 non-dimensional linear chord length and profile thickness
7. BLADE CONSTRUCTION
© 2019, IRJET | Impact Factor value: 7.211 | ISO 9001:2008 Certified Journal
| Page 684
Figure 7.1. Blade construction table Gottingen 364© 2019, IRJET | Impact Factor value: 7.211 | ISO 9001:2008 Certified Journal
| Page 685
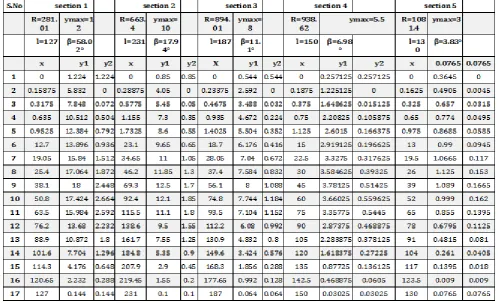
Figure 7.3. Blade construction table Gottingen 428© 2019, IRJET | Impact Factor value: 7.211 | ISO 9001:2008 Certified Journal
| Page 686
5 0.9525 11.592 0.144 1.7325 8.1 0.1 1.4025 5.152 0.064 1.125 2.435125 0.03025 0.975 0.7245 0.009 6 12.7 12.816 0 23.1 8.9 0 18.7 5.696 0 15 2.69225 0 13 0.801 0 7 19.05 14.4 0.72 34.65 10 0.5 28.05 6.4 0.32 22.5 3.025 0.15125 19.5 0.9 0.045 8 25.4 15.336 0.288 46.2 10.7 0.2 37.4 6.816 0.128 30 3.221625 0.0605 26 0.9585 0.018 9 38.1 16.128 0.72 69.3 11.2 0.5 56.1 7.168 0.32 45 3.388 0.15125 39 1.008 0.045 10 50.8 15.696 1.08 92.4 10.9 0.75 74.8 6.976 0.48 60 3.29725 0.226875 52 0.981 0.0675 11 63.5 14.472 1.152 115.5 10.1 0.8 93.5 6.432 0.512 75 3.040125 0.242 65 0.9045 0.072 12 76.2 12.456 1.224 138.6 8.7 0.85 112.2 5.536 0.544 90 2.616625 0.257125 78 0.7785 0.0765 13 88.9 9.936 1.08 161.7 6.9 0.75 130.9 4.416 0.48 105 2.08725 0.226875 91 0.621 0.0675 14 101.6 6.984 0.864 184.8 4.9 0.6 149.6 3.104 0.384 120 1.467125 0.1815 104 0.4365 0.054 15 114.3 3.672 0.504 207.9 2.6 0.35 168.3 1.632 0.224 135 0.771375 0.105875 117 0.2295 0.0315 16 120.65 1.944 0.216 219.45 1.4 0.15 177.65 0.864 0.096 142.5 0.408375 0.045375 123.5 0.1215 0.013517 127 0 0 231 0 0 187 0 0 150 0 0 130 0 0
Figure 7.5. Blade construction table Gottingen682
8. NUMERICAL METHOD
8.1.
NUMERICAL ANALYSIS• The modelled blade is saved in the. stp (STEP) format.
• This model is imported into ANSYS 14.5 work bench in the FLUENT solver.
• In the design modeler of the ANSYS the fluid domain is modelled with a inlet pipe, MRF zone and the outlet pipe.
• The blade is positioned in the MRF zone. This is then imported into the mesh module of the analysis software.
• A patch conforming mesh is done.
• The mesh is now imported to the fluent solver and the necessary boundary conditions are defined. • The simulation is run till convergence of the answer.
The results obtained are plotted and compared with the theoretical results.
8.2.
ANALYSIS PROCEDURE• Building of blades
• For modelling the turbine, we first select the airfoil section. Based on the information from the blade construction table, the airfoil sections of various chord lengths are place at specific sections in the blade.
• The airfoil points are imported in to the modeler and a surface is created as shown in Figure along the various airfoil sections as shown in Figure.
© 2019, IRJET | Impact Factor value: 7.211 | ISO 9001:2008 Certified Journal
| Page 687
Figure 8.2. MODELLED BLADE8.3.
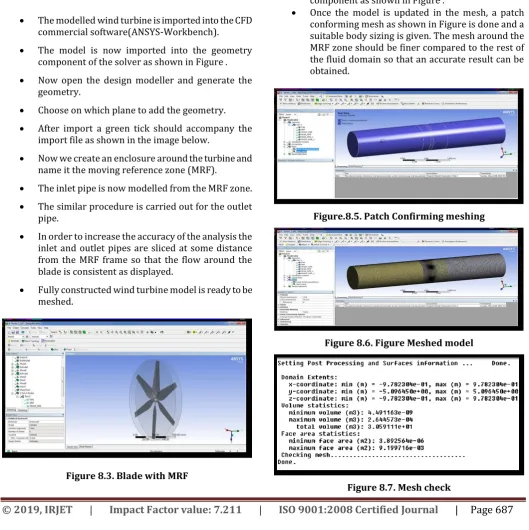
FLUID DOMAIN GENERATION• The modelled wind turbine is imported into the CFD commercial software(ANSYS-Workbench). • The model is now imported into the geometry
component of the solver as shown in Figure . • Now open the design modeller and generate the
geometry.
• Choose on which plane to add the geometry. • After import a green tick should accompany the
import file as shown in the image below.
• Now we create an enclosure around the turbine and name it the moving reference zone (MRF).
• The inlet pipe is now modelled from the MRF zone. • The similar procedure is carried out for the outlet
pipe.
• In order to increase the accuracy of the analysis the inlet and outlet pipes are sliced at some distance from the MRF frame so that the flow around the blade is consistent as displayed.
[image:13.595.34.564.276.807.2]• Fully constructed wind turbine model is ready to be meshed.
Figure 8.3. Blade with MRF
Figure 8.4. Analysis model with MRF model along with the inlet and outlet
• The model is saved and then updated into the mesh component as shown in Figure .
• Once the model is updated in the mesh, a patch conforming mesh as shown in Figure is done and a suitable body sizing is given. The mesh around the MRF zone should be finer compared to the rest of the fluid domain so that an accurate result can be obtained.
Figure.8.5. Patch Confirming meshing
Figure 8.6. Figure Meshed model
© 2019, IRJET | Impact Factor value: 7.211 | ISO 9001:2008 Certified Journal
| Page 688
Similarly, for all the wind turbine models which isdesigned with Gottingen airfoils the patch confirming mesh is provided and the details is given table below.
MODEL GOE364 GOE384 GOE
482 GOE480 GOE682 MESH
TYPE Triangular mesh Triangular mesh Triangular mesh Triangular mesh Triangular mesh MESH
COUNT 1500000 1500000 1500000 1500000 1500000 SKEWN
ESS 0.7 0.7 0.7 0.7 0.7
• The solver type is chosen to be pressure based and the time function as steady state.
• Due to lack of computational power we cannot do a transient state analysis due to the huge volume of data to be processed.
• The domain consists an inlet zone and outlet zone and MRF zone as shown in the above figure. • For Inlet the velocity inlet is opted & for outlet
pressure outlet is taken.
• The Realizable K-ϵ Model is chosen along with a standard wall function.
• The cell zone condition of the MRF is given a frame motion and made to rotate at -300 RPM (counter clockwise rotation).
• The analysis done here is an inverse analysis where the turbine is rotated at 300 RPM and the corresponding inlet velocity due to the suction created by it is recorded.
• Hence based on the airfoil profile used, the inlet velocity will vary.
• This can then be used to match the profile with the place.
• This will prove that the corresponding inlet velocity which is to be obtained only for that profile. • The solution is initialized and the calculation is run
till it converges.
• The procedure stated above is repeated for various blades and the converged solution is obtained. • The results are then obtained from the CFD post
processor.
Figure 8.8. Boundary conditions with inlet ,outlet and MRF
• The domain consists an inlet zone and outlet zone and MRF zone as shown in the above figure. • For Inlet the velocity inlet is opted & for outlet
pressure outlet is taken.
• The Realizable K-ϵ Model is chosen along with a standard wall function.
• The cell zone condition of the MRF is given a frame motion and made to rotate at -300 RPM (counter clockwise rotation).
• The analysis done here is an inverse analysis where the turbine is rotated at 300 RPM and the corresponding inlet velocity due to the suction created by it is recorded.
• Hence based on the airfoil profile used, the inlet velocity will vary.
• This can then be used to match the profile with the place.
• This will prove that the corresponding inlet velocity which is to be obtained only for that profile. • The solution is initialized and the calculation is run
till it converges.
• The procedure stated above is repeated for various blades and the converged solution is obtained. • The results are then obtained from the CFD post
processor.
9. NUMERICAL RESULTS
The computational results for the different airfoils for the given blade are discussed. The performance of the airfoils are also displayed in this chapter. After the solution is converged, the CFD post processing method is used to obtain the various results are shown in form of graph and contours. The various results obtained from the analysis are
© 2019, IRJET | Impact Factor value: 7.211 | ISO 9001:2008 Certified Journal
| Page 689
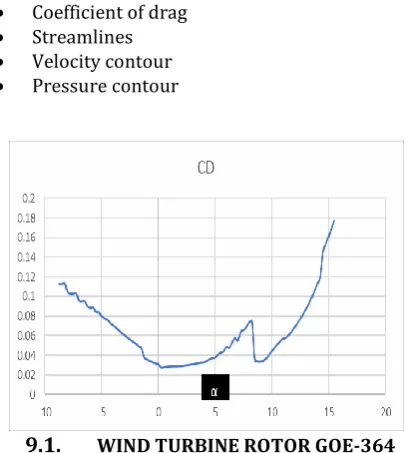
• Coefficient of drag• Streamlines • Velocity contour • Pressure contour
9.1.
WIND TURBINE ROTOR GOE-364Figure 9.1 GOE-364 CD vs α(Angle of attack)
The above graph shown represents CD vs α (Angle of attack)
where maximum CD of the airfoil reaches at 15 Degree of angle of attack.
Figure 9.2. GOE 364 CL vs α (Angle of attack) The above graph shown represents Cl vs α (Angle of attack)
[image:15.595.56.262.94.321.2]where maximum Cl of the airfoil reaches at 9 Degree of Angle of attack and Cl value is 1.3 respectively.
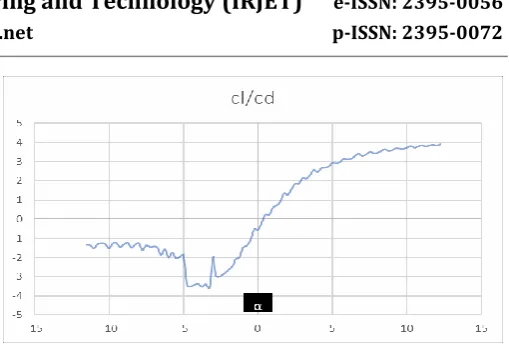
Figure 9.3. GOE 364 cl/cd vs α(Angle of attack)
The above graph shown represents cl/cd vs α (Angle of attack) where maximum cl/cd of the airfoil reaches at 9 Degree of Angle of attack and cl/cd value is 40 respectively. 9.1.1. CONTOURS OF STREAMLINE
Figure 9.4. GOE 364 Streamlines
The above explains the flow of the wind as it hits the blade. This flow varies every second and the streamlines of air passes through the wind turbine. We can see that the wind flow is concentrated towards the hub. As the turbine is rotating the air in front of it sucked in and pushed out. This will cause a pressure drop in front of the turbine. The blade angle is set in such a way that the starting torque is high. Owing to the rotation of the turbine at 300 RPM we get a velocity of 3.36 m/s in the inlet. Similar results can be obtained for the other blades with various airfoil sections.
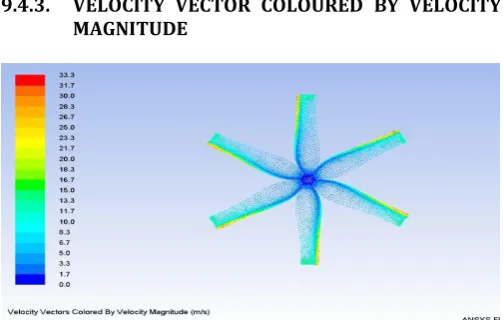
9.1.2. CONTOURS OF VELOCITY MAGNITUDE
Figure 9.5 Velocity Contours- GOE 364 9.1.3. PRESSURE CONTOURS
© 2019, IRJET | Impact Factor value: 7.211 | ISO 9001:2008 Certified Journal
| Page 690
Figure 9.7. Velocity vector of wind turbine blade-GOE364 airfoil
9.2.
WIND TURBINE ROTOR GOE-384Figure 9.8. GOE-384 CD vs α(Angle of attack)
The above graph shown represents CD vs α (Angle of attack)
[image:16.595.307.562.55.227.2]where maximum CD of the airfoil reaches at 12.5 Degree of angle of attack.
Figure 9.9 GOE 384 CL vs α (Angle of attack) The above graph shown in the figure, represents Cl vs α
(Angle of attack) where maximum Cl of the airfoil reaches at 13 Degree of Angle of attack and Cl value is 0.54 respectively.
Figure 9.10 GOE 384 cl/cd vs α(Angle of attack)
The above graph shown represents cl/cd vs α (Angle of
attack) where maximum cl/cd of the airfoil reaches at 9 Degree of Angle of attack and cl/cd value is 40 respectively. 9.2.1. CONTOURS OF STREAMLINE
Figure 9.11. GOE 384 Streamlines
The inlet velocity obtained from this airfoil is 3.13m/s from the figure we can clearly see that the velocity will be less as compared to the 364 airfoil from the streamlines that is obtained from the analysis. The streamlines are less dense compared to the 364 airfoil.
9.2.2. CONTOUR OF VELOCITY MAGNITUDE
[image:16.595.42.279.145.273.2]© 2019, IRJET | Impact Factor value: 7.211 | ISO 9001:2008 Certified Journal
| Page 691
9.2.3. PRESSSURE CONTOURSFigure 9.13 Pressure contours- GOE 384
Differential of the pressure distribution on blade surface which is obtained due to mainly from the three-dimensional rotation effect and flow separation on the blade and closer to the root of blade the stronger this effect will be.
[image:17.595.310.560.129.256.2]9.2.4. VELOCITY VECTOR COLOURED BY VELOCITY MAGNITUDE
Figure 9.14 Velocity Contours- GOE 384
9.3.
WIND TURBINE ROTOR SYSTEM GOE-428Figure 9.15. GOE-428 CD vs α(Angle of attack)
[image:17.595.318.548.316.462.2]The above graph shown represents CD vs α (Angle of attack) where maximum CD of the airfoil reaches at 16 Degree of angle of attack.
Figure 9.16 GOE 428 CL vs α (Angle of attack)
The above graph shown represents Cl vs α (Angle of attack) where maximum Cl of the airfoil reaches at 9 and at 13 Degree of Angle of attack and Cl value is 1.3 respectively.
Figure 9.17 GOE 428 cl/cd vs α(Angle of attack)
The above graph shown represents cl/cd vs α (Angle of
attack) where maximum cl/cd of the airfoil reaches at 9 Degree of Angle of attack and cl/cd value is 40 respectively.
9.3.1. CONTOURS OF STREAMLINE
It is clearly visible from above figure that from the streamlines the inlet velocity should be higher than that of the 364 and 384 airfoils owing to the density of the streamlines in the inlet pipe. The velocity obtained here is 3.7 m/s.
[image:17.595.34.289.343.485.2] [image:17.595.33.270.518.708.2] [image:17.595.310.558.621.742.2]© 2019, IRJET | Impact Factor value: 7.211 | ISO 9001:2008 Certified Journal
| Page 692
Figure 9.19 Velocity Contours- GOE 4289.3.3. PRESSURE CONTOURS
[image:18.595.35.287.85.259.2]Similar to the wind turbine rotor system of Gottingen airfoil Differential of the pressure distribution on blade surface which is obtained due to mainly from the three-dimensional rotation effect and flow separation on the blade and closer to the root of blade the stronger this effect will be. But minor changes can be viewed near the leading edge of the blade.
Figure 9.20 Pressure contours- GOE 428
9.3.4. VELOCITY VECTOR COLOURED BY VELOCITY
Figure 9.21 Velocity Contours- GOE 428
Figure 9.22 GOE-480 CD vs α(Angle of attack)
The above graph shown represents CD vs α (Angle of attack)
[image:18.595.309.561.341.504.2]where maximum CD of the airfoil reaches at 13 Degree of angle of attack.
Figure 9.23 GOE 480 CL vs α (Angle of attack)
The above graph shown represents Cl vs α (Angle of attack) where maximum Cl of the airfoil reaches at 12 and Degree of Angle of attack and Cl value is 0.8 respectively.
[image:18.595.39.285.393.543.2] [image:18.595.308.560.567.723.2]© 2019, IRJET | Impact Factor value: 7.211 | ISO 9001:2008 Certified Journal
| Page 693
The above graph shown represents cl/cd vs α (Angle of
attack) where maximum cl/cd of the airfoil reaches at 5 Degree of Angle of attack and cl/cd value is 10 respectively.
9.4.1. CONTOURS OF STREAMLINE
Figure 9.24 GOE 480 Streamlines
[image:19.595.38.287.159.313.2]The streamlines as shown in the above figure are like that of the 428 airfoil which gives a similar inlet velocity of 3.5m/s.
Figure 9.25 Velocity Contours- GOE 480
9.4.2. PRESSURE CONTOURS
Figure 9.26 Pressure contours- GOE 480
Similar to the wind turbine rotor system of Gottingen airfoil Differential of the pressure distribution on blade surface which is obtained due to mainly from the three-dimensional rotation effect and flow separation on the blade and closer to the root of blade the stronger this effect will be. But minor changes can be viewed near the leading edge of the blade.
[image:19.595.308.560.179.339.2]9.4.3. VELOCITY VECTOR COLOURED BY VELOCITY MAGNITUDE
Figure 9.27 Velocity Contours- GOE 480
[image:19.595.311.551.356.541.2]9.5.
WIND TURBINE ROTOR SYSTEM GOE-682Figure 9.28 GOE-682 CD vs α(Angle of attack)
The above graph shown represents CD vs α (Angle of attack)
where maximum CD of the airfoil reaches at 13 Degree of angle of attack.
[image:19.595.37.286.385.532.2] [image:19.595.331.539.618.749.2]© 2019, IRJET | Impact Factor value: 7.211 | ISO 9001:2008 Certified Journal
| Page 694
Figure 9.30 GOE 480 cl/cd vs α(Angle of attack)The above graph shown represents cl/cd vs α (Angle of
attack) where maximum cl/cd of the airfoil reaches at 4.7 Degree of Angle of attack and cl/cd value is 10 respectively.
9.5.1. CONTOURS OF STREAMLINE
Figure 9.31 GOE 682 Streamlines
The 682 airfoil streamlines are much different from the other airfoils. From the above figure , we can see that the effect of the wind turbine blade is near the vicinity of the blade which indicates that the inlet velocity of the blade is low. The inlet velocity obtained here is 2.8 m/s.
9.5.2. CONTOURS OF VELOCITY MAGNITUDE
[image:20.595.37.285.142.260.2]Figure 9.32 Velocity Contours- GOE 682
Figure 9.33 Pressure contours- GOE 682
9.6.
COMPUTATIONAL RESULTS OF WIND TURBINE [image:20.595.38.288.360.517.2] [image:20.595.308.559.389.565.2]An overview of the computational results adopted in this investigation is presented in this chapter. The CFD investigations resulted in some interesting observations. The figure indicates the average velocity of the wind hitting the turbine blade at the rated speed of the turbine.
Figure 9.33 Distribution of Contour of velocity over the blade
As the result the velocity magnitude has a maximum value at the tip of the blades and is practically zero at the centre of the hub. The very fact is that all the blade tips show
maximum velocity and this ensures that the turbine’s axis
© 2019, IRJET | Impact Factor value: 7.211 | ISO 9001:2008 Certified Journal
| Page 695
Figure 9.34 Distribution of contours of pressure overthe blade
As seen in the pressure contour on the blade surface is in the range of 100 Pa and the visualization shows that the darker region is where the pressure is high and that it is rotating in the anti-clockwise direction. These pressure plots do not affect the computational power output adversely because they occur at the inner blade span, which contributes little to the torque in the blades. The velocity magnitude figure reveals the path of the wind when it hits the blades and passes through the turbine at a steady state. The path of the wind would vary at every second for a transient state analysis.
Figure 9.35 Velocity Streamline of the rotating blade
The streamlines tell us about the path of the wind as it hits the blade. This path varies every second. The streamlines of air pass through the wind turbine. We can see that the wind flow is concentrated towards the hub. As the turbine is rotating, the air in front of it is sucked in and pushed out. This will cause a pressure drop in front of the turbine. The blade angle is set in such a way that the starting torque is high. The streamline of air passes through the turbine blades as shown in Figure. The numerical solution, for the velocity at rated power is close to the experimental values. The high blade angle at the root provides high starting torque for the low wind speeds. From the streamline investigation, it is
clear that the wind speed averages around 3.4 m/s. After the solution is converged, the CFD post processing is run to obtain the various results.
10. CONCLUSION
Under typical design conditions, the rated power of 1kW was obtained by vigilant experimentation and was adequately validated with the investigations on CFD. The test results indicate that the blades were sufficiently efficient and it complied with the design considerations of the turbine. The wind tunnel tests were useful to select the blade angles by indicating the ratio of lift to drag coefficients at different sections along the length of the blade. The blade design and the performance of these blades in low wind speed conditions were observed at 300 rpm and simulation results ensure optimum power output at 3.4 m/s. It was witnessed and demonstrated that the blades were designed efficiently and the rated power output was obtained at a very low wind speed of 4.4m/s.
REFERENCES
1. Arici, O, Chang, YL & Yang, SL 1995, ‘Navier-Stokes Computations of the NREL Airfoil Using K-w Turbulent
Model High Angles of Attack’. Journal of Solar Energy Engineering, vol. 117.
2. Arifujjaman, MD, Iqbal, MT & Quaicoe, JE 2008, ‘Energy
capture by a small wind-energy conversion system’, Applied
Energy, vol. 85, no. 1, pp. 41-51.
3. Ashuri, T, Zaaijer, MB, Martins, JRRA, Zhang, J 2016,
‘Multidisciplinary design optimization of large wind turbines
– technical, economic, and design challenges’, Energy
Convers Manage vol. 123, pp. 56–70.
4. Bahaj, AS, Meyers, L, James, PAB 2007, ‘Urban energy
generation: influence of micro-wind turbine output on electricity consumptions in buildings’, Energy and Buildings,
vol. 39, no. 2, pp. 154e165
. 5. Bahaj, AS, Myers, L & James, PAB 2007, ‘Urban energy
generation: Influence of micro-wind turbine output on
electricity consumption in buildings’, Energy and Buildings,
vol. 39, no. 2, pp. 154-165.
6. Bai, CJ, Hsiao, FB, Li, MH, Huang, GY & Chen, YJ 2013,
‘Design of 10 kW Horizontal-Axis Wind Turbine (HAWT) Blade and Aerodynamic Investigation Using Numerical
Simulation’, Procedia Engineering, vol. 67, pp. 279 – 287.
7. Barnes & Morozov, EV 2016, ‘Structural optimisation of
composite wind turbine blade structures with variations of
internal geometry configuration’, Journal of Composite
[image:21.595.37.288.442.595.2]© 2019, IRJET | Impact Factor value: 7.211 | ISO 9001:2008 Certified Journal
| Page 696
10. Bottasso, CL, Campagnolo, F, Croce, A, Dilli, S, Gualdoni, F& Nielsen, MB 2013, ‘Structural optimization of wind turbine
rotor blades by multilevel sectional/multibody/3D-FEM
analysis’, Journal of Multibody Syst Dyn., pp. 1-30.
11. Braslow, AL 1999, ‘A History of Suction-Type
LaminarFlow Control with Emphasis on Flight Research’,
NASA History Division.
12. Brian Hayman 2007, ‘Approaches to Damage Assessment and Damage Tolerance for FRP Sandwich
Structures’, Journal of Sandwich Structures and Materials,
vol. 9, pp. 571-596.
13. Brown, KA & Brooks, RA 2010, ‘Design and analysis of vertical axis thermoplastic composite wind turbine blade’,
Journal of Design and analysis of wind turbine blade, vol. 39, no. 3-5, pp. 111-121.
14. Cairns, DS & Mandell, J 2000, ‘Design Considerations for Buckling in Composite Wind Turbine Blades’, AIAA-2000-59, 38th AIAA Aerospace Sciences Meeting and Exhibit, Reno, NV, Jan. 10-13..
15. Castelli, MR & Benini, E 2011, ‘Effect of blade inclination angle on a Darrieus wind turbine’, Journal of Turbomach.,
vol. 133.
16. Castelli, MR, Englaro, A & Benini, E 2011, ‘The Darrieus
wind turbine: proposal for a new performance prediction
model based on CFD’, Energy, vol. 36, no. 6, pp. 4919e4934.
17. Castelli, MR, Pavesi, G, Benini, E, Battisti, L & Ardizzon, G
2010, ‘Modeling strategy and numerical validation for a
Darrieus vertical axis micro-wind turbine’, in: Proceedings of the ASME 2010 International Mechanical Engineering Congress & Exposition, November 2010, Vancouver, British Columbia, IMECE2010-39548, p. 12e18.
18. Changduk Kong, Minwoong Kim & Gilsu Park 2014, ‘A
study on aerodynamic and structural design of high efficiency composite blade of 1 MW class HAWTS
considering fatigue life’, Advanced Composite Materials, vol.
24, no. 1, pp. 67-83, 2014.
19. Changduk Kong, Suhyun Choi & Hyunbum Park 2011,
‘Investigation on Design for a 500 W Wind Turbine
Composite Blade Considering Impact Damage’, Advanced
Composite Materials, vol. 20, pp. 105-123.
22. Clausen, PD, Wood, DH 2000, ‘Recent advances in small wind turbine technology’, Wind Eng., vol. 24, no. 3, pp. 189–
201.
23. Clifton, A, Daniels, M & Lehning 2014, ‘Effect of winds in a mountain pass on turbine performance’, Wind Energy, vol.
17, no. 10, pp. 1543-1562.
24. Cooper, P, Kosasih, PB & Ledo, L 2010, ‘Roof mounting
site analysis for micro-wind turbines’, Renewable Energy,
vol. 36, pp. 1379-1391.
25. Corinne Wichser & Katherine Klink 2008, ‘Low wind
speed turbines and wind power potential in Minnesota, USA’,
Journal of Renewable Energy, vol. 33, pp. 1749- 1758.
26. Dalala, ZM, Zahid, ZU & Yu, WS 2013, ‘Design and
analysis of an MPPT technique for small-scale wind energy
conversion systems’, IEEE Trans. Energy Convers., vol. 28,
no. 3, pp. 756–767.
27. Davood Salimi-Majd, Vahid Azimzadeh & Bijan
Mohammadi 2014, ‘Loading Analysis of Composite Wind
Turbine Blade for Fatigue Life Prediction of Adhesively Bonded Root Joint2014, Journal of Appl., Compos Mate, pp. 1-19.
28. De Paor, AM 1982, ‘Aerodynamic design of optimum
wind turbines’, Appl Energy, vol. 12, pp. 221–228.
29. Ditkovich, Y, Kuperman, A, Yahalom, A & Byalsky, M
2014, ‘Alternative Approach to Wind Turbine Performance Index Assessment’, Journal of Energy Engineering, vol. 140,
no. 4, p. 06014001.
30. Dong Ok Yu & Oh Joon Kwon 2014, ‘Predicting wind
turbine blade loads and aeroelastic response using a coupled
CFDeCSD method’, Journal of Renewable Energy, vol. 30, pp.
1-13.
31. Dong, Y, Guo, J & Zhang, X 2013, ‘Development and
Performance Analysis of a Small Island Wind Turbine
Generator System with High Reliability’, Journal of Energy
Engineering, vol. 139, no. 3, pp. 223-229.
32. Ebert, PR & Wood, DH 1997, ‘Observations of the starting
behavior of a small horizontal-axis wind turbine’, Renewable
© 2019, IRJET | Impact Factor value: 7.211 | ISO 9001:2008 Certified Journal
| Page 697
33. Eggleston, DM & Starcher, K 1990, ‘A Comparative Study
of the Aerodynamics of Several Wind Turbines Using Flow
Visualization” Journal of Solar Energy Engineering, vol. 1, 12,
Nov 90.
34. Fernando Ponta, L, Alejandro Otero, D, Lucas Lago, I &
Anurag Rajan 2016, ‘Effects of rotor deformation in wind -turbine performance: The Dynamic Rotor Deformation Blade
Element Momentum model (DRDeBEM)’, Journal of
Renewable Energy, vol. 92, pp. 157-170.
35. Ferrer, E & Munduante, X 2007, ‘Wind Turbine Blade Tip Comparisons Using CFD’, Journal of Physics Conference
series, vol. 7, p. 012005.
36. Filippi, M & Carrera, E 2015, ‘Aerodynamic and
Mechanical Hierarchical Aero elastic Analysis of Composite
Wings’, Mechanics of Advanced Materials and Structures, pp. 1-32.
37. Gary Johnson, 2001, November 20, 2001. Wind Energy Systems.
38. Giguere, P & Selig, M 1998, ‘New airfoils for small horizontal axis wind turbines’, J. Sol. Energy Eng., vol. 120,
pp. 108-114.
39. Göçmen, T, van der Laan, P, Réthoré, PE, Diaz, P,
Chr.Larsen, G, Ott, S 2016, ‘Wind turbine wake models developed at the technical university of Denmark: a review’,
Renew Sustain Energy Rev., vol. 60, pp. 752–69.
40. Schlichting H 2017 Boundary-Layer Theory. McGrawHill Book Company, ninth edition
41. Habali, SM & Saleh, IA 2000, ‘Local design, testing and
manufacturing of small mixed airfoil wind turbine blades of glass fiber reinforced plastics. Part I: design of the blade and
root’, Energy Conversion and Management, vol. 41, no. 3, pp. 249-280.
42. Habali, SM & Saleh, IA 2004, ‘Local design, testing and
manufacturing of small mixed airfoil wind turbine blades of glass fiber reinforced plastics part I: design of the blade and
root’, Energy Conversion & Management, vol. 41, pp. 249-280.
43. Hansen, MOL 2000, Aerodynamics of Wind Turbines James & James, London.
44. Hansen, MOL 2008, ‘Aerodynamics of wind turbines’, 2nd
ed. London, UK: Earthscan.
45. Hassanzadeh, A, Hassanabad, AH & Dadvand, A 2016,
‘Aerodynamic shape optimization and analysis of small wind turbine blades employing the Viterna approach for post-stall
region’, Alexandria Eng. J.
http://dx.doi.org/10.1016/j.aej.2016.07.008.
46. Henrik Stensgaard Toft, Kim Branner, Peter Berring &
John Dalsgaard Sørensen 2011, ‘Defect distribution and reliability assessment of wind turbine blades’, Journal of
Engineering Structures, vol. 33, pp. 171-180.
47. Hermann, TM, Dharmaraj Mamarthupatti & Locke, JE
2005, ‘Postbuckling Analysis of a Wind Turbine Blade Substructure’, J.Sol. Energy Eng., vol. 127, pp. 544-552.
48. Hirahara, H, Hossain MZ, Kawahashi, M & Nonomura, Y
2005, ‘Testing basic performance of a very small wind
turbine designed for multi-purposes’, Renewable Energy, vol.
30, no. 8, pp. 1279-1297.
49. Holmes, JW, Brøndsted, P, Sørensen, BF, Jiang, Z, Sun, Z &
Chen, X 2009, ‘Development of a bamboo-based composite as
a sustainable green material for wind turbine blades’, Wind
Eng., vol. 33, pp. 197-210.
50. Houghton, PCEL 2003, ‘Aerodynamics for Engineering Students’, Butterworth Heinemann, fifth ed.
51. Hyunbum Park 2015, ‘A study on structural design and
analysis of small wind turbine blade with natural fibre(flax)
composite’, Advanced Composite Material, pp. 1-20.
52. Indra Nugroho, H, Hermawan Judawisastra, M, Giri
Suada & Mardjono Siswosuwarno 2011, ‘Lay-Up Design of
Low Wind Speed Composite Turbine Blade’, Key Engineering
Materials, vol. 471, pp. 981-986.
53. Jcaobsen, MZ 2002, ‘Secondary Energy Info Handbook’.
54. Jihoon Jeong, Kyunghyun Park, Sangook Jun, Kisun Song & Dong-Ho Lee 2012, ‘Design optimization of a wind turbine
blade to reduce the fluctuating unsteady aerodynamic load
in turbulent wind’, Journal of Mechanical Science and Technology, vol. 26, no. 3, pp. 827-838.
55. Johansen, J & Sørensen, NN 2002, ‘Numerical investigation of three wind turbine blade tips’, Risø National
Laboratory, Risø-R-1353 (EN).
56. Johansen, J & Sørensen, NN 2006, ‘Aerodynamic
investigation of winglets on wind turbine blades using CFD’,
Risø National Laboratory, Risø-R-1543 (EN).
57. Johansen, J, Madsen, HA, Sørensen, NN & Bak, C 2006,
‘Numerical investigation of a wind turbine rotor with an
aerodynamically redesigned hub-region’, In 2006 European
wind energy conference and exhibition, Athens, Greece.
58. Johnson, GL 1985, ‘Wind Energy Systems’, Prentice Hall,
Englewood Cliffs.
59. Johnson, KE2004, ‘Adaptive torque control of variable speed wind turbines’ (National Renewable Energy
© 2019, IRJET | Impact Factor value: 7.211 | ISO 9001:2008 Certified Journal
| Page 698
62. Krogstad, PÅ & Adaramola, MS 2012, ‘Performance andnear wake measurements of model horizontal axis turbine’,
Wind Energy, vol. 15, pp. 743 – 756.
63. Lanzafame, R & Messina, M 2009, ‘Design and
performance of a double-pitch wind turbine with nontwisted
blades’, Renewable Energy vol. 34, pp. 1413- 1420.
64. Larsen, TJ & Hansen, AM 2007, ‘How 2 HAWC2, the user's manual’, Ris_ National Laboratory.
65. Le Gourieres, D 1982, ‘Wind Power Plants: Theory and Design’, Elsevier Science Ltd.
66. Lin Wang, Xinzi Tang & Xiongwei Liu 2012, ‘Blade Design
Optimisation for Fixed-Pitch Fixed-Speed Wind Turbines’,
Journal of ISRN Renewable Energy, vol. 2012, p. 8.
67. Liu Xiong, Chen Yan & Ye Zhiquan 2005, ‘Aerodynamic
Performance Calculation Model of Horizontal Shaft Wind Turbine’, Solar Power Journal, vol. 12, no. 6, pp. 28-32.
68. Lobitz, D, Veers, P & Migliore, PG 1996, ‘Enhanced performance of HAWTs using adaptive blades’, in
Proceedings of 1996, ASME Wind Energy Symposium,, (Houston, TX), pp. 41–45.
69. Lyon, CA, Broeren, AP, Gigure, P, Gopalarathnam, A &
Selig, MS, 1998, ‘Summary of Low-speed Airfoil Data’,
SoarTech Publications, Virginia Beach, VA, vol. 3.
70. Mann, J 1998, ‘Wind _eld simulation’, Probabilistic
Engineering Mechanics, vol. 13, no. 4, pp. 269-282.
71. Mantz, RJ, Christiansen, CF & Bianchi, FD 2004, ‘Power
regulation in pitch controlled variable speed WECS above
rated wind speed’, Renewable Energy, pp. 1911-1922.
72. Manwell, JF, McGowan, JG & Rogers, AL 2009, ‘Wind
energy explained: theory, design and application’, 2nd ed.
Amherst, USA: John Wiley & Sons.
73. McGranahan, BD & Selig, MS 2004, ‘Wind tunnel
aerodynamic tests of six airfoils for use on small wind
turbines’, Colorado: National Renewable Energy Laboratory.
74. McKittrick, LR, Cairns, DS, Mandell, J, Combs, DC, Rabern, DA & Van Luchene,̌RD 2001, ‘Analysis of a Composite Blade Design for the AOC 15/50 Wind Turbine Using a Finte
Multiscience Publishing.
77. Min-Soo Jeong, Seung-Jae Yoo & In Lee 2011, ‘Aeroelastic Analysis for Large Wind Turbine Rotor Blades’, American
Institute of Aeronautics and Astronautics, pp. 1- 7.
78. Mohamed, MH 2012, ‘Performance investigation of
Hrotor darrieus turbine with new airfoil shapes’, Energy, vol.
47, no. 1, pp. 522e530.
79. Mohamed, MH 2013, ‘Impacts of solidity and hybrid system in small wind turbines performance’, Energy, vol. 57,
pp. 495e504.
80. Mohamed, MH, Ali, AM & Hafiz, AA 2014, ‘CFD analysis for H-rotor Darrieus turbine as a low speed wind energy
converter’, Engineering Science and Technology, an
International Journal, vol. 30, pp. 1- 13
81. Monroy Aceves, C, Sutcliffe, MPF, Ashby, MF, Skordos, AA
& Rodríguez Román, C 2012, ‘Design methodology for composite structures: A small low air-speed wind turbine
blade case study’, Journal of Materials and Design, vol. 36, pp.
296- 305.
82. Moriarty, PJ & Hansen, C 2005, ‘AeroDyn Theory Manual’,
National Renewable Energy Laboratory NREL, vol. 15, p. 50036313.
83. Myat Myat Soe 2008, ‘Design and manufacturing of Wind Turbine Blade’, GMSARN International conference on
Sustainable Development: Issues and Prospects for the GMS, 12-14 nov 2008.
84. NREL 2008, ‘Development of Operations and
Maintenance Cost Model to Identify Cost of Energy Savings
for Low Wind Speed Turbines’, National Renewable Energy Laboratory,[online]at:
http://www.nrel.gov/docs/fy08osti/40581.pdf.
85. Okulov, V & Sørensen, JN 2008, ‘Refined Betz limit for rotors with a finite number of blades’, Wind Energy, vol. 11,
pp. 415–426.
86. Ole Thybo Thomsen 2009, ‘Sandwich Materials for Wind
Turbine Blades –Present and Future’, Journal of Sandwich
© 2019, IRJET | Impact Factor value: 7.211 | ISO 9001:2008 Certified Journal
| Page 699
87. Orosa, JA, García-Bustelo, EJ & Oliveira, AC 2012, ‘AnExperimental Test of Low Speed Wind Turbine Concentrators", Journal of Energy Sources, Part A, vol. 34, pp. 1222-1230.
88. Ozgener, O 2006, ‘A small wind turbine system (SWTS)
application and its performance analysis’, Energy Conversion
and Management, vol. 47, no. 11, pp. 1326-1337.
89. Param Pal Singh Chhabra & Ranjan Ganguli 2010, ‘Super
convergent Finite Element for Coupled Torsional Flexural-Axial Vibration Analysis of Rotating Blades’, International
Journal for Computational Methods in Engineering Science and Mechanics, vol. 11, no. 1, pp.48-69.
90. Peacock, AD, Jenkins, D, Ahadzi, M, Berry, A & Turan, S
2008, ‘Micro wind turbines in theUK domestic sector, energy and buildings’, Renewable Energy, vol. 40, pp. 1324-1333.
91. Pinilla & Álvaro, YA 2006, ‘Gómez Aerodynamic Characteristics of airfoils with Blunt Trailing Edge’,
Alemania: Universidad de Hannover.
92. Pourrajabian, A, Mirzaei, M, Ebrahimi, R & Wood, D 2014,
‘Effect of air density on the performance of a small wind
turbine blade: a case study in Iran’, J. Wind Eng. Ind.
Aerodynamics, vol. 126, pp. 1-10.
93. Preetham Kumar, DSP & Iniyan, S 2013, ‘Design,
Development and testing of a 1kW wind turbine system, 2013 International Conference on Green Computing’,
Communication and Conservation of Energy (ICGCE), 978-1-4673-6126-2/13/2013 IEEE.
94. Ryo Amano, Ilya Avdeev, Ryan Malloy and Mir Zunaid
Shams 2013, ‘Power, structural and noise performance tests
on different wind turbine rotor blade designs’, International
Journal of Sustainable Energy, vol. 32, no. 2, pp. 78-95.
95. Sedaghat, A, Haj Assad, ME & Gaith, M 2014,
‘Aerodynamics performance of continuously variable speed
horizontal axis wind turbine with optimal blades’, Energy,
vol. 77, pp. 752–759.
96. Singh, RK, Ahmed, MR, Zullah, MA & Lee, YH 2012,
‘Design and testing of a low Reynolds number airfoil for small horizontal axis wind turbines’, Renewable Energy, vol.
42, pp. 66-76.
97. Sørensen, JN & van Kuik, GAM 2011, ‘General momentum theory for wind turbines at low tip speed ratios’, Wind
Energy, vol. 14, pp. 821–839.
98. Sørensen, JN 2016, ‘General momentum theory for horizontal axis wind turbines’, Springer-Verlag London, [ISBN: 978-3-319-22113-7].
99. Srinivasan, KM 2008, Rotodynamic Pumps.
100. Tangler, JL 1997, ‘Influence of Pitch, Twist, and Taper on a Blade’s Performance Loss due to Roughness’, Journal of
Solar Energy Engineering, vol. 1, 19, August 1997.
101. Thumthae, C & Chitsomboon, T 2009, ‘Optimal angle of
attack for untwisted blade wind turbine’, Renewable Energy,
vol. 34, no. 5, pp. 1279-1284.
102. Urja, A 2013, ‘Ministry of New and Renewable Energy, Government of India’, New Delhi, vol. 7, no. 1.
103. Wang, 2007, ‘The methodology for aerodynamic study
on a small domestic wind turbine with scoop’, Journal of
wind energy and industrial aerodynamics.
104. Weifei Hua, Dohyun Parkb & Dong Hoon Choi 2013,
‘Structural optimization procedure of a composite wind
turbine blade for reducing both material cost and blade
weight’, Journal of Engineering Optimization, vol. 45, no. 12,
pp. 1469-1487.
105. Wilson, RE 2009, ‘Aerodynamic behavior of wind turbines. In: Spera DA, editor. Wind turbine technology’, New
York, USA: ASME Press.
106. Wood, DH 2001, ‘On the blade element estimation of the cut-in wind speed of the small turbine’, Wind Eng., vol. 25,
no. 4, pp. 249-255.
107. Wood, DH 2011, ‘Small Wind Turbines: Analysis, Design, and Application’, Green Energy and Technology, Springer -Verlag, London.
108. Wood, DH, Okulov, VL & Bhattacharjee, D 2016, ‘Direct calculation of wind turbine tip loss’, Renew Energy, vol. 95,
pp. 269–276.
109. Wright, AK & Wood, DH 2004, ‘The starting and low wind speed behavior of a small horizontal axis wind turbine’,
Journal of Wind Engineering and Industrial Aerodynamics, vol. 92, no. 14, pp. 1265-1279.
110. Wright, AK & Wood, H 2004, ‘On the starting and low wind speed behaviour of a small horizontal wind turbine’,
Journal on Wind Engineering and Industrial Aerodynamics, vol. 92, pp. 1265-1279.
111. Xu, F, Yuan, FG, Liu, L, Hu, J & Qiu, Y 2013, ‘Performance
prediction and demonstration of a miniature horizontal axis
wind turbine’, Journal of Energy Engineering, vol. 139, no. 3,
pp. 143-152.
112. Yang, H, Shen, W, Xu, H, Hong, Z & Liu, C 2014,
‘Prediction of the wind turbine performance by using BEM with airfoil data extracted from CFD’, Renewable Energy, vol.
70, pp. 107–115.
113. Yuan Xin & Jiang Xuezhong 1999, ‘Numerical Simulation
© 2019, IRJET | Impact Factor value: 7.211 | ISO 9001:2008 Certified Journal
| Page 700
Procedia, vol. 24, pp. 194-201.116. Douvi C. Eleni, Tsavalos I. Athanasios & Margaris P
2012, ‘Evaluation of the Turbulance models for the Simulation of the flow over a National Advisory Committee
of Aeronautics(NACA) 0012 airfoil’, Journal of Mechanical
Engineering Research, vol. 4, pp. 100-111.
117. Pedro Bañuelos-Sánchez, Andrés Valle-Rodríguez, J. Mariano Fernández-Nava, Rubén Alejos-Palomares, & José Luis Vázquez-González 2011, ‘low powerlow cost horizontal
axis wind turbine for 350Watt application, International Conference on Electrical Communications and Computer.
118. Chalothorn Thumthae & Tawit Chitsomboon 2006,
‘Optimal angle of attack for untwisted blade wind turbine, the numerical simulation of horizontal axis wind turbines (HAWTs) with untwisted blade, International Conference on Sustainable Energy and Environmen.
119. Sikandar Khan, Afzal Khan, Muhammad Irfan, & Shah Hussain 2012, ‘The aerodynamic analysis and dynamic modelling of small horizontal axis wind turbine’,
International Conference on Robotics and Artificial Intelligence.
120. Wenlei Sun, YuFeng Wei & Shaogang Luan 2010, ‘Design
and research of large scale wind turbine blades automatic
generation system ’, International Conference on Advanced
Computer theory and Engineering.
121. Karna SP, Saumil BP, Utsav, BP & Ankit Ahuja 2014,
‘CFD Analysis of an Airfoil’, International Journal of