© 2019, IRJET | Impact Factor value: 7.211 | ISO 9001:2008 Certified Journal | Page 1926
PERFORMANCE EVALUATION OF E-WASTE IN BITUMEN ROAD
CONSTRUCTION
Bharani Deepan
1, Belmer
2, Aravind
3, Anilan Kumar
4, Divya
51,2,3,4
Student, Dept. of Civil Engineering, Valliammai Engineering College, Tamil Nadu, India
5Proffessor, Dept. of Civil Engineering, Valliammai Engineering College, Tamil Nadu, India
---***---Abstract -
Due to the increase in the demand of raw materials in the construction industry, there has been a serious depletion in the naturally available raw material in the construction industry. In this regards, the non biodegradable environmentally hazardous electronic and electrical waste arising from various industrial and domestic appliances was considered as an alternative raw material for the present research. The current study not only offers a solution to the ongoing crisis in effective safe disposal of E-wastes, but also resolves the issue of demand of raw materials. The present study targeted effective utilization of E-waste as a potential aggregate in Bituminous Concrete Mix. The research investigated the probable changes in physical and strength properties of the mixes casted using Marshall Method of Mix design and the conclusions were later drawn depending on the comparative result analysis for the optimum percentage replacement of aggregate by E-waste.Key Words: – Replacement, E-waste, Eco-friendly disposal, Reduced cost for construction
1. INTRODUCTION
The development of technology is at amazing rate, today the development in the field of electronics is huge and notable in spite of its notability there is a huge dangerous and controversial thing behind their usage due to the use of large electronic components in day-to-day life, its waste also increases. So, we are in need of new arena to find best system for e-waste management.
One such system is “An effective management of e-waste as a part of construction materials” which is surely going to be the biggest revolution in the management of e-waste. The overall idea is mixing the e-waste in the construction practice as replacement for coarse aggregate and thereby reducing the waste in a greater way. Once it is successful it is going to be greatest boon in the management of e-waste. The production of electric and electronic equipment is the fastest growing manufacturing activities.
The development has results in an increase of waste electric and electronic equipment, rapid economic growth, coupled with urbanization growing demand of consumer goods, has increased both the consumption of electronic wastes which can be the sources of the hazardous wastes
that pose a risk to the environment and to sustainable economic growth.
2. OBJECTIVES
1. To study the physical properties of bitumen and coarse aggregate by conducting various laboratory tests.
2. To design the mix by partial replacement of e-waste as a coarse aggregate.
3. To evaluate the strength criteria for the design mix by Marshall stability test.
4. To arrive at the optimum percentage replacement of e-waste in the design mix.
3. METHODOLOGY
3.1 Material selection
3.1.1 Laboratory tests and results for physical properties of bitumen
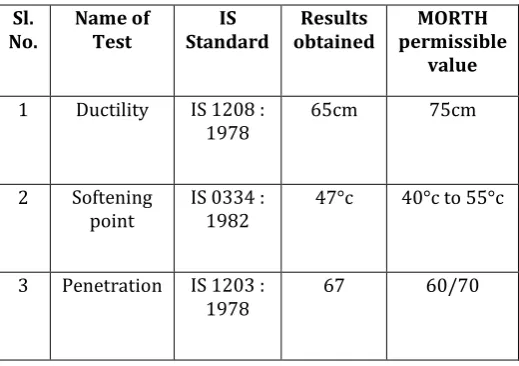
[image:1.595.305.565.518.701.2]In this study 60/70-penetration grade bitumen was used as binder as it is widely used in testing.
Table 1 Physical properties of bitumen
Sl.
No. Name of Test Standard IS obtained Results permissible MORTH value
1 Ductility IS 1208 :
1978 65cm 75cm
2 Softening
point IS 0334 : 1982 47°c 40°c to 55°c
3 Penetration IS 1203 :
© 2019, IRJET | Impact Factor value: 7.211 | ISO 9001:2008 Certified Journal | Page 1927
3.1.2 Laboratory tests and results for physicalproperties of aggregate
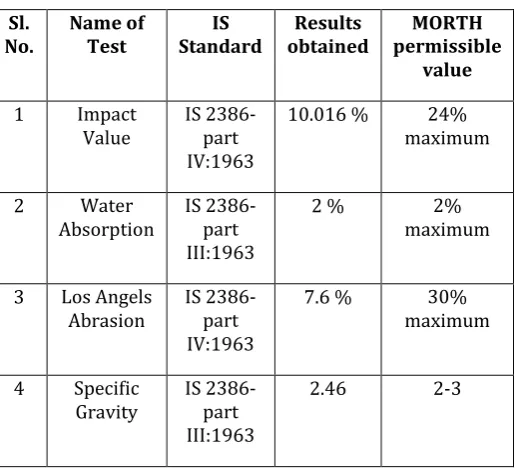
[image:2.595.35.293.189.423.2]The aggregates conforming to IS: 2386 – 1963, were chosen and possessed physical properties within range decided by MORTH-2001.
Table 2 Physical properties of aggregate
Sl.
No. Name of Test Standard IS obtained Results permissible MORTH value
1 Impact
Value IS 2386-part IV:1963
10.016 % 24% maximum
2 Water
Absorption IS 2386-part III:1963
2 % 2%
maximum
3 Los Angels
Abrasion IS 2386-part IV:1963
7.6 % 30%
maximum
4 Specific
Gravity IS 2386-part III:1963
2.46 2-3
3.2 Proportioning of aggregate
The mix design was decided on the basis of sieve analysis and required amount of aggregates shoul e oven rie for hours at a out c temperature Oven-dried aggregates are then weighed as per blending percentage and transferred to the mixing pan.
Table 3 Gradation of Aggregate
Size of aggregate Weight of aggregate
12.5 mm 72 g
10 mm 312 g
4.75 mm 84 g
2.36 mm 204 g
Pan 480 g
Fig 1 Sieved Aggregate
3.3 Preparation of specimen
There are two types of specimen are to be prepared, they are control mix and modified mix.
3.3.1 Control mix
Coarse aggregate, fine aggregate and filler material should be proportioned so as to fulfill the requirements of the relevant standards. The required quantity of the mix is taken to produce compacted mix specimens of thickness 63.5 mm approximately. 1200 g of coarse aggregates, fine aggregates and filler are require to pro uce the esire thickness The aggregates are heate to the temperature of c The itumen is heate to the temperature of c an the required amount of first trial of bitumen is added to the heated aggregate and thoroughly mixed. The mix is placed in a mould and compacted with 75 number of blows on both sides. The sample is taken out after 24 hours using sample extractor.
There are 4 specimens are prepared with different amount of bitumen content. The bitumen is added to the aggregate by percent of total weight of aggregate. Specimens with bitumen content of 4.5%, 5%, 5.5% and 6% of total weight of aggregate are prepared.
3.3.2 Modified mix
1200 g of aggregates and fillers with e-waste are required to produce the desired thickness of mm -waste is a e to the mix y replacement of aggregate y total volume itumen is a e to the aggregate y percent of total weight an mix thoroughly at c temperature After mixing thoroughly the mix is placed in a mould and compacted with 75 number of blows on both sides. The sample is taken out after 24 hours using sample extractor.
[image:2.595.392.476.619.688.2]There are 12 specimens are prepared with different bitumen content and e-waste. The bitumen is added to the aggregate by percent of total weight of aggregate whereas the e-waste is added to the aggregate by percent of total volume of aggregate. The specimens are prepared by bitumen with 4.5%, 5%, 5.5% and 6% along with 5%, 10% and 15% replacement of e-waste for aggregate by volume.
Fig 2 Prepared Specimen
3.4 Curing specimen in water bath
© 2019, IRJET | Impact Factor value: 7.211 | ISO 9001:2008 Certified Journal | Page 1928
con ition for ituminous mix is achieve y keeping anmaintaining c temperature in water ath
3.5 Testing in Marshall apparatus
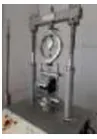
[image:3.595.316.559.54.239.2]The sample is then placed in Marshall testing machine. The stability is measured in terms of strength and resistance to plastic deformation of cylindrical specimen is measured in mm on dial gauge when it loaded at rate of 5 cm per minute. The total maximum load in kN (that cause failure of the specimen) is taken as Marshall Stability Value. Flow value is the total amount of deformation is units of 0.25 mm (that occurs at maximum load).
Fig 3 Marshall Testing Machine
4. RESULTS AND CALCULATIONS
On the basis of Marshall Stability and Flow value the suitability of mix for paving is decided, but some other parameters like bulk density, percent air voids and voids in mineral aggregates are important to take in to consideration for durability criteria. Therefore proper record of data is required during testing of sample.
4.1 Marshall Stability value
[image:3.595.136.185.250.320.2]Among the various specimens, the maximum stability will be considered as optimum proportioning of e-waste and bitumen content.
Table 4 Marshall stability value in kN
4.5%
bitumen bitumen 5% bitumen 5.5% bitumen 6%
Control
mix 17.11 18.98 19.89 18.41
5%
e-waste 16.96 20.51 20.11 17.41
10%
e-waste 17.81 21.32 22.41 18.20
15%
e-waste 17.88 19.8 20.14 16.20
Fig 4 Stability Vs Bitumen Content
By using result obtained, the graph of bitumen content verses stability is plotted as shown in fig.4.1. The bitumen content corresponding to maximum stability is taken as optimum bitumen content. It is presented in graphical form as shown in fig.4.1. From graph it is observed that at 5.5% bitumen content and 10% e-waste maximum stability is achieved. As e-waste content increases stability also increases and later goes on decreasing. It is noted that at 5.5% bitumen content and 10% aggregate replacement by e-waste there is 12.66% increase in strength is achieved.
4.2 Flow value
Table 5 Flow value in mm
4.5%
bitumen bitumen 5% bitumen 5.5% bitumen 6% Control
mix 2.64 3.13 3.38 4.91
5%
e-waste 2.25 3.31 4.40 5.2 10%
e-waste 2.61 3.52 3.42 5.73 15%
e-waste 3.07 4.42 5.35 6.02
[image:3.595.45.562.439.734.2]© 2019, IRJET | Impact Factor value: 7.211 | ISO 9001:2008 Certified Journal | Page 1929
The flexibility or resistance to deformation ismeasured in terms of floe value. The graph of flow with varying bitumen content is plotted as shown in fig.4.2. It is noted that as bitumen content in mix increases the flow value also increases. Similar behavior was obtained here with respect to flow value in case of modified mix with e-waste. From graph it is seen that as percentage od e-waste increases the flow value also increases. The flow values for modified mix are slightly higher than control mix because as percentage of e-waste increases the cohesive property of mix decreases.
4.3 Bulk density
The bulk density is usually determined by weighting the sample in both air and water. It may be necessary to coat samples with paraffin before determining density, and is given by
[image:4.595.45.459.340.701.2]Gm = gm/cc
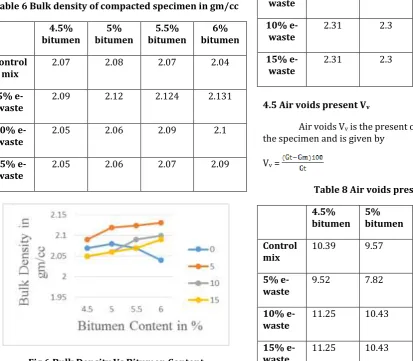
Table 6 Bulk density of compacted specimen in gm/cc
4.5%
bitumen bitumen 5% bitumen 5.5% bitumen 6%
Control
mix 2.07 2.08 2.07 2.04
5%
e-waste 2.09 2.12 2.124 2.131
10%
e-waste 2.05 2.06 2.09 2.1
15%
e-waste 2.05 2.06 2.07 2.09
Fig 6 Bulk Density Vs Bitumen Content
In real practice the bulk density should be as high as possible. For bituminous concrete the bulk density should be 2.0 gm/cc. Here the bulk density obtained for 5.5% bitumen content in control mix is 2.07 gm/cc. After the addition of
e-waste it is observed that as percentage of e-e-waste increases the bulk density goes on increasing. In this research the mix is optimum at 10% e-waste and 5.5% bitumen content. The bulk density of modified mix was increased by 1%.
4.4 Theoretical specific gravity of the mix Gt
Theoretical specific gravity Gt is the specific gravity without considering air voids, and is given by
Gt = ( ) / ( + + + )
Table 7 Theoretical specific gravity of the mix
4.5%
bitumen bitumen 5% bitumen 5.5% bitumen 6%
Control
mix 2.31 2.3 2.386 2.272
5%
e-waste 2.31 2.3 2.386 2.272
10%
e-waste 2.31 2.3 2.386 2.272
15%
e-waste 2.31 2.3 2.386 2.272
4.5 Air voids present Vv
Air voids Vv is the present of air voids by volume in the specimen and is given by
Vv =
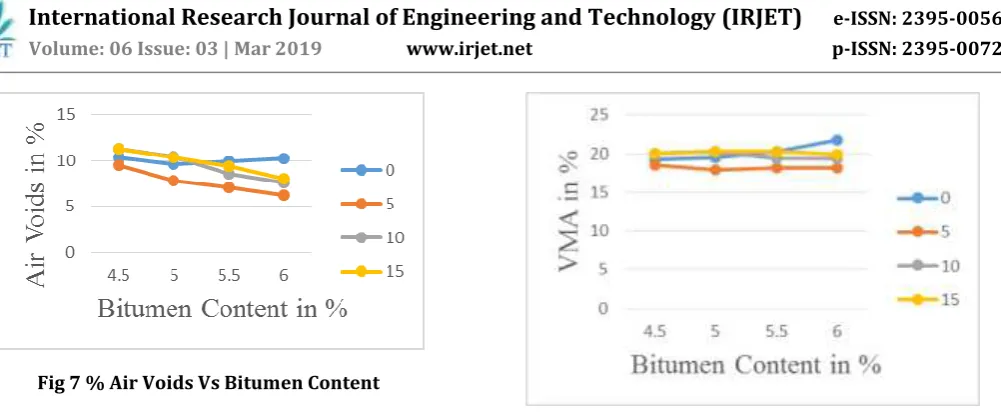
Table 8 Air voids present vv in %
4.5%
bitumen 5% bitumen 5.5% bitumen 6% bitumen
Control
mix 10.39 9.57 9.45 10.21
5%
e-waste 9.52 7.82 7.08 6.21
10%
e-waste 11.25 10.43 8.57 7.57
15%
© 2019, IRJET | Impact Factor value: 7.211 | ISO 9001:2008 Certified Journal | Page 1930
Fig 7 % Air Voids Vs Bitumen Content4.6 Percent volume of bitumen Vb
The volume of bitumen Vb is the percent of volume of bitumen to the total volume and given by:
Vb =( ) / ( )
Table 9 Percent volume of bitumen Vb in %
4.5%
bitumen bitumen 5% bitumen 5.5% bitumen 6% Control
mix 8.91 9.9 10.79 11.54
5%
e-waste 9 10.09 11.12 12 10%
e-waste 8.83 9.81 10.89 11.88 15%
e-waste 8.83 9.81 10.79 11.83
4.7 Voids in mineral aggregate VMA
Voids in mineral aggregate VMA is the volume of voids in the aggregates, and is the sum of air voids and volume of bitumen, and is calculated from
VMA = Vv + Vb
Table 10 Voids in mineral aggregate VMA in %
4.5%
bitumen bitumen 5% bitumen 5.5% bitumen 6% Control
mix 19.3 19.47 20.24 21.75
5%
e-waste 18.52 17.91 18.2 18.21 10%
e-waste 20.08 20.24 19.46 19.45 15%
[image:5.595.302.553.51.258.2]e-waste 20.08 20.24 20.23 19.84
Fig 8 VMA Vs Bitumen Content
In case of percent air voids and percent voids in mineral aggregate the test results vary but perfect zone of satisfaction is achieved. The voids in mineral aggregate are also lies in the permissible limits as per MORTH-2001. The performance of mix for percent air voids and voids in mineral aggregate are as shown in fig.4.4 and fig.4.5.
4.8 Comparison of the performance of control and modified mixtures
In order to compare both the control and modified mixes, 4 samples of the control mix were prepared by using Marshall mixing procedure. The samples were prepared by varying bitumen content of 4.5%, 5%, 5.5% and 6%. The samples were tested and it was found that the maximum stability is achieved at 5.5% bitumen content. Additional 12 samples of the modified mixtures having e-waste were prepared. Samples were subjected to Marshall Stability we get to know that as increase in e-waste increases the stability also up to 10% e-waste at 5.5% bitumen content. The comparison of variation of stability of modified mix and control mix is shown in table 4.10.
Table 11 Comparison of stability
Sl. No. Bitumen content
(%)
5%
e-waste 10% e-waste 15% e-waste
1 4.5 -0.87% 4.09% 4.5%
2 5 8.06% 12.32% 4.32%
3 5.5 1.1% 12.66% 1.25%
4 6 -5.43% -1.14% -12.0%
4.9 Cost benefits and material saving
© 2019, IRJET | Impact Factor value: 7.211 | ISO 9001:2008 Certified Journal | Page 1931
4.9.1 Material savinga) Aggregate: 10% aggregate by total volume can be saved.
10% volume of aggregate = 48.78 cc
48.78 cc of e-waste = 110 g
Therefore 110 g of aggregate can be saved from 1200 g of aggregate.
b) Bitumen: For 10% e-waste content and 5.5% bitumen content = 6.05 g
Percentage saving in bitumen = 9.2%
On an average there is 10% aggregate and 9.2% bitumen saving is achieved.
5. CONCLUSIONS
Aggregate replacement with e-waste can improve the Marshall stability of modified mix. This is an economic option as it results into considerable saving of bitumen and aggregates. The test results shows that at 5.5 percent bitumen content and 10 percent e-waste as replacement attains maximum strength, which is approximately 13 percent more than control mix. The density of modified mix is 1 percent higher than control mix.
The followings are the conclusions regarding the use of e-waste in bituminous concrete:
1. Utilization of e-waste in road construction will be useful for two purposes: firstly it will reduce the cost of construction and secondly it will contribute towards an effective management of e-waste. 2. Experimental results proved that the partial
replacement of aggregates by e-waste is technically feasible; at 10% e-waste and 5.5% bitumen content, which attains 12.66 % higher stability than control mix.
3. The use of e-waste saves bitumen consumption by 9.2% and 10% aggregate by total volume.
4. The bituminous concrete having 10% e-waste was found to be the optimal mix.
REFERENCES
[1] John Prashanth V ‘Shape Analysis of ituminous Mixes with S R’ – 2012.
[2] Poorna Prajna S ‘Marshall Test properties of Bituminous Concrete Mixes Using Fly Ash Modified itumen’ – 2014.
[3] Tapase Anan ‘Utilization of -Waste and Polymer mo ifie itumen in Flexi le pavement’ - 2015
[4] Vikram J Patel ‘An experimental stu y of Bituminous pavement adding wastes to increase the strength economically’-2017
[5] IS 2386: 1963 (part III,IV) – Method of test for aggregate for concrete.
[6] IS 1208: 1978 – Methods for testing tar and bituminous material for ductility value.