© 2019, IRJET | Impact Factor value: 7.211 | ISO 9001:2008 Certified Journal
| Page 2314
Simulation and Performance Estimation of BPSK in Rayleigh channel
using SC, MRC and EGC diversity techniques
Hina Khatoon
1, R.K.Chidar
21
Electronics and Communication Department, University Institute of Technology, Bhopal, India
2Professor, Dept. of Electronics and Communication, University Institute of Technology, Bhopal, India
---***---Abstract -
Several methods of diversity combiningtechniques are used for Rayleigh channel which are evaluated and compared. The methods considered are, for coherent reception, maximal ratio combining (MRC), selection combining (SC), and equal gain combining (EGC).Performance evolution of these methods have been used and results are compared for optimum performance.
Key Words
:
Additive white Gaussian noise (AWGN), fading channels - MRC, EGC, SC, BER, SNR etc.1. INTRODUCTION
When we deal with wireless communication, then propagation channel is our main concern. Signals which are transmitted by the transmitter propagate to the receiver through multipath propagation. The same signal propagating through different paths is called multipath propagation. Due to this multipath propagation each signal goes through different path and each path severe different amount of amplitude and phase fluctuations. Hence the strength of signal weakens down. This is called fading. Fading is the main problem in wireless communication. To combat the effect of the fading diversity technique is used. The multiple copies of same signal are transmitted through the same transmitter and then each copy goes through different multiple path. These are called the diversity branch. Each multiple path serves different amount of fading. At receiver these signals are combined skillfully for combating the effect of fading and get the optimum output. This is called diversity combining. Basically there are three types of diversity combining techniques as selection combining (SC), maximal ratio combining (MRC) and equal gain combining (EGC). SC-type systems, process only one of the diversity branches. In SC, the SC combiner continuously monitors the SNR at each branch and chooses the branch with the highest SNR. In MRC the signal at the output of the receivers is linearly combined so as to maximize the instantaneous signal to noise ratio. This is achieved by combining the co -phased signal. The SNR of the combined signal is equal to the sum of the SNRs of all the branch signals. Maximal ratio combining requires complete knowledge of the gain at each channel branch. Equal gain combining is similar to MRC because the diversity branches are co-phased, but simpler than MRC as the gains are set equal to a constant value of unity [1].
2.
System model
Let be one-sided power spectral density in W/Hz and
is the energy per bit then the instantaneous signal-to-noise
power ratio (SNR) per bit is given by and the
average SNR per bit is given by ̅ . Recall the
instantaneous SNR per bit of the channel (γ) is distributed according to a Rayleigh distribution given by [2]
̅ ( ̅), γ≥0
Where
For the BPSK communication over AWGN channels given the fading amplitude α, the conditional BER can be expressed as
(√ )
In the form of instantaneous signal-to-noise power ratio (SNR) per bit (
(√ )
The average BER is obtained by invoking the Rayleigh distribution, which can expressed as,
∫
Put the value from equation (3.10) we get,
© 2019, IRJET | Impact Factor value: 7.211 | ISO 9001:2008 Certified Journal
| Page 2315
We know by the definition of Q-function
√ ∫ ( )
Put the values of equation
∫
√ ∫
( )
√
̅
( ̅)
√ ̅∫
( ̅)
∫ ( )
√
Upon exchanging the integration order, we obtain
√ ̅∫
( )
∫ ( ̅)
√ ∫
( )
[ ̅]
√ ∫
( )
√ ∫
( ̅ ̅ )
Now we know from theory of calculus,
√ ∫
( )
And
√ ∫
( ̅
̅ ) √ ̅
̅
Then we get,
√ ̅
̅
* √ ̅
̅+
Where is the probability of error of BPSK in Rayleigh channel.
Calculation of probability of error in SC Diversity Technique
SC type systems can process only one of the diversity branches. The Combiner chooses output with the highest SNR that is the output of the SC combiner equal the signal on only one of the branches this is equivalent to choosing the i-th branch with the highest SNR out of total N branches. If the noise power is same on all branches than for N-branch diversity, the instantaneous symbol energy to noise ratio at the output of the SC is given by, [4]
, i=1, 2,...N
Where = the instantaneous signal to noise power ratio (SNR) of i-th branch. Then if denotes the instantaneous SNR of each branch then the average SNR at the diversity combiner output is given as,
̅ ∫
Where denotes the PDF of γ.
We can rewrite the equation in terms of the Moment Generating Function (MGF) associated with γ, namely,
∫
Now taking the derivative of equation with respect to s, (where s is for Laplace domain)
| ̅
In other words, the ability to evaluate the MGF of the instantaneous SNR allows immediate evaluation of the average SNR via a simple mathematical operation differentiation.
© 2019, IRJET | Impact Factor value: 7.211 | ISO 9001:2008 Certified Journal
| Page 2316
then order statistics gives the cumulative distributionfunction (CDF) of is given by [15]
For independent and identical distributed (i.i.d) channel, the PDF of SC is given by,
( )
Rayleigh distribution is commonly used to describe the statistical time varying nature of the received envelope of a flat fading signal, or the envelope of an individual multipath component. The Rayleigh fading distribution has a PDF in terms of received signal that is,
Where is the instantaneous power in i-th branch is mean square signal power per branch.
Then the instantaneous input signal to noise ratio (SNR) of i-th branch is given by
Where is variance at each branch. Then Average input signal to noise ratio of each branch is given by
To get the outage probability of i-th receive antenna
∫
Where is the threshold for signal to noise ratio (SNR).Then the outage probability of i-th receive antenna becomes,
∫
After integrating and putting limits we get the outage probability of i-th receive antenna as,
r N branches is, For N receive antennas which is assumed as independent. Then the outage probability for N braches is
( )
2.1 Calculation for Probability of Error in SC
To calculate the average probability of error at the combiner is computed by integrating the probability of error in AWGN channel over the Rayleigh distribution at the combiner which is given by [4]
∫ (√ )
∫ √ ( )
© 2019, IRJET | Impact Factor value: 7.211 | ISO 9001:2008 Certified Journal
| Page 2317
∑
( ) √
2.2 Calculation for Probability of Error in MRC
To calculate the average probability of error at the combiner is computed by integrating the probability of error in AWGN channel over the Rayleigh distribution at the combiner which is given by [4]
∫ √
∫ √
( )
( ) ∑ ( ) ( )
Where
√
3. Simulation results and discussion
[image:4.595.41.266.270.541.2]Here we are presenting numerical as well as simulated results for SC, MRC and EGC. In computer simulation by using MATLAB we have modeled the received signals by generating Rayleigh and Gaussian Random Variables. Then we have counted the number of bit errors by varying the SNR and number of receivers for the BER estimation and then plot the graph between the SNR in db and the BER.
[image:4.595.326.546.322.482.2]Figure 1: BER for BPSK in Rayleigh channel with SC for No. of receiver 1 and 2
Figure 2: SNR in provement for BPSK in Rayleigh channel with Selection diversity
[image:4.595.319.545.532.710.2]© 2019, IRJET | Impact Factor value: 7.211 | ISO 9001:2008 Certified Journal
| Page 2318
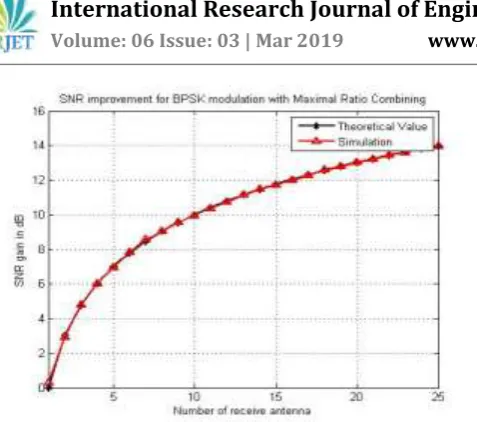
Figure 4: SNR improvement for BPSK in Rayleigh channel [image:5.595.317.553.62.261.2]with MRC Diversity technique
Figure 5: Comparison of SNR improvement for BPSK in Rayleigh channel with SC and MRC Diversity technique
[image:5.595.47.283.319.492.2]Figure 6: BER for BPSK in Rayleigh channel with EGC for No. of receiver 1 and 2
Figure 7: Comparison of BER for BPSK in Rayleigh channel with SC, MRC and EGC Diversity for No. of receiver=4
[image:5.595.49.273.544.713.2]© 2019, IRJET | Impact Factor value: 7.211 | ISO 9001:2008 Certified Journal
| Page 2319
receiver 1 is 32db and for no. of receiver 2 is 16db.It isclear that from our result that EGC has much better performance than SC .It is clear that theoretical and simulated values of BER for BPSK in Rayleigh channel with EGC are approximately same. When the number of receiver is 2 then less SNR is required to transmit the signal at particular BER .Figure 7 shows comparison of BER for BPSK in Rayleigh channel with SC, MRC and EGC Diversity for No. of receiver=4. From Figure 7, to obtain the BER of order the SNR required (when no. of receivers are 4) is 13db for SC, 11 db for EGC and 10 db for MRC in Rayleigh channel. It is clear in Rayleigh channel the performance of BPSK with MRC is better than both EGC and SC. However in Rayleigh channel the performance of BPSK with EGC is slightly better than SC.
4. CONCLUSION
In this paper, we simulated the BPSK in Rayleigh fading channel with SC, MRC, and an EGC and calculated the BER. Performance of MRC is much better than both the SC and EGC. It is clear when number of receiver is less then performance of EGC is same as SC, but when number of receiver is large then performance of EGC is better than SC.
5. REFERENCES
1. T. S. Rapport, Wireless Communication: Principles and Practice, 2nd ed., Pearson Education.
2. J.G. Proakis, Digital Communication, 4th ed. New York:
McGraw-Hill,2001
3. Y. G. Kim and N. C. Beaulieu, “ S+N Energy Selection Combining For MPSK and 16-QAM Signaling in Nakagami-m and Rician Fading Channels” IEEE Trans. Comm. Vol. 59, No. 2, Feb. 11.
4. M. K. Simon and M. S. Alouini, Digital Communication over Fading Channels: A Unified Approach to Performance Analysis, 2nd ed. New York: Wiley, 2005.
5. Win M. Z. and Chrisikos, G., “MRC Performance for M-ary Modulation in Arbitrarily Correlated Nakagami Fading Channels”, IEEE Comm. Letters, (2000).
6. Du, Z., Cheng, J. and Beaulieu, N. C., “Error Rate of OFDM Signals on Frequency Selective Nakagami-m Fading Channel”, IEEE Comm. Society Globecom : ,3994-3998(2004).
7. Y. S. Cho, J. Kim, W. Y. Yang and C. G. Kang, ”MIMO-OFDM Wireless Communication with MATLAB”,IEEE Press and John Wiley & Sons(Asia) Pte Ltd.
8. Y. G. Kim and N. C. Beaulieu, “ S+N Energy Selection Combining For BPSK Signaling in Rayleigh Fading Channels”, IEEE Trans. Comm. Vol. 58, No. 1, Jan. 10.
9. Z. Luo and F. Hu, “Simulation Models for Independent Rayleigh Fading Channels”, IEEE Mobile Congress(GMC),2010 Global: ISBN-978-1-4244-9003-5.
10. E. A. Neasmith and N. C. Beaulieu, “ New Results on Selection Diversity” IEEE Trans. Comm. Vol. 46, No. 5, May. 1998.