warwick.ac.uk/lib-publications
Original citation:
Fairbrother, J. and Leeke, M. (2017) On basis sets variables for efficient error detection. In:
15th IEEE International Conference on Dependable, Autonomic and Secure Computing
(DASC'17), Florida, USA, 6-11 Nov 2017
Permanent WRAP URL:
http://wrap.warwick.ac.uk/93580
Copyright and reuse:
The Warwick Research Archive Portal (WRAP) makes this work by researchers of the
University of Warwick available open access under the following conditions. Copyright ©
and all moral rights to the version of the paper presented here belong to the individual
author(s) and/or other copyright owners. To the extent reasonable and practicable the
material made available in WRAP has been checked for eligibility before being made
available.
Copies of full items can be used for personal research or study, educational, or not-for profit
purposes without prior permission or charge. Provided that the authors, title and full
bibliographic details are credited, a hyperlink and/or URL is given for the original metadata
page and the content is not changed in any way.
Publisher’s statement:
© 2017 IEEE. Personal use of this material is permitted. Permission from IEEE must be
obtained for all other uses, in any current or future media, including reprinting
/republishing this material for advertising or promotional purposes, creating new collective
works, for resale or redistribution to servers or lists, or reuse of any copyrighted component
of this work in other works.
A note on versions:
The version presented here may differ from the published version or, version of record, if
you wish to cite this item you are advised to consult the publisher’s version. Please see the
‘permanent WRAP url’ above for details on accessing the published version and note that
access may require a subscription.
On Basis Variables for Efficient Error Detection
Jake Fairbrother and Matthew Leeke Department of Computer Science, University of Warwick, Coventry, UK
E-mail:{j.c.fairbrother, matthew.leeke}@warwick.ac.uk
Abstract—The development of dependable software invariably
entails the design and location of error detection mechanisms. This software artefact type captures predicates over program variables in order to facilitate error detection. To ease the design of detectors, it is important to have (i) knowledge of the set of variables to be included in a predicate and (ii) an understanding of the structure of the predicate. In this paper, we address these problems by relating a previously defined software metric to the variables that feature in efficient error detection predicates. Specifically, based on fault injection analysis of three software systems, we show that error detection predicates based on the 25% most important variables in a software module provide a similar level efficiency to those predicates that are based on all variables and variables with high importance value appear at lower depths in the generated decision tree, thus implying that these variables provide the most information with regard to system failure and, hence, should be protected to provide proper software function. The implication of these results is that, in order to develop efficient error detection predicates, it is sufficient to only have knowledge of a basis set of important variables, simplifying the design of efficient detectors.
Keywords-Error; Detection; Injection; Machine Learning; Metric
I. INTRODUCTION
As modern society has become reliant on software-intensive computer systems, not just for convenience, but to prevent the loss of assets and human life, software dependability has become a concern for all software engineers. A dependable software system must contain two types of artefact, error detection mechanisms (EDMs) and error recovery mechanisms (ERMs) [1]. The purpose of an EDM is to detect the presence of an erroneous software state during the execution of a software system by evaluating a particular error detection predicate. If a software state is found to be erroneous during the execution of a software system, i.e., an error detection predicate is violated, then an EDM is said to have detected an error. Following the detection of an error, an ERM will attempt to restore the software system to a state that does not threaten its proper functioning, i.e., it will attempt to recover from the error. This error detection and recovery process ensures that errors are not allowed to propagate and make recovery more difficult [2]. Examples of EDMs include self checks and parity codes, whilst examples of ERMs include exception handlers and retry mechanisms.
The effectiveness of an EDM depends on two properties: (i) its location in a software system and (ii) the detection predicate it implements [3]. The location of an EDM relates to the program statement that it is protecting, whilst the implemented
detection predicate is a boolean expression defined over a set of program variables. It has been shown that, for some program statements, the associated error detection predicate is non-trivial, with the properties for this non-triviality being accuracy and completeness [4]. Much research has aimed to address the EDM location problem [5], [6]. In contrast, the EDM design problem, especially for practical software systems, has received less attention. Generally software engineers rely on experience or formal specifications to design error detection predicates, resulting in EDMs that may or may not provided the required coverage [7], [8], [9]. To address the EDM design problem, research in [10] provided a machine learning approach for the design of efficient error detection predicates. However, despite the approach yielding efficient EDMs, it is known to be computationally expensive.
In this paper we consider the relationship between two published works with a view to better understanding the design of efficient EDMs. Specifically, work in [11] developed a metric suite to assess the vulnerability of software. This work was the first to address the EDM design problem from a variable-centric perspective. The approach produces a total ordering, known as an importance ranking, on the set of variables in a particular software module, according to the impact that these variables have on the software system as a whole. On the other hand, a machine learning approach for efficient EDM generation was proposed in [10]. This approach uses fault injection data to generate efficient predicates, which are represented as tree structures. It would be beneficial for a software engineer to understand how the importance ranking is reflected in these trees, as this can lead to the development of templates for designing efficient error detection predicates.
A. Contributions
In this paper we make the following specific contributions:
• Analyse the decision trees generated by [10] with respect
to the total ordering obtained using the importance metric proposed in [11].
• Show that program variables with higher importance are
represented at the lower depths of the associated decision trees, implying that efficient error detection predicates should be composed of important variables.
• Evidence that the efficiency of predicates generated using
The overarching contribution of this paper is to demonstrate the correlation between the importance metric proposed in [11] and the error detection predicates from the approach detailed in [10]. The error detection predicates generated can be used in the design of efficient EDMs. Our contributions provide a basis for (i) understanding the structure of efficient error detection, and (ii) developing a template for the design of efficient EDMs. Critically, the results presented in this paper support the notion that a basis set of important variables can capture the correctness of a software system, paving the way for of low cost techniques for EDM design and location.
B. Paper Structure
The remainder of this paper is structured as follows. In Section II we provide a survey recent work relating to the EDM design problem. In Section III we outline the assumed system, fault and data models. In Section IV we provide a brief summary of the importance metric and describe the machine learning approach for analysing its effectiveness. In Section V we detail the experimental setup used to evaluate the importance metric and generate efficient error detection predicates. In Section VI we present and discuss the results of our analysis. Section VII concludes the paper with a summary and a discussion of future work.
II. RELATEDWORK
In this section we provide a brief survey of research relating to the design of EDMs, with a focus on approaches that can be contrasted with the metric suite proposed in [11].
A. Formal Specifications, Heuristics and Experience
It is possible to design error detection predicates based on a formal specification [12], [13] However, it has been shown that many classes of efficient error detection predicates can not easily be designed in this way [9]. It is often the case that experience and heuristics are used in guiding the design and placement of EDMs [7], [14], [15]. In [16] and [17] a concept know as influence, which quantifies error propagation between communicating modules, was proposed to ensure that error propagation could be confined to single processors.
B. Experimental Evaluation
Experimental approaches for the design of EDMs have often focused on evaluating existing EDMs, typically with respect to measures such as coverage and latency [18], [19]. This is typically done with a view to the evaluation informing EDM design. As in the estimation of the importance metric, fault injection is often used to estimate software measures that can be difficult to establish. Fault injection also allows more analytical analyses to be undertaken. For example, in [20] it was shown that such techniques can be used to find optimal combinations of EDMs in hardware. However, when designing EDMs for deployment in software it is generally the case that a proposed EDM will be experimentally evaluated to ensure that experimental measures reach a particular threshold. When all thresholds are met, an EDM can be accepted. Otherwise,
the EDM must be redesigned and evaluated once more. This cycle of evaluation and redesign is repeated until all thresholds for the chosen experimental measures have been met.
C. Static and Dynamic Analysis
One approach to the design of efficient EDMs is the use of static analysis. This approach was used in [21] to automatically derive detection predicates to prevent the propagation of data errors. Static analysis is know to be complete, though it is limited by the potential for false positives. Contrastingly, work in [22] and [23] used dynamic traces of application execution to derive application-specific error detectors. This is not unlike approaches such as [24] and [25], which use machine learning to aid the design of error detection predicates and program invariants respectively. The systematic design of error detection predicates in the context of finite-state software is considered in [3], [4] and [26]. However, the consideration of finite-state software systems limits the practicality of these approaches in the context of practical software systems.
The intention of the importance metric proposed in [11] is to provide a means for the design of error detection predicates using data that is likely to be available during the development of a dependable software system, obviating the need for much of the analysis described above. However, if this intention is to be realised then the capability of the importance metric to identify critical variables must be rigorously validated. In this paper we use the machine learning approach proposed in [10] for this purpose, as this has been shown to yield error detection predicates that have high accuracy and completeness, thus allowing us to determine whether the variables identified by the importance metric feature in those error detection predicates with the highest accuracy and completeness.
III. MODELS
This section details the adopted system, fault and data models, including relevant motivating assumptions.
A. System Model
To evaluate the effectiveness of the importance metric, as it was proposed in [11], we adopt a generic model of modular software systems. A software system S is considered to be
a set of interconnected modules M1. . . Mn. A module Mk
contains a set of non-composite variables Vk and a sequence
of actions Ak1. . . Aki. The variables in Vk have a specific
domain of values. Each action in Ak1. . . Aki may read or
write to a subset of variables in S
kVk.
We assume a software system to be grey box. This means that access to source code is permitted, but knowledge of functionality, implementation details and structure is not, i.e., white box access with black box knowledge. The decision to adopt this grey box view is motivated by the fact that the importance metric is variable centric, which means that white box access is necessary. The adopted system model is commensurate those adopted in [10] and [11].
B. Fault Models
In this paper we assume a transient data value fault model, which occurs when the variables of a software system hold erroneous values. A transient fault model is generally used to model hardware faults in which bit flips occur in memory areas that causes instantaneous changes to values held in memory. A transient data value fault model is often assumed during dependability analysis due to the fact that it can be used to mimic more severe fault models, making it an appropriate base fault model [27].
IV. VARIABLEIMPORTANCE ANDERRORDETECTION
PREDICATEGENERATION
The objective of this paper is to determine whether there is a correlation between the total ordering on the set of variables generated using the importance metric defined in [11] and the efficient detection predicates generated in [10]. The intention of the importance metric is to identify program variables whose correctness, in the sense of holding correct values, is critical to proper software function. In other words, it seeks to identify program variables whose corruption will likely result in a software system failure. Intuitively, if these variables hold correct values then the software will function as intended, which implies that efficient error detection predicates are functions of these important variables. Specifically, following their identification, it would be sensible for the variables identified by the importance metric to be incorporated by the error detection predicates implemented by EDMs. For clarity and completeness we provide a brief overview of the importance metric. The importance metric is composed of two sub-metrics, known as spatial and temporal impact.
A. Spatial Impact
Given a software system whose functionality is logically distributed over a set of distinct modules, the spatial impact
of variable v in module M for a run r, denoted σr
v,M is the
number of modules that get corrupted inr. The spatial impact
of a variable v of moduleM, denotedσv,M, is:
σv,M =max{σv,Mr },∀r (1)
As such,σv,M captures the diameter of the affected area when
variable v in module M is corrupted. A higher σv,M value
is an indication of greater error propagation. Greater error propagation impedes recovery, hence low values are desirable.
B. Temporal Impact
Given a software system whose functionality is logically distributed over a set of distinct modules, the temporal impact
of variable v in module M for a run r, denotedτr
v,M, is the
number of time units over which at least one module remains
corrupted inr. The temporal impact of a variable v of module
M, denotedτv,M, is:
τv,M =max{τv,Mr },∀r (2)
As such, τv,M captures the period that the software system
state remains affected when variable v in module M is
corrupted. A higher τv,M value indicates that a failure is
more likely. This metric captures the duration for which an erroneous state persists, hence low values are desirable.
C. Variable Importance
The importance metric is defined for variablevin moduleM
with variable-specific failure ratef as:
Iv,M =
1 (1−f)2
1
2
σv,M
σmax
+ τv,M
τmax
(3)
Equations 1-3 allow a partial ordering over the variables of a module to be established. The intention of this approach is for this ordering to be used to identify program variables that must be protected to safeguard proper software function. However, despite the characteristics of the importance metric, there is little existing evidence to demonstrate that the variables it identifies are the important variables the approach purports to identify. This paper validates this capability of the importance metric by comparing the variable ordering it generates with the variables captured by efficient error detection predicates for a set of target systems. We now provide an overview of the methodology used in the generation of these efficient error detection predicates.
D. Error Detection Predicate Generation
In [10] it was shown that decision tree induction can be used to generate efficient error detection predicates. These predicates focused on the detection of erroneous software states that led to failures. In this paper, decision tree induction is used as a mechanism for the evaluation of the importance metric, with the ordering generated by the importance metric being analysed with respect to the, independently generated, decision trees / error detection predicates. This validity of this evaluation is ensured by (i) the mutual focus on failure-inducing states, (ii) the independence of the error detection predicate generation mechanism from the importance metric and (iii) the manner in which decision trees are constructed in the generation of error detection predicates. We now provide an overview of machine learning and decision tree induction in the context of error detection predicate generation.
A primary goal for machine learning is to provide actionable knowledge from large collections of data. In the domain of generating predicates for efficient EDMs, data is assumed to
be a single relation consisting of n input attributes. These
attributes define an n-dimensional space, commonly known
as the Instance Space,I, where every point in I is a possible
state of the modelled process. In supervised learning a machine learning algorithm is tasked with learning an approximation,fˆ,
of an unknown function f, referred to as the target function,
given a training data set, T ⊆ I, consisting of the N pairs
hxi, f(xi)i. If the function is discrete then the task is referred
TRUE (148) TRUE (249)
FALSE (126)
FALSE (59)
TRUE (119)
TRUE (49) TRUE (52)
VarOne
VarThree VarTwo
VarSix VarFour
VarFive
VarSix
VarFive
VarSix
VarSeven
VarTwo
VarFour < 43.32 ≥ 43.32
< 42 ≥ 42
> 523 ≤ 523 > -0.99 ≤ -0.99
> 0 ≤ 0 > 1 ≤ 1 > 522 ≤ 522
[image:5.612.56.293.55.234.2]> 0 ≤ 0 > 10 ≤ 10
Fig. 1: Example decision tree generated under C4.5.
system failure or a successful execution. The task of learning a binary function is referred to as concept learning, which is a special case of classification.
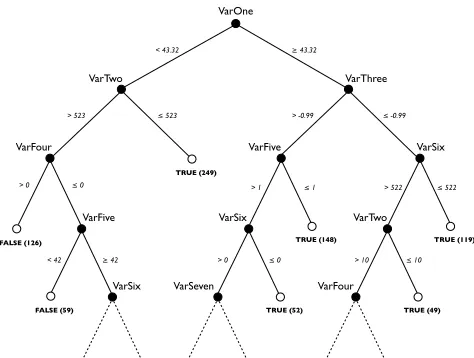
Decision tree induction learns a disjunction of conjunctive rules describing a concept, e.g., application specific failure in the case of learning error detection predicates for failure-inducing states. The decision tree constructed by the algorithm consists of two node types, namely decision nodes and leaf nodes. A decision node contains an input attribute value. Each edge from a decision node is labelled with one of the unique values in the domain of the attribute labelling the decision node. A leaf node is labelled using one of the classification labels. Each path of the tree from the root node to a leaf node is interpreted as a set of conjunctive expressions that lead to the classification label at the associated leaf node. The learning algorithm performs a greedy search of the space of all possible trees choosing decision node attributes that maximise the reduction in entropy of the class label. The C4.5 decision tree induction algorithm was used to learn the decision tree [28]. Figure 1 shows an example of the type of tree generated by the decision tree induction algorithm in the context of generating efficient EDMs. In Figure 1, non-leaf nodes are labelled with variables, edges are labelled with potential variable states and leaf nodes are labelled with a failure classification, where true indicates failure and false indicates non-failure. A predicate is derived by interpreting this structure as a conjunction of disjunctions.
V. EXPERIMENTALSETUP
In this section we describe the experimental setup used to estimate the importance metric and derive error detection predicates. Further details of the error detection predicate generation process can be found in Section VI.
A. Target Systems and Test Cases
The target systems subject to experimentation in this paper are the FlightGear Flight Simulator (FG), Mp3Gain (M3) and 7-Zip (7Z). 7Z is a high-compression archiver capable
of file archiving and encryption [29]. FG is an open source flight simulator [30]. M3 is an open-source volume normalisation software for MP3 files [31]. These target systems were selected based on them being complex, modular and commonly used enough to be representative of practical software systems. All source code for 7Z and M3 are available under the GNU General Public License. All source code for 7Z is available under the GNU Lesser General Public License.
7Z Test Cases: An archiving procedure was executed in all test cases. A set of 25 files were input, each of which was compressed to form an archive and then decompressed in order to recover the original content. The temporal impact of faults was measured with respect to the number of files processed, e.g., if a fault were injected during the processing of file 15 and persisted until the end of a test case, then its temporal impact would be 10. To create a varied system load, the experiments associated with each instrumented variable were repeated for 25 distinct test cases, where each test case involved a distinct set of 25 input files.
FG Test Cases: A takeoff procedure was executed in all test cases. This procedure executed for 2700 iterations of the main simulation loop, where the first 500 iterations correspond to an initialisation period and the remaining 2200 iterations correspond to pre-injection and post-injection periods. A control module was used to provide consistent a consistent input vector at each iteration of the simulation.
MG Test Cases: A volume normalisation procedure was exe-cuted in all test cases. The procedure took a set of 25 mp3 files of varying sizes and normalised the volume across each file. The temporal impact of injected faults was measured with respect to the number of files processed. To create a varied load, the experiments for each instrumented variable were repeated for 3 distinct test cases, where each test case used a distinct set of 25 input files.
B. Instrumentation
Instrumented modules in each target system were chosen randomly from all modules used in the execution of the test cases. All variables in each module were instrumented. To estimate the importance metric, all code locations where an variable could be read were instrumented for fault injection.
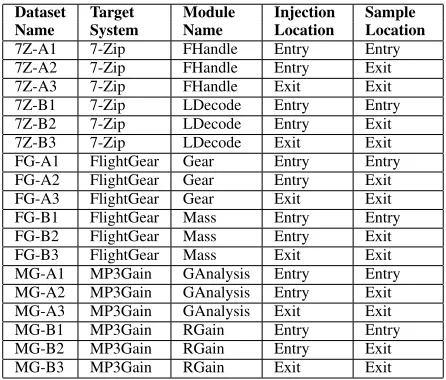
Fault injection data sets relating to the software state at the entry and exit points of each module were compiled in order to generate error detection predicates for the evaluation of importance metric. For this purpose an instrumentation location was a point where a fault could be injected or the software state be sampled within a module. As fault injection had to be performed before software state was sampled, three fault injection data sets were generated for each instrumented module. A description of the fault injection data sets used in this paper can be found in Table I.
TABLE I: Summary of fault injection datasets
Dataset Target Module Injection Sample
Name System Name Location Location
7Z-A1 7-Zip FHandle Entry Entry 7Z-A2 7-Zip FHandle Entry Exit 7Z-A3 7-Zip FHandle Exit Exit 7Z-B1 7-Zip LDecode Entry Entry 7Z-B2 7-Zip LDecode Entry Exit 7Z-B3 7-Zip LDecode Exit Exit FG-A1 FlightGear Gear Entry Entry FG-A2 FlightGear Gear Entry Exit FG-A3 FlightGear Gear Exit Exit FG-B1 FlightGear Mass Entry Entry FG-B2 FlightGear Mass Entry Exit FG-B3 FlightGear Mass Exit Exit MG-A1 MP3Gain GAnalysis Entry Entry MG-A2 MP3Gain GAnalysis Entry Exit MG-A3 MP3Gain GAnalysis Exit Exit MG-B1 MP3Gain RGain Entry Entry MG-B2 MP3Gain RGain Entry Exit MG-B3 MP3Gain RGain Exit Exit
C. Failure Specification
In order to evaluate the importance metric a definition of failure for each target system must be established. This is to allow the failure rate associated with each program variable under fault injection to be determined.
7Z Test Cases: A test case execution was considered a failure if the set of archive files and recovered files were different from those generated by the corresponding golden run.
FG Test Cases: A failure in the execution of a test case fell into at least one of three categories; speed failure, distance failure and angle failure. A run was a speed failure if the aircraft failed to reach a safe takeoff speed after passing through critical speed and velocity of rotation. A run was a distance failure if the takeoff distance exceeds that specified by the aircraft manufacturer, where the distance was increased by 10 meters for every additional 200lbs over aircraft base-weight. A run was an angle failure if a Pitch Rate of 4.5 degrees was exceeded or the aircraft stalled in climb out.
MG Test Cases: A test case execution was considered a failure if the set of normalised output files differed from those generated by the corresponding golden run.
D. Fault Injection
A reproducible fault-free run of each target system for a given test case was created, capturing information about the state of the target system during execution. Bit flip faults were injected at each bit-position for instrumented variables. Each injected run entailed a single bit-flip in a variable at one of these positions, i.e. no multiple injections were performed. For FG each single bit-flip experiment was performed at 3 distinct injection times uniformly distributed across the 2200 simulation loop iterations that follow system initialisation, i.e. 600, 1200 and 1800 control loop iterations after initialisation.
For 7Z and M3, each single bit-flip experiment was performed at 25 distinct injection times uniformly distributed across the 25 time units associated with each test case. The state of all modules used in the execution of all test cases was monitored and recorded during each fault injection experiment. The data logged during fault injection experiments was then compared with the associated reference run, with any deviations being deemed erroneous and contributing to variable importance.
VI. RESULTS
In this section we present the results of our experimentation. We assess the correlation between the importance of a variable and its depth in associated decision trees. We then compare the error detection predicates that can be generated when all variables in a module are considered with those that can be generated when only important variables are considered.
A. Importance and Decision Tree Depths
To asses the effectiveness of the predicates generated, 10-fold cross validation was used in the analysis of each data set. This meant that data set was partitioned into 10 stratified samples. For each cross validation run, one of the partitions was used as the test sample, whilst the other nine were used as the training set. In effect, this meant that 10 predicates were generated for each data set. As there were three data sets compiled for each software module, there were a total of 30 predicates generated for each module.
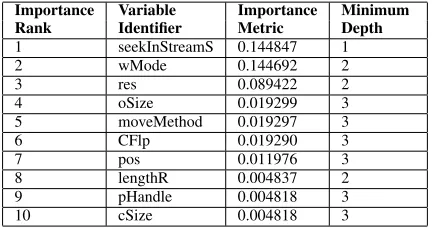
Tables II-VII show the importance rank and values of the ten most important variables for each module. These values were calculated using the approach described in Section IV and the experimental conditions described in Section V. To assess the correlation between the importance of a variable and its depth in a given decision tree, Tables II-VII show the minimum tree depth at which a variable was used to label a decision node in any predicate for a module. The root of a decision tree is assumed to have a depth of 1. The decision was taken to use this as a basis for comparison with the importance rank because decision tree induction selects the variable whose value can be viewed as providing the most information regarding system failure. This is commensurate with the aims of the importance metric.
To appreciate why the minimum decision tree depth is appropriate, as opposed to a measure such as average tree
depth, consider Figure 1. V arT wo is used to label decision
nodes at depths of 2 and 4. In the former case, this allows 249 instances of failure to be discerned using a simple predicate,
i.e., ((V arOne < 43.32)∧(V arT wo ≤ 523)), whilst the
latter allows only 49 instances of failure to be discerned
using a more complex predicate, i.e.,((V arOne≥43.32)∧
(V arT hree≤0.99)∧(V arSix >522)∧(V arT wo≤10)). The selection of a decision node attribute that maximise the reduction in entropy of the class label means that nodes at a lower depth will capture more failure information, hence
the pattern in ourV arT woexample will always be observed.
TABLE II: Importance rank, importance metric values and minimum decision tree depth for 7Z1 variables.
Importance Variable Importance Minimum
Rank Identifier Metric Depth
1 seekInStreamS 0.144847 1
2 wMode 0.144692 2
3 res 0.089422 2
4 oSize 0.019299 3
5 moveMethod 0.019297 3
6 CFlp 0.019290 3
7 pos 0.011976 3
8 lengthR 0.004837 2
9 pHandle 0.004818 3
[image:7.612.326.547.89.204.2]10 cSize 0.004818 3
TABLE III: Importance rank, importance metric values and minimum decision tree depth for 7Z2 variables.
Importance Variable Importance Minimum
Rank Identifier Metric Depth
1 processedPosition 0.009893 1
2 remainLen 0.009865 1
3 distance 0.004867 2
4 posState 0.004859 2
5 ttt 0.004851 2
6 matchByte 0.004843 3
7 probLit 0.004840 3
8 dicPos 0.004839 3
9 range 0.004828 4
10 kMatchLen 0.004826 3
Observe from Tables II-VII that there is a pattern between the importance ranking and the minimum tree depth of the variables in each module. Variables with a higher importance rank generally feature at the lower levels on the decision trees generated during decision tree induction. It is interesting to note the relationship between the value of the importance metric and the minimum decision tree depth observed for the highest ranked variables. For example, the two highest ranked variables in Tables III and V have importance metric values that are notably greater than the other variables in their respective tables. This is mirrored in the minimum decision tree depth, which shows that these variables are the only ones that feature at the root of the decision trees generated for their respective software modules. We observe that those variables in Tables II-VII that do not feature in any error detection
predicate, such as inf anddonein Table VI, have a relatively
low importance. Indeed, every variable with an importance ranking of 1-5 features in an error detection predicate.
B. Efficient Error Detection and Important Variables
The results presented highlight the relationship between the importance rank and the depth at which variables feature in the decision trees forming error detection predicates. The implication is that variables with a higher importance value will feature in efficient error detection predicates. However, this does not imply that EDMs based only on important variables will be efficient. To determine whether efficient
TABLE IV: Importance rank, importance metric values and minimum decision tree depth for FG1 variables.
Importance Variable Importance Minimum
Rank Identifier Metric Depth
1 compressLength 0.730128 1 2 GroundSpeed 0.433243 1 3 SteerAngle 0.053254 1 4 compressSpeed 0.047487 2 5 MaxCompLen 0.033166 2 6 RollingForce 0.012226 2
7 kSpring 0.011150 3
8 DGearU 0.008924 4
9 WheelSlip 0.007813 2
[image:7.612.63.287.256.370.2]10 tForce 0.007436 4
TABLE V: Importance rank, importance metric values and minimum decision tree depth for FG2 variables.
Importance Variable Importance Minimum
Rank Identifier Metric Depth
1 Weight 1.048938 1
2 EmptyWeight 1.048938 1
3 bixx 1.008410 2
4 bixy 1.008410 2
5 bixz 1.008410 2
6 bizz 1.008160 2
7 biyz 1.008160 3
8 biyy 1.007966 2
9 Mass 0.772751 3
10 PmTotalWeight 0.739576 3
EDMs can be constructed using only important variables, we now evaluate a new set of error detection predicates.
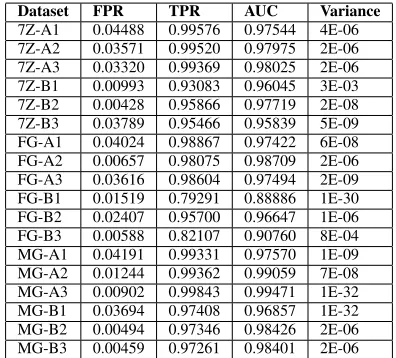
Table VIII shows the evaluation of the predicates generated using all variables in each software module, whilst table Table IX shows the evaluation of the predicates generated using only the most important 25% of the variables in each module. Table VIII relates to the error detection predicates that were previously generated and compared to the ranking established by the importance metric. In Tables VIII and IX the FPR and TPR columns give the mean false positive and true positive rates taken across all 10 cross validations. A false positive here corresponds to the situation where a predicate incorrectly detects a state as being failure-inducing, whilst a true positive corresponds to a predicate correctly identifying a failure-inducing state. The AUC column shows the area under the ROC curve. This measure is based on a plot in two dimensions where each model is a point
defined by the coordinates (1 −specif icity, sensitivity),
where1−specif icity= F P
T N+F P is referred to as the false
positive rate [32]. Under different parameterisations a single classification algorithm will produce multiple points on a plot. The area under the curve (AUC) found by joining these points
at(0,0)and(1,1)is a common measure of expected accuracy.
The AUC column aggregates the performance of the generated predicates with respect to true positive rate and false positive rate. An AUC close to 1 is desirable in the design of error detection predicates, though may not always be achievable due
[image:7.612.328.546.257.373.2]TABLE VI: Importance rank, importance metric values and minimum decision tree depth for MG1 variables.
Importance Variable Importance Minimum
Rank Identifier Metric Depth
1 selfWrite 0.078022 1
2 bitridx 0.076758 1
3 whiChannel 0.076429 2
4 gainA 0.047655 2
5 curFrame 0.047588 2
6 inf 0.009824
-7 cuFile 0.109399 3
8 wrdpntr 0.009807 4
9 inbuffer 0.009804
-10 done 0.009768
-TABLE VII: Importance rank, importance metric values and minimum decision tree depth for MG2 variables.
Importance Variable Importance Minimum
Rank Identifier Metric Depth
1 sampleWin 1.337695 1 2 batchSample 0.988386 1 3 curSamples 0.925374 2
4 first 0.923418 2
5 op 0.639785 3
6 linpre 0.296414
-7 rinpre 0.286144
-8 totsamp 0.285156
-9 cursamples 0.250678 -10 cursamplepos 0.248757
-to theoretical constraints [33]. An AUC of 0.5 is indicative of random performance. The Var column gives the AUC variance in 10-fold cross validation to provide a measure of how detection efficiency varied in cross validation.
[image:8.612.71.278.88.204.2]Observe from Tables VIII and IX that the difference in the performance of the predicates generated using all variables in each module and those generated using only the most important 25% of variables in each module is small. The largest difference in AUC, which is an aggregated measure for false positives and true positives, when comparing these results can be seen in the predicates associated with data set FG-A1. For this data set the predicates generated using all variables have an AUC of 0.99488, whilst those generated using only important variable have an AUC of 0.97422. Observe also that the absolute AUC values for predicates generated using important variables are consistently high, with the maximum and minimum of these values being 0.99471 and 0.88886 respectively. The consistently high AUC values, which are indicative of high true positive and low false positive rates, demonstrate that error detection predicates generated using important variables can safeguard proper software function. The results presented indicate that the importance metric identifies variables whose correctness is central to the proper functioning of software. Comparisons with the decision trees generated suggest that the program variables identified by the importance metric are those that capture the most information with respect to system failure. The evaluation of a further set
TABLE VIII: Evaluation of the error detection predicates generated through decision tree induction using all variables.
Dataset FPR TPR AUC Variance
7Z-A1 0.03884 0.99797 0.97957 3E-08 7Z-A2 0.01696 0.99795 0.99050 1E-08 7Z-A3 0.02099 0.99876 0.98889 1E-08 7Z-B1 0.00052 0.94356 0.97152 3E-04 7Z-B2 0.00000 0.96916 0.98458 1E-09 7Z-B3 0.03554 0.96541 0.96494 9E-10 FG-A1 0.00090 0.99066 0.99488 7E-08 FG-A2 0.00657 0.98075 0.98709 3E-06 FG-A3 0.00618 0.98786 0.99084 3E-06 FG-B1 0.00874 0.79298 0.89212 1E-32 FG-B2 0.01457 0.95842 0.97193 1E-06 FG-B3 0.00429 0.82234 0.90903 6E-08 MG-A1 0.00912 0.99389 0.99239 1E-09 MG-A2 0.00303 0.99384 0.99541 7E-08 MG-A3 0.00853 0.99893 0.99520 1E-32 MG-B1 0.03694 0.97408 0.96857 1E-32 MG-B2 0.00000 0.97405 0.98703 1E-32 MG-B3 0.00000 0.97283 0.98642 1E-30
TABLE IX: Evaluation of the error detection predicates gener-ated through decision tree induction using important variables.
Dataset FPR TPR AUC Variance
7Z-A1 0.04488 0.99576 0.97544 4E-06 7Z-A2 0.03571 0.99520 0.97975 2E-06 7Z-A3 0.03320 0.99369 0.98025 2E-06 7Z-B1 0.00993 0.93083 0.96045 3E-03 7Z-B2 0.00428 0.95866 0.97719 2E-08 7Z-B3 0.03789 0.95466 0.95839 5E-09 FG-A1 0.04024 0.98867 0.97422 6E-08 FG-A2 0.00657 0.98075 0.98709 2E-06 FG-A3 0.03616 0.98604 0.97494 2E-09 FG-B1 0.01519 0.79291 0.88886 1E-30 FG-B2 0.02407 0.95700 0.96647 1E-06 FG-B3 0.00588 0.82107 0.90760 8E-04 MG-A1 0.04191 0.99331 0.97570 1E-09 MG-A2 0.01244 0.99362 0.99059 7E-08 MG-A3 0.00902 0.99843 0.99471 1E-32 MG-B1 0.03694 0.97408 0.96857 1E-32 MG-B2 0.00494 0.97346 0.98426 2E-06 MG-B3 0.00459 0.97261 0.98401 2E-06
of error detection predicates, generated using only sufficiently important variables, demonstrated a negligible difference in efficiency when compared with predicates generated using all variables. This provides a strong indication that the correctness aspect of a software system can be captured by a basis set of program variables.
[image:8.612.70.280.257.371.2] [image:8.612.338.536.323.502.2]constraints prevent more costly forms of software analysis, the importance metric can be used to identify variables that should be captured by error detection predicates.
VII. CONCLUSION
The identification of program variables that must be captured by error detection predicates is a challenge for the design of EDMs. In this paper we demonstrated that the importance metric proposed in [11] can identify variables that must be protected to ensure proper software function. Specifically, the variables identified by error detection predicates generated using the methodology proposed in [10] were compared with those identified by the importance metric in order to demonstrate a correlation. Further, a new set of error detection predicates, based on the variables identified by the importance metric, were generated to show that efficient error detection predicates can be designed using a basis set of important variables. The implication of these results for the design of error detection mechanisms is that efficient error detection predicates can be designed based on variables identified by the importance metric.
VIII. ACKNOWLEDGEMENTS
This work was supported by The Alan Turing Institute under the EPSRC grant EP/N510129/1.
REFERENCES
[1] A. Arora and S. S. Kulkarni, “Detectors and correctors: A theory of fault-tolerance components,” inProceedings of the 18th IEEE Interna-tional Conference on Distributed Computing Systems. Amsterdam, Netherlands: IEEE Computer Society, May 1998, pp. 436–443. [2] A. Arora and M. Gouda, “Distributed reset,” IEEE Transactions on
Computers, vol. 43, no. 9, pp. 1026–1038, September 1994.
[3] A. Jhumka, F. Freiling, C. Fetzer, and N. Suri, “An approach to syn-thesise safe systems,”International Journal of Security and Networks, vol. 1, no. 1, pp. 62–74, September 2006.
[4] A. Arora and S. S. Kulkarni, “Component based design of multitolerant systems,”IEEE Transactions on Software Engineering, vol. 24, no. 1, pp. 63–78, January 1998.
[5] A. Johansson and N. Suri, “Error propagation profiling of operating sys-tems,” inProceedings of the 35th IEEE/IFIP International Conference on Dependable Systems and Networks, June 2005, pp. 86–95. [6] A. Thomas and K. Pattabiraman, “Error detector placement for soft
computation,” in Proceedings of the 43rd IEEE/IFIP International Conference on Dependable Systems and Networks. Budapest, Hungary: IEEE, June 2013, pp. 1–12.
[7] M. Hiller, “Executable assertions for detecting data errors in embedded control systems,” inProceedings of the 30th IEEE/IFIP International Conference on Dependable Systems and Networks. New York, USA: IEEE Computer Society, June 2000, pp. 24–33.
[8] M. Leeke and A. Jhumka, “Evaluating the use of reference run models in fault injection analsyis,” in Proceedings of the 15th Pacific Rim International Symposium on Dependable Computing. Shanghai, China: IEEE, November 2009, pp. 121–124.
[9] N. G. Leveson, S. S. Cha, J. C. Knight, and T. J. Shimeall, “The use of self checks and voting in software error detection: An empirical study,” IEEE Transactions on Software Engineering, vol. 16, no. 4, pp. 432–443, April 1990.
[10] M. Leeke, A. Jhumka, and S. S. Anand, “Towards the design of efficient error detection mechanisms for transient data errors,”The Computer Journal, vol. 56, no. 6, pp. 674–692, June 2013.
[11] M. Leeke and A. Jhumka, “Towards understanding the importance of variables in dependable software,” inProceedings of the 8th European Dependable Computing Conference, April 2010, pp. 85–94.
[12] D. J. Richardson, S. L. Aha, and T. O. O’Malley, “Specification-based test oracles for reactive systems,” inProceedings of the 14th ACM/IEEE International Conference on Software Engineering, July 1992, pp. 105– 118.
[13] P. Stocks and D. Carrington, “A framework for specification based testing,” IEEE Transactions on Software Engineering, vol. 22, no. 11, pp. 777–793, November 1996.
[14] C. Rabejac, J.-P. Blanquart, and J.-P. Queille, “Executable assertions and timed traces for on-line software error detection,” inProceedings of the 26th International Symposium on Fault-Tolerant Computing, June 1996, pp. 138–147.
[15] J. Vinter, J. Aidemark, P. Folkesson, and J. Karlsson, “Reducing critical failures for control algorithms using executable assertions and best effort recovery,” inProceedings of the 31st IEEE/IFIP International Confer-ence on Dependable Systems and Networks. Gothenburg, Sweden: IEEE Computer Society, July 2001, pp. 347–356.
[16] N. Suri, S. Ghosh, and T. Marlowe, “A framework for dependability driven software integration,” in Proceedings of the 18th International Conference on Distributed Computing Systems (ICDCS), May 1998, pp. 406–415.
[17] A. Jhumka, M. Hiller, and N. Suri, “Assessing inter-modular error propagation in distributed software,” inProceedings of the 20th IEEE International Symposium on Reliable Distributed Systems, January 2001, pp. 152–161.
[18] M. Hiller, “Error recovery using forced validity assisted by executable assertions for error detection: An experimental evaluation,” in Proceed-ings of the 25th EUROMICRO Conference, August 1999, pp. 105–112. [19] D. Powell, E. Martins, J. Arlat, and Y. Crouzet, “Estimators for fault tol-erance coverage evaluation,”IEEE Transactions on Computers, vol. 44, no. 2, pp. 261–274, June 1995.
[20] A. Steininger and C. Scherrer, “On finding optimal combinations of error detection mechanisms based on results of fault injection experiments,” inProceedings of the 27th International Symposium on Fault-Tolerant Computing, June 1997, pp. 238–247.
[21] K. Pattabiraman, Z. Kalbarczyk, and R. K. Iyer, “Automated derivation of application-aware error detectors using static analysis: The trusted illiac approach,” IEEE Transactions on Dependable and Secure Com-puting, vol. 8, no. 1, pp. 44–57, January 2011.
[22] K. Pattabiraman, G. P. Saggese, D. Chen, Z. Kalbarczyk, and R. Iyer, “Dynamic derivation of application-specific error detectors and their implementation in hardware,” in Proceedings of the 6th Dependable Computing Conference, October 2006, pp. 97–106.
[23] K. Pattabiraman, G. P. Saggese, D. Chen, Z. Kalbarczyk, and R. K. Iyer, “Automated derivation of application-specific error detectors us-ing dynamic analysis,” IEEE Transactions on Dependable and Secure Computing, vol. 99, pp. 44–57, May 2010.
[24] M. Leeke, S. Arif, A. Jhumka, and S. S. Anand, “A methodology for the generation of efficient error detection mechanisms,” inProceedings of the 41st IEEE/IFIP International Conference on Dependable Systems and Networks, June 2011, pp. 25–36.
[25] M. Ernst, J. Perkins, P. Guo, S. McCamant, C. Pacheco, M. S. Tschantz, and C. Xiao, “The daikon system for dynamic detection of likely invari-ants,”Science of Computer Programming, Special Issue on Experimental Software and Toolkits, vol. 69, no. 3, pp. 35–45, December 2007. [26] S. S. Kulkarni and A. Ebnenasir, “Enhancing the fault-tolerance of
non-masking programs,” inProceedings of the 23rd International Conference on Distributed Computing Systems, May 2003, pp. 441–449.
[27] D. Powell, “Failure model assumptions and assumption coverage,” in Proceedings of the 22nd International Symposium on Fault-Tolerant Computing. Wisconsin, USA: IEEE Computer Society, July 1992, pp. 386–395.
[28] J. R. Quinlan, C4.5: Programs for Machine Learning. Morgan Kaufmann, October 1992.
[29] 7-Zip, “http://www.7-zip.org/,” June 2017. [30] FlightGear, “http://www.flightgear.org/,” June 2017. [31] MP3Gain, “http://mp3gain.sourceforge.net/,” June 2017.
[32] T. Fawcett, “An introduction to roc analysis,” Pattern Recognition Letters, vol. 27, no. 8, pp. 861–874, June 2006.
[33] A. Jhumka and M. Leeke, “Issues on the design of efficient fail-safe fault tolerance,” inProceedings of the 20th IEEE International Symposium on Software Reliability Engineering. Mysuru, India: IEEE Computer Society, November 2009, pp. 155–164.