Optimise Web Browsing on Heterogeneous Mobile
Platforms: A Machine Learning Based Approach
Jie Ren†, Ling Gao†, Hai Wang†, and Zheng Wang‡∗ †Northwest University, China, ‡Lancaster University, UK
Emails:†[email protected],†{gl, hwang}@nwu.edu.cn, ‡[email protected]
Abstract—Web browsing is an activity that billions of mobile users perform on a daily basis. Battery life is a primary concern to many mobile users who often find their phone has died at most inconvenient times. The heterogeneous multi-core architecture is a solution for energy-efficient processing. However, the current mobile web browsers rely on the operating system to exploit the underlying hardware, which has no knowledge of individual web contents and often leads to poor energy efficiency. This paper describes an automatic approach to render mobile web workloads for performance and energy efficiency. It achieves this by developing a machine learning based approach to predict which processor to use to run the web rendering engine and at what frequencies the processors should operate. Our predictor learns offline from a set of training web workloads. The built predictor is then integrated into the browser to predict the optimal processor configuration at runtime, taking into account the web workload characteristics and the optimisation goal: whether it is load time, energy consumption or a trade-off between them. We evaluate our approach on a representative ARM big.LITTLE mobile architecture using the hottest 500 webpages. Our approach achieves 80% of the performance delivered by an ideal predictor. We obtain, on average, 45%, 63.5% and 81% improvement respectively for load time, energy consumption and the energy delay product, when compared to the Linux heterogeneous multi-processing scheduler.
Keywords-Mobile Web Browsing, Energy Optimisation, big.LITTLE, Mobile Workloads
I. INTRODUCTION
Web browsing is a major activity performed by mobile users on a daily basis [1]. However, it remains an activity of high energy consumption [2], [3]. Heterogeneous multi-core design, such as the ARM big.LITTLE architecture [4], is a solution to energy efficient mobile processing. Heterogeneous mobile platforms integrate multiple processor cores on the same system, where each processor is tuned for a certain class of workloads and optimisation goals (either performance or energy consumption). To unlock the potential of the heteroge-neous design, software applications must adapt to the variety of different processors and make good use of the underlying hardware, knowing what type of processors to use and at what frequency the processor should operate. This is because the benefits of choosing the right heterogeneous core may be large, but mistakes can seriously hurt the user experience.
The current mobile web browser implementations rely on the operating system to exploit the heterogeneous cores. The drawback of this is that the operating system has no knowledge of the individual web workload to be rendered by the browser; and as a result, this often leads to poor energy efficiency,
draining the battery faster than necessary [5]. What we would like to have is a technique that can exploit the web workload characteristics to leverage the heterogeneous cores to meet various user requirements: whether it is load time (responsive time), energy consumption or a trade-off between them. Given the diversity of mobile architectures, we would like to have an automatic approach to construct optimisation strategies for any given platforms with little human involvement.
This paper presents such an approach to exploit the hetero-geneous mobile platform for energy efficient web browsing. In particular, it focuses on determining – for a given optimisation goal – the optimal processor configuration i.e. the type of processor cores to use to render the webpage and at what frequencies the processor cores of the system should operate. Rather than developing a hand-crafted approach that requires expert insight into the relative costs of particular hardware and web contents, we develop an automatic technique that can be portable across computing environments. We achieve this by employing machine learning to automatically build predictors based on knowledge extracted from a set of representative, training web contents. The trained models are then used at runtime to predict the optimal processor configuration for a given workload and an optimisation target.
Our technique is implemented as an extension for the Google Chromium browser. It is applied to the hottest 500 webpages ranked by www.alexa.com and is evaluated for three distinct metrics: load time, energy consumption and energy delay product (a trade-off between load time and energy consumption). We evaluated our technique on a representative big.LITTLE mobile platform. Our approach delivers significant improvement over a state-of-the-art web-aware scheduling mechanism [6] and the Linux Heterogeneous Multi-Processing (HMP) scheduler for all the three metrics.
The key contribution of this paper is a novel machine learning based predictive model that can be used to optimise web workloads across multiple optimisation goals. Our re-sults show that significant energy efficiency for mobile web browsing can be achieved by making effective use of the heterogeneous mobile architecture.
II. BACKGROUND A. Web Rendering Process
web content
Parsing Style Resolution Layout Paint Display DOM Tree
Style Rules
Render Tree
Training webpages
Profiling runs
Feature extraction
optimal proc. config.
feature values
L
ea
rn
in
g
A
lg
o
rit
h
m
Predictive Model
Figure 1: The rendering process of Chromium browser.
the Chromium rendering engine follows a number of steps: parsing, style resolution, layout and paint. This process is illustrated in Figure 1. Firstly, the input HTML page is parsed to construct a Document Object Model (DOM) tree where each node of the tree represents an individual HTML tag such as <body> or <p>. CSS style rules that describe how the web contents should be presented will also be translated to the style rules. Next, the styling information and the DOM tree are combined to build a render tree which is then used to compute the layout of each visible element. Finally, the paint process takes in the render tree to output the pixels to the screen. In this work, we focus solely on scheduling the rendering process on heterogeneous mobile systems.
B. Motivation Example
Consider rendering the landing page of
en.wikipedia.org and www.bbc.co.uk on an ARM big.LITTLE mobile platform. The system has a Cortex-A15 (big) and a Cortex-A7 (little) processors, running with the Ubuntu Linux operating system (OS) (see also Section V-A). Here, we schedule the Chromium rendering process to run on the big or little core under various clock frequencies. We then record the best processor configuration found for each webpage. To isolate network and disk overhead, we have pre-downloaded and stored the webpages in the RAM and disabled the browser’s cache.
Figure 2 compares the best configuration against the Linux
HMPscheduler for threelower is bettermetrics: (a) load time, (b) energy consumption and (c) the energy delay product (EDP), calculated as energy×load time. Table I lists the best configuration for each metric. For load time, the best config-uration gives 14% and 10% reduction for wikipedia and
bbcrespectively over theHMP. For energy consumption, using the right processor configuration gives a reduction of 58% and 17% forwikipediaandbbcrespectively. For EDP, the best configuration gives a reduction of over 55% for both websites. Clearly, there is significant room for improvement over the OS scheduler and the best processor configuration could change from one metric to the other.
Figure 2 (d) normalises the best available performance of
[image:2.612.51.299.55.107.2]bbcto the performance achieved by using the best configura-tion found forwikipediafor each metric. It shows that the best processor configuration could also vary across webpages. The optimal configuration for wikipedia fails to deliver the best available performance for bbc. In fact, there is a reduction of 11.9%, 18.9% and 23.5% on load time, energy and EDP available respectively forbbcwhen compared to us-ing the wikipedia-bestconfiguration. Therefore, simply
Table I: Optimal processor configurations for web rendering
Load time Energy EDP
A15 A7 A15 A7 A15 A7
en.wikipedia.org- GHz 1.8 1.4 0.9 0.4 1.3 0.5
www.bbc.co.uk- GHz 1.6 1.4 1.0 0.3 1.5 0.4
rendering engine ! ! !
applying one optimal configuration found for one webpage to another is likely to miss significant optimisation opportunities. This example demonstrates that using the right processor setting has a significant impact on web browsing experience, and the optimal configuration depends on the optimisation objective and the workload. What we need is a technique that automatically determines the best configuration for any webpage and optimisation goal. In the remainder of this paper, we describe such an approach based on machine learning.
III. OVERVIEW OF OUR APPROACH
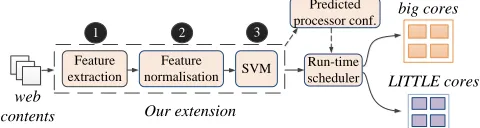
Figure 3 depicts our three-stage approach for predicting the right processor configuration when rendering a webpage. After the web contents (e.g. the HTML source, CSS files and javascripts) are downloaded, they will be parsed to construct a DOM tree together with style rules. This is performed by the default parser of the browser. Our approach begins from extracting information (termed as feature extraction), from the DOM tree and style data to characterise the web workload. This information (or features) includes counting different HTML tags, DOM nodes and style rules. A complete list of the features is given in Table IV. Next, a machine learning based predictor (that is built off-line) takes in these feature values and predicts which core to use to run the rendering engine and at what frequencies the processors of the platform should operate. Finally, we configure the processors and schedule the rendering engine to run on the predicted core. Our approach is implemented as a web browser extension which will be invoked as soon as a DOM tree is constructed. Re-prediction and rescheduling will be triggered if there are significant changes of the DOM tree structure, so that we can adapt to the change of web contents. Note that we let the operating system to schedule other web browser threads such as the input/output process.
Optimisation Goals. In this work we target three important
optimisation metrics: (a) load time (which aims to render the webpage as quick as possible), (b) energy consumption (which aims to use as less energy as possible) and (c) EDP (which aims to balance the load time and energy consumption). For each metric, we construct a predictor using the same learning methodology described in the next section.
IV. PREDICTIVEMODELING
e n . w i k i p e d i a . o r g w w w . b b c . c o . u k 0 . 0
0 . 1 0 . 2 0 . 3 0 . 4 0 . 5 0 . 6 0 . 7 0 . 8
lo
ad
ti
m
e
(s
ec
on
ds
) d e f a u l t b e s t c o n f i g
(a) Load time
e n . w i k i p e d i a . o r g w w w . b b c . c o . u k 0 . 0
0 . 2 0 . 4 0 . 6 0 . 8 1 . 0
d e f a u l t b e s t c o n f i g
En
er
gy
C
on
su
m
pt
io
n
(J
)
(b) Energy consumption
e n . w i k i p e d i a . o r g w w w . b b c . c o . u k 0 . 0
0 . 2 0 . 4 0 . 6 0 . 8 1 . 0 1 . 2 1 . 4 1 . 6
E
D
P
(J
*s
)
d e f a u l t b e s t c o n f i g
(c) EDP
L o a d T i m e E n e r g y E D P
0
5
1 0 1 5 2 0 2 5
P
e
rf
o
rm
a
n
c
e
R
e
d
u
c
ti
o
n
(
%
)
[image:3.612.56.565.63.165.2](d) wikipedia best on bbc.co.uk
Figure 2: Best load time (a), energy consumption (b) and EDP (c) for rendering wikipedia and bbc over to the HMP
scheduler; and the performance of usingwikipediabest configurations w.r.t to the best available performance of bbc(d).
HTML
web contents
Parsing
DOM tree & style rules
Feature Extraction
feature values
Predictor
processor config.
Scheduling
CSS
1
2
3
Figure 3: Our three-stage approach for predicting the best processor configuration and scheduling the rendering process. web
content
Parsing
Style Resolution
Layout
Paint
Display
DOM Tree
Style Rules
Render Tree
Training webpages
Profiling runs Feature extraction
optimal proc. config.
feature values
Le
arn
ing
Alg
orit
hm
Predictive Model
[image:3.612.57.288.379.582.2]Figure 4: Training the predictor.
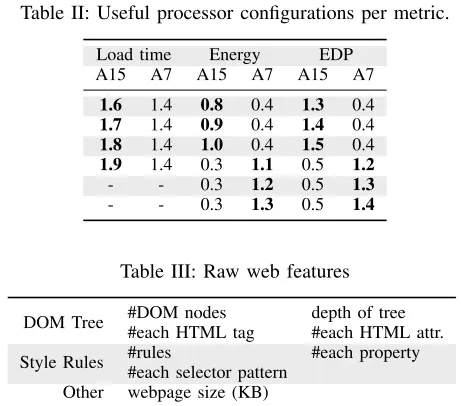
Table II: Useful processor configurations per metric.
Load time Energy EDP
A15 A7 A15 A7 A15 A7
1.6 1.4 0.8 0.4 1.3 0.4
1.7 1.4 0.9 0.4 1.4 0.4
1.8 1.4 1.0 0.4 1.5 0.4
1.9 1.4 0.3 1.1 0.5 1.2
- - 0.3 1.2 0.5 1.3
- - 0.3 1.3 0.5 1.4
Table III: Raw web features
DOM Tree #DOM nodes depth of tree
#each HTML tag #each HTML attr.
#rules #each property
Style Rules
#each selector pattern
Other webpage size (KB)
can model both linear and non-linear problems and the model produced by the learning algorithm is deterministic. The input to our model is a set of features extracted from the DOM tree and style rules. The output of our model is a label that indicates the optimal core to use to run the rendering engine and the clock frequencies of the CPU cores of the system.
Building and using such a model follows the well-known 3-step process for supervised machine learning: (i) generate training data (ii) train a predictive model (iii) use the predictor, described as follows.
A. Training the Predictor
Figure 4 depicts the process of using training webpages to build a SVM classifier for one of the three optimisation met-rics. Training involves finding the best processor configuration and extracting feature values for each training webpage, and learning a model from the training data.
Generate Training Data. We use over 400 webpages to
train a SVM model. These webpages are the landing page of the top 500 hottest websites ranked by alexa[8]. These websites cover a wide variety of areas, including shopping, video, social network, search engine, E-commerce, news etc. Whenever possible, we used the mobile version of the website. Before training, we have pre-downloaded the webpages from the Internet and stored the content in a RAM disk. For each webpage, we exhaustively execute the rendering engine with different processor settings and record the best performing configuration for each optimisation metric. We then label each best-performing configuration with a unique number. Table II lists the processor configurations found to be useful on our hardware platform. For each webpage, we also extract the values of a selected set of features (described in Section IV-B).
Building The Model. The feature values together with the
labelled processor configuration are supplied to a supervised learning algorithm. The learning algorithm tries to find a corre-lation from the feature values to the optimal configuration and outputs a SVM model. Because we target three optimisation metrics in this paper, we have constructed three SVM models – one for each optimisation metric. Since training is only performed once at the factory, it is aone-off cost. In our case the overall training process takes less than a week using two identical hardware platforms.
Table IV: Selected web features
#HTML tag a, b, br, button, div, h1, h2, h3, h4, i, iframe, li,
link, meta, nav, img, noscript, p, script, section, span, style, table, tbody
#HTML attr alt, async, border, charset, class, height,
con-tent, href, media, method, onclick, placeholder, property, rel, role, style, target, type, value, background, cellspacing, width, xmlns, src
#Style selector class, descendant, element, id
#Style rules background.attachment/clip/color/image,
background.repeat.x/y, background.size, back-ground.border.image.repeat/slice/source/width, font.family/size/weight, color, display, float
Other info. DOM tree depth, #DOM nodes, #style rules,
size of the webpage (Kilobytes)
B. Web Features
Our predictor is based on a number of features extracted from the HTML and CSS attributes. We started from 948 raw features that can be collected at runtime from Chromium. Table III lists the raw features considered in this work. These are chosen based on our intuitions of what factors can affect scheduling. For examples, the DOM tree structures (e.g. the number of nodes, depth of the tree, and HTML tags) determine the complexity and layout of the webpage; the style rules determine how elements (e.g. tables and fonts) of the webpage should be rendered; and the larger size of the webpage the longer the rendering time is likely to be.
Feature Selection. To build an accurate predictor using
supervised learning, the training sample size typically needs to be at least one order of magnitude greater than the number of features. Given the size of our training examples (less than 500 webpages), we would like to reduce the number of features to use. We achieve this by removing features that carry little or redundant information. For instances, we have removed features of HTML tags or attributes that are found to have little impact on the rendering time or processor selections. Examples of those tags are <def>, <em> and <body>. We have also constructed a correlation coefficient matrix to quantify the correlation among features to remove similar features. The correlation coefficient takes a value between−1
and 1, the closer the coefficient is to +/−1, the stronger the correlation between the features. We removed features that have a correlation coefficient greater than 0.75 (ignore the sign) to any of the already chosen features. Exemplary similar features include the CSS styles <marginTop> and
<marginRight> which often appear as pairs. Our feature selection process results in 73 features listed in Table IV.
Feature Extraction. To extract features from the DOM
tree, our extension first obtains a reference for each DOM element by traversing the DOM tree and then uses the Chromium API, document.getElementsByID, to col-lect node information. To gather CSS style features, it uses the document.styleSheets API to extract CSS rules, including selector and declaration objects.
Predicted processor conf.
Run-time scheduler
big cores
Our extension web
contents Feature extraction
1
Feature
normalisation SVM LITTLE cores
[image:4.612.50.298.72.217.2]2 3
Figure 5: Runtime prediction and processor configuration.
Feature Normalisation. Before feeding the feature values
to the learning algorithm, we scale the value of each feature to the range of 0 and 1. We also record the min and max values used for scaling, which then can be used to normalise feature values extracted from thenewwebpage during runtime deployment (described in the next sub-section).
C. Runtime Deployment
Once we have built the models as described above, we can use them to predict the best processor configuration for any new,unseenweb contents. The prediction is communicated to a scheduler running as an OS service to move the rendering process to the predicted core and set the processors to the predicted frequencies.
Figure 5 illustrates the process of runtime prediction and task scheduling. During the parsing stage, which takes less than 1% of the total rendering time [9], our extension firstly extracts and normalises the feature values, and uses a SVM classifier to predict the optimal processor configuration for a given optimisation goal. The prediction is then passed to the runtime scheduler to perform task scheduling and hardware configuration. The overhead of extracting features, prediction and configuring processor frequency is small. It is less than 20 ms which is included in our experimental results.
As the DOM tree is constructed incrementally by the parser, it can change throughout the duration of rendering. To make sure our approach can adapt to the change of available information, re-prediction and rescheduling will be triggered if the DOM tree is significantly different from the one used for the last prediction. The difference is calculated by counting the number of DOM nodes between the currently used tree and the newly available one. If the difference is greater than 30%, we will make a new prediction using feature values extracted from the new DOM tree and style rules. We have observed that our initial prediction often remains unchanged, so rescheduling and reconfiguration rarely happen in our experiments.
D. Example
As an example, consider rendering the landing page of
wikipedia for energy consumption. This scenario is most useful when the mobile phone battery is low but the user still wants to retrieve information fromwikipedia. For this example, we have constructed a SVM model for energy using “cross-validation” (see Section V-B) by excluding the webpage from the training example.
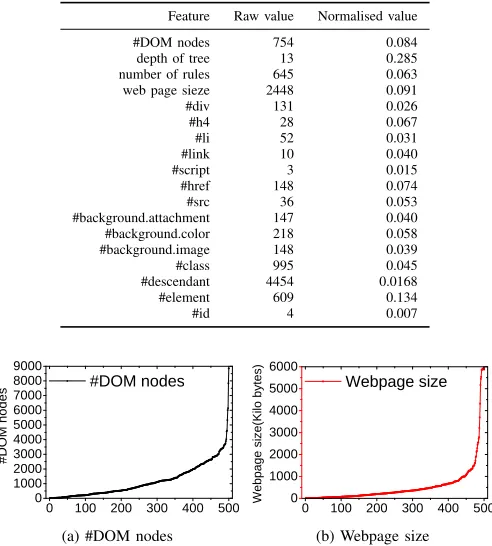
Table V: None-zero feature values foren.wikipedia.org.
Feature Raw value Normalised value
#DOM nodes 754 0.084
depth of tree 13 0.285
number of rules 645 0.063
web page sieze 2448 0.091
#div 131 0.026
#h4 28 0.067
#li 52 0.031
#link 10 0.040
#script 3 0.015
#href 148 0.074
#src 36 0.053
#background.attachment 147 0.040
#background.color 218 0.058
#background.image 148 0.039
#class 995 0.045
#descendant 4454 0.0168
#element 609 0.134
#id 4 0.007
0 1 0 0 2 0 0 3 0 0 4 0 0 5 0 0
0
1 0 0 0 2 0 0 0 3 0 0 0 4 0 0 0 5 0 0 0 6 0 0 0 7 0 0 0 8 0 0 0 9 0 0 0
#
D
O
M
n
o
d
e
s # D O M n o d e s
(a) #DOM nodes
0 1 0 0 2 0 0 3 0 0 4 0 0 5 0 0
0
1 0 0 0 2 0 0 0 3 0 0 0 4 0 0 0 5 0 0 0 6 0 0 0
W
e
b
p
a
g
e
s
iz
e
(K
ilo
b
y
te
s
)
W e b p a g e s i z e
(b) Webpage size
Figure 6: The #DOM nodes (a) and webpage size (b) for the webpages used in the experiments.
The feature values will then be normalised as described in Section IV-B. Table V lists some of the non-zero values for this website, before and after normalisation. These feature values will be fed into the offline-trained SVM model which output a labeled processor configuration (<A15, 0.9, 0.4> in this case) indicating the optimal configuration is running the rendering process on the big core at 900 MHz and the little core should operate at the lowest possible frequency 400 MHz. This prediction is indeed the optimal configuration (see also Section II-B). Finally, the processor configuration is communicated to a runtime scheduler to configure the hardware platform. For this example, our approach is able to reduce 58% of the energy consumption when comparing to the Linux HMPscheduler.
V. EXPERIMENTALSETUP
A. Hardware and Software
Evaluation System. Our hardware evaluation platform is
[image:5.612.52.298.77.350.2]an Odroid XU3 mobile development board with an A15 (big) processor and an A7 (little) processor. The board has 2 GB LPDDR3 RAM and 64 GB eMMC storage. Table VI gives detailed information of the hardware platform. We chose this platform as it is a representative big.LITTLE architecture implementation. For example, the Samsung Galaxy S4 phone uses the same architecture. The board runs the Ubuntu 14.04 LTS Linux OS. We implemented our model as an extension to Chromium (version 48.0) which was compiled using the
Table VI: Hardware platform
big CPU LITTLE CPU GPU
Model Cortex-A15 Cortex-A7 Mali-T628
Core Clock 2.0 GHz 1.4 GHz 533 MHz
Fore Count 4 4 8
gcc compiler (version 4.6). As the current implementation of Google Chromium for Android does not support extensions, we did not evaluate our approach on the Android OS.
Webpages. We used the landing page of the top 500 hottest
websites ranked by www.alexa.com. Whenever possible, we used the mobile version of the website for evaluation. To isolate network and disk overhead, we have downloaded and stored the webpages in a RAM disk. We also disabled the browser’s cache in the experiments. Figure 6 shows the number of DOM nodes and the size for the 500 webpages used in our evaluation. As can be seen from this diagram, the webpages range from small (4 DOM nodes and 40 Kilobytes) to large (over 8,000 DOM nodes and over 5 MB).
B. Evaluation Methodology
Predictive Modelling Evaluation. We use leave-one-out
cross-validation to evaluate our machine learning model. This means we remove the target webpage to be predicted from the training example set and then build a model based on the re-maining webpages. We repeat this procedure for each webpage in turn. It is a standard evaluation methodology, providing an estimate of the generalisation ability of a machine-learning model in predictingunseen data.
Comparisons. We compare our approach to two
alter-native approaches, a state-of-the-art web-aware scheduling mechanism [6] (referred as WS hereafter), and the Linux Heterogeneous Multi-Processing (HMP) scheduler which is designed for the big.LITTLE architecture to enable the use of all different CPU cores at the same time.WSuses a regression model built from the training examples to estimate webpage load time and energy consumption under different processor configurations. The model is used to find the best configuration by enumerating all possible configurations.
Performance Report. We profiled each webpage under a
[image:5.612.54.297.79.352.2]O u r a p p r o a c h W S 0 . 6
0 . 8 1 . 0 1 . 2 1 . 4 1 . 6 1 . 8 2 . 0
L
o
a
d
t
im
e
i
m
p
ro
v
e
m
e
n
t
(a) Load time
O u r a p p r o a c h W S
- 0 . 2 0 . 0 0 . 2 0 . 4 0 . 6 0 . 8 1 . 0
E
n
e
rg
y
r
e
d
u
c
ti
o
n
(b) Energy reduction
O u r a p p r o a c h W S
- 0 . 2 0 . 0 0 . 2 0 . 4 0 . 6 0 . 8 1 . 0
E
D
P
r
e
d
u
c
ti
o
n
[image:6.612.55.541.70.186.2](c) EDP
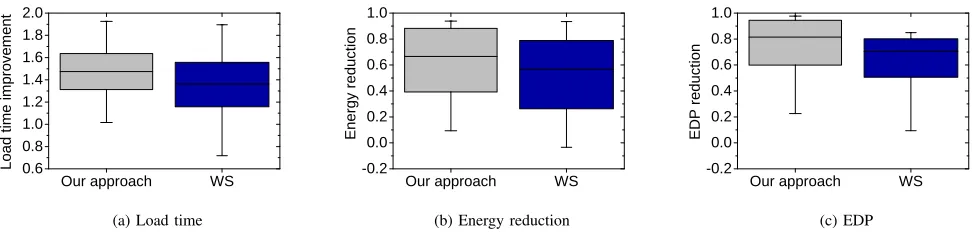
Figure 7: Achieved performance for load time (a), energy consumption (b) and EDP (c) over the LinuxHMP scheduler.
L o a d T i m e E n e r g y E D P
0 % 2 0 % 4 0 % 6 0 % 8 0 % 1 0 0 %
P
e
rf
o
rm
a
n
c
e
t
o
o
ra
c
[image:6.612.73.280.217.341.2]le
Figure 8: Our performance w.r.t. performance of an oracle predictor. We achieve over 80% of the oracle performance.
VI. EXPERIMENTALRESULTS
In this section, we first compare our approach against
WS and the HMP scheduler. We then evaluate our approach against an ideal predictor, showing that our approach delivers over 80% of the oracle performance. Finally, we analyse the working mechanism of our approach.
A. Overall Results
Figure 7 shows the performance results of our approach and
WS for the three evaluation metrics across all websites. For each metric, the performance improvement varies for different webpages. Hence, the min-max bars in this graph show the range of improvement achieved across the webpages we used. The baseline in the diagram is theHMPscheduler.
Load Time. Figure 7 (a) shows the achieved performance
when fast response time is the first priority. For this metric,WS
achieves an averaged speedup of 1.34x but it causes significant slowdown (up to 1.26x) for some websites. By contrast, our approach never leads to deteriorative performance with up to 1.92x speedup. Overall, our approach outperformsWSwith an average speedup of 1.45x vs 1.34x over the HMP scheduler, and has constantly better performance across websites.
Energy Consumption. Figure 7 (b) compares the achieved
performance when having a long battery life is the first priority. In this scenario, adaptive schemes (WSand our approach) can significantly reduce the energy consumption through dynam-ically adjusting the processor frequency. Here, WS is able to
reduce the energy consumption for most websites. It achieves on average an energy reduction of 57.6% (up to 85%). Once again, our approach outperforms WS with a better averaged reduction of 63.5% (up to 93%). More importantly, our approach uses less energy for all testing websites compared to
HMP, whileWSsometime uses more energy thanHMP. This is largely due to the fact that our approach can better utilise the webpage characteristics to determine the optimal frequencies for CPU cores. In addition, for several webpages,WSestimates the big core gives better energy consumption, which are actual a poor choice.
EDP. Figure 7 (c) shows the achieved performance for min-imizing the EDP value, i.e. to reduce the energy consump-tion without significantly increasing load time. Both adaptive schemes achieve improvement on EDP when compared to
HMP.WSdelivers on average a reduction of 69% (up to 84%), but it fails to deliver improved EDP for some websites. Unlike
WS, our approach gives constantly better EDP performance with a reduction of at least 20%. Overall, we achieve on average 81% reduction (up to 95%) of EDP, which translates to 38% improvement overWSon average.
B. Compare to Oracle
In Figure 8, we compare our scheme to an ideal predictor (oracle) that always gives the optimal processor configuration. This comparison indicates how close our approach is to the theoretically perfect solution. As can be seen from the diagram, our approach achieves 85%, 90% and 88% of the oracle performance for load time, energy consumption and EDP respectively. The performance of our approach can be further improved by using more training webpages together with more useful features to better characterise some of the web workloads to improve the prediction accuracy.
C. Analysis
A1 5
1 .6 G
Hz A
1 5
1 .7 G
Hz A
1 5
1 .8 G
Hz A
1 5
1 .9 G
Hz
0 % 5 % 1 0 % 1 5 % 2 0 % 2 5 % 3 0 % 3 5 % 4 0 % 4 5 % 5 0 %
W
e
b
p
a
g
e
s
F
re
q
u
e
n
c
y
(a) Load time
A1 5
0 .8 G
Hz A
1 5
0 .9 G
Hz A
1 5
1 .0 G
Hz A
7
1 .1 G
Hz A
7
1 .2 G
Hz A
7
1 .3 G
Hz
0 % 5 % 1 0 % 1 5 % 2 0 % 2 5 % 3 0 %
W
e
b
p
a
g
e
s
F
re
q
u
e
n
c
y
(b) Energy consumption
A1 5
1 .3 G
Hz A1 5
1 .4 G
Hz A1 5
1 .5 G
Hz A
7
1 .2 G
Hz A
7
1 .3 G
Hz A
7
1 .4 G
H z
0 % 5 % 1 0 % 1 5 % 2 0 % 2 5 % 3 0 %
W
e
b
p
a
g
e
s
F
re
q
u
e
n
c
y
[image:7.612.55.562.62.191.2](c) EDP
Figure 9: The distribution of the optimal processor configurations for load time (a), energy consumption (b) and EDP (c).
1.8 GHz). We believe this is because for some webpages using a lower frequency can reduce CPU throttling activities [10] (i.e. the OS will greatly clock down the processor frequency to prevent the CPU from over-heating). We also found that running the rendering process at 2.0 GHz (a default setting used by many performance-oriented schedulers) does not give better load time. When optimising for energy consumption, around 30% of the simple websites benefit from the low-power A7 core. Furthermore, for the websites where the A15 core is a good choice, they are in favour of a lower clock frequency over the optimal one for load time. For EDP, using the A7 core benefits some websites but the optimal clock frequency leans towards a median value of the available frequency range. This is expected as EDP is a metric for quantifying the trade-off between load time and energy consumption. This diagram shows the need to adapt the processor settings to different web workloads and optimisation goals.
2) Performance for each configuration. Figure 10 shows the performance for using each of the processor configurations listed in Table II across optimisation metrics. It shows that a “one-size-fits-all” scheme fails to deliver the optimal per-formance. For example, while the A15(0.8GHz)-A7(0.4GHz) configuration is able to reduce the energy consumption by 40% on average, it is outperformed by our approach that gives a reduction of 63.5%. This is confirmed by Figure 9 (b), showing that running the A15 core at 0.8GHz only benefits 20% of the websites. Similar results can be found for the other two optimisation metrics. This experiment shows that an adaptive scheme significantly outperforms a hardwired strategy.
3) Prediction Accuracy. Our approach gives correct pre-dictions for 82.9%, 88% and 85% of the webpages for load time, energy consumption and EDP respectively. For those webpages that our approach makes a misprediction, the re-sulting performance is not far from the optimal, where we still achieve a reduction of 24%, 21% and 56% for load time, energy consumption and EDP when compared toHMP.
4) Breakdown of Overhead. Figure 11 shows the break-down of runtime overhead. The runtime overhead of our approach is low – less than 4% with respect to the rendering time. Since the benefit of our approach is significant, we believe such a small overhead is acceptable. Most of the time (15 ms) is spent on moving the rendering process from one
F e a t u r e e x t r a c t i o n
P r e d i c t i o n C o n f i g . T a s k m i g r a t i o n 0 . 0 %
0 . 5 % 1 . 0 % 1 . 5 % 2 . 0 % 2 . 5 % 3 . 0 %
O
v
e
rh
e
a
d
t
o
l
o
a
d
t
im
[image:7.612.332.542.228.361.2]e
Figure 11: Breakdown of runtime overhead to rendering time.
#DOM nodes#style ruleswebpage.sizeDOM tree depth HTML.attr.bgcolor
HTML.attr.cellspacing
HTML.tag.imgHTML.tag.liHTML.tag.table HTML.attr.content
css.background.imagecss.background.color
Load time
Energy
EDP
Figure 12: A Hinton diagram showing the importance of selected web features to the prediction accuracy. The larger the box, the more important a feature is.
processor to the other. This is expected as task migration involves initialising the hardware context (e.g. cache warm up), which can take a few micro-seconds. The overheads of other operations, i.e. feature extraction, predicting and frequency setting, is very low, which are less than 5 ms in total.
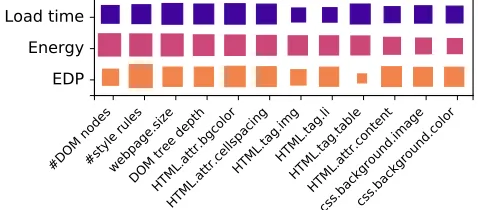
5) Feature Importance. Figure 12 shows a Hinton diagram illustrates some of the most important features that have an impact on the load time, energy and EDP specific models. Here the larger the box, the more significantly a particular feature contributes to the prediction accuracy. The x-axis denotes the features and the y-axis denotes the model for each metric. The importance is calculated through the information gain ratio. It can be observed that HTML tags and attributes (e.g. <li>,
[image:7.612.317.556.389.494.2]A1 5 ( 0. 8
GH
z )
A7 (
0 .4 G
H z )
A1 5
( 0. 9
GH
z )
A7 (
0 .4 G
Hz )
A1 5
( 1. 0
GH
z )
A7 (
0 .4 G
Hz )
A1 5
( 0. 3
G H
z )
A7 (
1 .1 G
Hz )
A1 5
( 0. 3
G H
z )
A7 (
1 .2 G
Hz )
A1 5
( 0. 3
GH
z )
A7 (
1 .3 G
H z )
A1 5
( 1. 3
GH
z )
A7 (
0 .4 G
Hz )
A1 5
( 1. 4
GH
z )
A7 (
0 .4 G
Hz )
A1 5
( 1. 5
G H
z )
A7 (
0 .4 G
Hz )
A1 5
( 0. 5
G H
z )
A7 (
1 .2 G
Hz )
A1 5
( 0. 5
G H
z )
A7 (
1 .3 G
H z )
A1 5
( 0. 5
GH
z )
A7 (
1 .4 G
Hz )
A1 5
( 1. 6
GH
z )
A7 (
0 .4 G
Hz )
A1 5
( 1. 7
G H
z )
A7 (
0 .4 G
Hz )
A1 5
( 1. 8
G H
z )
A7 (
0 .4 G
Hz )
A1 5
( 1. 9
G H
z )
A7 (
0 .4 G
Hz )
0 . 0 0 . 2 0 . 4 0 . 6 0 . 8 1 . 0 1 . 2 1 . 4
1 . 6 L o a d t i m e ( s )
[image:8.612.96.523.50.182.2]E n e r g y ( J ) E D P ( J * s )
Figure 10: The achieved performance for all configurations listed in Table II.
9 9 9 7 9 6
4 0 8 3
1 8 6 3
1 5
Po o
r 2G
G o o
d 2 G
Po o
r 3G
G o o
d 3 G
Po o
r 4G
G o o
d 4 G
Po o
r W i Fi
G o o
d W i Fi 0 %
2 0 % 4 0 % 6 0 % 8 0 %
1 0 0 % R e n d e r i n g t i m e
D o w n l o a d t i m e
Figure 13: Webpage rendering time to the time spent on downloading the contents in different network environments.
metrics. Other features are extremely important for some optimisation metrics (such as #DOM nodes is important for energy, and #HTML.tag.table is important for load time and energy) but less important for others. This diagram shows the need for distinct models for different optimisation goals.
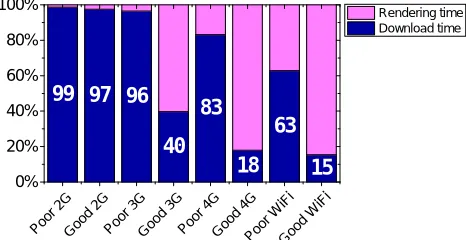
6) Adapt to Different Network Environments. In all the previous experiments, we have isolated the network impact by storing the webpage into a RAM disk. In practice, the device can be used in different network environments. A natural question to ask is: which of the three models developed in this work best suits for a particular environment? Figure 13 shows the webpage rendering time with respect to the download time under different network settings: 2G, 3G, 4G and WiFi (802.11). We further breakdown each environment into two groups: poor and good. A network environment is considered to be poor if the packet loss is greater than 30%, otherwise it is considered to be good. As can be seen from the diagram, the download time dominates the total processing time in poor and good 2G network environments. In such environments, our energy-tuned model can be used to trade rendering per-formance for energy consumption without compromising the user experience, by moving the rendering process to run on an low power processor at a low clock frequency. Our EDP-tuned model is mostly suitable for a good 3G network environment with a limited download bandwidth. Finally, our load-time-tuned model can be used in good 4G and Wifi environments to satisfy the performance requirement if load time is the first priority. This diagram demonstrates the need of an adaptive scheme in different network environments.
VII. RELATEDWORK
Our work lies at the intersection of numerous areas: web browsing optimisation, task scheduling, energy optimisation and predictive modeling.
Web Browsing Optimisation. A number of techniques
have been proposed to optimise web browsing, through e.g. prefetching [11] and caching [12] web contents, scheduling network requests [13], or re-constructing the web browser workflow [14]. Most of the prior work are built for a ho-mogeneous mobile systems where the processors are iden-tical. Furthermore, prior work often targets one single opti-misation goal (either performance or energy consumption). Unlike previous research, our work targets a heterogeneous mobile system with different processing units and multiple optimisation goals. The work presented by Zhu et al. [6] is the nearest work, which uses linear regression models to estimate the load time and energy consumption for each web event to determine where to run the rendering process. While promising, there are two significant shortcomings with this approach. Firstly, it schedules the webpage to the big core with the highest frequency if no configuration meets the cut-off latency. This leads to poor performance as can be seen in Section VI-C6 in some networking environments. Secondly, their linear regression models only capture the linear correlation between the web workload characteristics and the processor configuration, leading to a low prediction accuracy for some webpages. Our work addresses both of these issues by dynamically configuring all CPU cores of the system and modelling both linear and non-linear behaviour.
Task Scheduling. There is an extensive body of work on
scheduling application tasks on homogeneous and heteroge-neous multi-core systems e.g. [15], [16], [17]. Most of the prior work in the area use heuristics or analytical models to determine which processor to use to run an application task, by exploiting the code or runtime information of the program. Our approach targets a different domain by using the web workload characteristics to optimise mobile web browsing for a number of optimisation metrics.
Energy Optimisation. Many techniques have been
[image:8.612.59.292.214.334.2]These include aggregating data traffic [18], bundling HTTP re-quests [19], and exploiting the radio state mechanism [20]. Our approach targets a lower level, by exploiting the heterogeneous hardware architecture to perform energy optimisation. Work on application-level optimisation is thus complementary to our approach. Studies on energy behaviour of web workloads [2], [3], [21] are also orthogonal to our work.
Predictive Modelling. Machine learning based predictive
modelling is rapidly emerging as a viable way for sys-tems optimisation. Recent studies have shown that this tech-nique is effective in predicting power consumption [22], program optimisation [23], [24], [25], [26], [27], [28], auto-parallelisaton [29], [30], [31], task scheduling [32], [33], [34], [35], benchmark generation [36], estimating the quality of service [37], configuring processors using DVFS [38], and grouping communication traffics to reduce power consump-tion [39]. No work so far has used machine learning to predict the optimal processor configuration for mobile web browsing across optimisation goals. This work is the first to do so.
VIII. CONCLUSIONS
This paper has presented an automatic approach to optimise mobile web browsing on heterogeneous mobile platforms, providing a significant performance improvement over state-of-the-art. At the heart of our approach is a machine learning based model that provides an accurate prediction of the optimal processor configuration to use to run the web browser rendering process, taking into account the web workload char-acteristics and the optimisation goal. Our approach is imple-mented as an extension to the Google Chromium web browser and evaluated on an ARM big.LITTLE mobile platform for three distinct metrics. Experiments performed on the 500 hottest websites show that our approach achieves over 80% of the oracle performance. It achieves over 40% improvement over the LinuxHMPscheduler across three evaluation metrics: load time, energy consumption and the energy delay product. It consistently outperforms a state-of-the-art webpage-aware scheduling mechanism. Our future work will explore further refinement to prediction accuracy and to dynamically adapt to different networking environments.
ACKNOWLEDGMENTS
This work was performed while Jie Ren was a visiting PhD student with the School of Computing and Communications at Lancaster University. The research was partly supported by the UK Engineering and Physical Sciences Research Council under grants EP/M01567X/1 (SANDeRs) and EP/M015793/1 (DIVIDEND), and the National Natural Science Foundation of China under grant agreements 61373176 and 61572401.
REFERENCES
[1] S. Insights, “Mobile Marketing Statistics compilation,” 2016. [2] S. D’Ambrosio et al., “Energy consumption and privacy in mobile
web browsing: Individual issues and connected solutions,”Sustainable
Computing: Informatics and Systems, 2016.
[3] N. Thiagarajan et al., “Who killed my battery?: analyzing mobile browser energy consumption,” inWWW ’12.
[4] “big.little technology,” http://www.arm.com/products/processors/ technologies/biglittleprocessing.
[5] Y. Zhuet al., “Event-based scheduling for energy-efficient qos (eqos) in mobile web applications,” inHPCA ’15.
[6] Y. Zhu and V. J. Reddi, “High-performance and energy-efficient mobile web browsing on big/little systems,” inHPCA ’13.
[7] V. N. Vapnik and V. Vapnik,Statistical learning theory, 1998, vol. 1. [8] “Alexa,” http://www.alexa.com/topsites.
[9] L. A. Meyerovich and R. Bodik, “Fast and parallel webpage layout,” in
WWW ’10.
[10] “Intel powerclamp driver,” https://www.kernel.org/doc/Documentation/ thermal.
[11] Z. Wanget al., “How far can client-only solutions go for mobile browser speed?” inWWW ’12.
[12] F. Qian et al., “Web caching on smartphones: ideal vs. reality,” in
MobiSys ’12.
[13] ——, “Characterizing resource usage for mobile web browsing,” in
MobiSys ’14.
[14] B. Zhao et al., “Energy-aware web browsing on smartphones,” IEEE TPDS, 2015.
[15] Y. Zhang et al., “Task scheduling and voltage selection for energy minimization,” inDAC ’02.
[16] C. Augonnetet al., “Starpu: a unified platform for task scheduling on heterogeneous multicore architectures,”Concurrency and Computation:
Practice and Experience, vol. 23, 2011.
[17] A. K. Singhet al., “Mapping on multi/many-core systems: survey of current and emerging trends,” inDAC ’13.
[18] W. Hu and G. Cao, “Energy optimization through traffic aggregation in wireless networks,” inIEEE INFOCOM ’14.
[19] D. Liet al., “Automated energy optimization of http requests for mobile applications,” inICSE ’16.
[20] B. Zhao et al., “Reducing the delay and power consumption of web browsing on smartphones in 3g networks,” inICDCS ’11.
[21] A. Nicoaraet al., “System for analyzing mobile browser energy con-sumption,” Mar. 3 2015, US Patent 8,971,819.
[22] A. Shye et al., “Into the wild: studying real user activity patterns to guide power optimizations for mobile architectures,” inMicro ’09. [23] Z. Wang and M. O’Boyle, “Mapping parallelism to multi-cores: a
machine learning based approach,” inPPoPP ’09.
[24] Z. Wang and M. F. O’Boyle, “Partitioning streaming parallelism for multi-cores: A machine learning based approach,” inPACT ’10. [25] D. Greweet al., “Portable mapping of data parallel programs to OpenCL
for heterogeneous systems,” inCGO ’13.
[26] Z. Wang et al., “Automatic and portable mapping of data parallel programs to opencl for gpu-based heterogeneous systems,”ACM TACO. [27] W. Ogilvieet al., “Fast automatic heuristic construction using active
learning,” inLCPC ’14.
[28] ——, “Minimizing the cost of iterative compilation with active learning,”
inCGO ’17.
[29] G. Tournavitis et al., “Towards a holistic approach to auto-parallelization: integrating profile-driven parallelism detection and machine-learning based mapping,” inPLDI ’09.
[30] Z. Wang et al., “Integrating profile-driven parallelism detection and machine-learning-based mapping,”ACM TACO.
[31] ——, “Exploitation of GPUs for the parallelisation of probably parallel legacy code,” inCC ’14.
[32] D. Greweet al., “A workload-aware mapping approach for data-parallel programs,” inHiPEAC ’11.
[33] ——, “OpenCL task partitioning in the presence of gpu contention,” in
LCPC ’13.
[34] M. K. Emani et al., “Smart, adaptive mapping of parallelism in the presence of external workload,” inCGO ’13.
[35] Y. Wenet al., “Smart multi-task scheduling for opencl programs on cpu/gpu heterogeneous platforms,” inHiPC ’14.
[36] C. Cumminset al., “Synthesizing benchmarks for predictive modeling,”
inCGO ’17.
[37] J. L. Berralet al., “Adaptive scheduling on power-aware managed data-centers using machine learning,” inCCGrid ’11.
[38] E. Y. Kan et al., “Eclass: An execution classification approach to improving the energy-efficiency of software via machine learning,”
Journal of Systems and Software, vol. 85, 2012.
[39] Z. Tang et al., “Energy-efficient transmission scheduling in mobile phones using machine learning and participatory sensing,”IEEE