© 2019, IRJET | Impact Factor value: 7.211 | ISO 9001:2008 Certified Journal | Page 7420
Multi Response Optimization of CNC Turning of Aluminum alloy
(AA-1199) by using Grey Relational Analysis
Parvinder Singh
1, Dr. Beant Singh
21
Mtech Student, PCET, Lalru, Punjab
2Professor, PCET, Lalru, Punjab
---***---Abstract -
An abstract summarizes, in one paragraph (usually), the major aspects of the entire paper in the following prescribed sequence. The abstract of your paper must 250 words or less. This electronic document is a “live” template. The various components of your paper [title, text, heads, etc.] are already defined on the style sheet, as illustrated by the portions given in this document. Do not use special characters, symbols, or math in your title or abstract. The authors must follow the instructions given in the document for the papers to be published. This template, modified in MS Word 2007 and saved as a “Word 97-2003 Document( Size 10 & Italic , cambria font) In a manufacturing industry, economy of machining operation plays a key role in today's market. For any manufacturing process and particularly , in process related to CNC Turning the correct selection of manufacturing conditions is one of the most important aspects to take into consideration. This work investigates the effect and parametric optimization of process parameters of CNC Turning of AA-1199 aluminum alloy, using Grey Relational analysis. The input parameters considered are Spindle speed, Tool feed rate and depth of cut are optimized with consideration of Multi response characteristics including Surface roughness and Material removal rate. A well designed experimental scheme is used to reduce the total no of experiments. S/N Ratios associated with observed values in the experiments are determined by which factor is most affected by the responses. these experiments generate the output responses such as SR and MRR. The objective of optimization is to attain maximum MRR and minimum SR. Taguchi L9 orthogonal array has been used to design the combinations of parameters for the experiments. The machining experiments are performed on CNC machine. The Material removal Rate is checked by Weighing Machine and SR is checked by Profilometer. MINITAB software is used for finding the optimal values from the experimental values. firstly after finding the optimal values, graph for different parameters( spindle speed , tool feed and depth of cut)of mains and Signal to Noise ratio is plotted. Signal to Noise ratio is used according to response (output) that means if we want to find S/N ratio for MRR then S/N ratio larger is better and SR smaller is better. ANOVA is performed to get contribution of each parameter on the performance characteristics. The application of this technique converts the multi response variable to a single response grey relational grade and thus simplifies the optimization procedure.Key Words: SR, MRR, TAGUCHI, ORTHOGONAL, GRA,ANOVA.
1.INTRODUCTION
Turning is a machining process in which the work piece is rotated on the Lathe chuck and a cutting tool is fed into it radially, axially or both the ways simultaneously to give required (usually cylindrical surfaces). The axis of the cylindrical surface generated is often parallel work piece axis, while feed rate is given axial to the machine spindle. Once the cutting starts, the spindle speed and other cutting parameters will remain constant, the tool and work piece will remain in contact during the time the surface is being turned. At the same time, the cutting Spindle speed and cut dimensions will be constant when a cylindrical surface is being turned. Turning can be done manually, in an conventional version of lathe, which regularly needs continuous superintendence by the operator, or by employing a Computer-controlled (CNC) and automated lathe which does not require much supervision.. Turing can be of various types- straight turning, taper turning, profiling or external grooving. and can be used to produce material profiles like straight, conical, curved, or grooved work pieces. Each group of work piece materials has a predefined set of tool angles that ensure optimum turning performance. In turning, process parameters like cutting tool geometry and materials, depth of cut, feed rate, number of passes, spindle speed and use of cutting fluids will impact the costs, MRRs, cutting forces, tool life and other performance parameters like the surface roughness, the degree circular and dimensional deviations of the product.
1.1
Literature review
© 2019, IRJET | Impact Factor value: 7.211 | ISO 9001:2008 Certified Journal | Page 7421 experimentation. The factor considered were cutting speed,
work piece, fiber orientation angle, depth of cut, and feed rate. A procedure had been developed to asses and optimization the chosen factor to attain minimum surface roughness by incorporating: (1) Response table and response graph. (11) Normal probability plot, (111) Interaction graphs (1v) Analysis of variance (ANOVA) technique. Jha and Shahabadkar[3] conducted research to utilize Taguchi methods to optimize the material removal rate for machining operation by using aluminum samples as work-piece. It was found that depth of cut has significant role in producing higher MRR. The optimal results was verified through conformation experiments with minimum number of trials as compared with full factorial design. Vishnu et al.[4] conducted experimental study to optimize the effect of cutting parameters on surface roughness of Al alloy 6351 by Taguchi technique. The cutting parameters selected was such as cutting speed , feed, depth of cut and coolant flow, L9 orthogonal array was used for experimentation. It was found that S/N ratio value of verification test was within the limits of the predicted value and the objective of the work was fulfilled.Kumar P.[5], investigated the improvement in the material removal rate of electrochemical machining. Experimental MRR has been calculated for different electrolytes condition on aluminium and stainless steel. The experimental results indicate that by using sea water as an electrolyte in electrochemical machining on aluminium alloy and steel alloy gives better MRR.
1.2 Material & Method
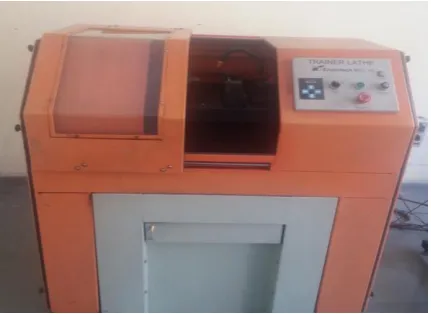
[image:2.595.72.288.513.670.2]The experiments were performed on CNC Lathe machine MCL 10. In this experimentation the work piece material was AA-1199 aluminum alloy. The length and diameter of each specimen was 350mm and 30 mm respectively
Fig -1: CNC lathe machine mcl10
Table 1. Input parameters and their levels
Control factors Factor levels
Level-1 Level-2 Level-3
Spindle Speed (rpm) 1100 1300 1500
Tool Feed (mm/min) 0.15 0.25 0.35
Depth of cut (mm) 0.3 0.5 0.7
Table 2. Orthogonal array for the experiment
2. EXPERIMENT CONDUCT
The experiment was conducted on CNC Lathe MCL10. The work piece used was Aluminum Alloy AA-1199 of Diameter 30mm and length 350mm. The high Speed steel Tool was used for the cutting of the material. Experimental was performed as per orthogonal setup for nine times. Aluminum alloy AA-1199 will be used as a work-piece material. It is silverfish white metal that has a strong resistance to corrosion and like gold, is rather malleable. It is a relatively light metal compared to metals such as steel , Nickel, brass and copper. It is easily machinable and can have wide variety of surface finishes. It also has good electrical and thermal conductivities and is highly reflective to heat and light.
Exp N Spindle
speed(rpm) Feed rate (mm/min) Depth of cut(mm)
1 1100 0.15 0.3
2 1100 0.25 0.5
3 1100 0.35 0.7
4 1300 0.15 0.5
5 1300 0.25 0.7
6 1300 0.35 0.3
7 1500 0.15 0.7
8 1500 0.25 0.3
© 2019, IRJET | Impact Factor value: 7.211 | ISO 9001:2008 Certified Journal | Page 7422
Table 3. Chemical Composition of AA-1199
Cu Si Mn Fe Mg Ti Zn V Ga+Bi+Pb+Zr AL
0.0
06 0.06 0.002 0.006 0.006 0.002 0.006 0.005 0.005 99.9
Table 4. Mechanical and Thermal properties of AA-1199
Tensile Strengt h (MPa)
Speci fic garvi ty
Poisso n’s ratio
Elastic Modul us (GPa)
Density (g/cm3)
Thermal Conductivity at 25°C (W/m-K)
230-570 2.7 0.33 70-80 2.6-2.8 243
Table 5. Experimental observations for SR & MRR
EN. Spindle speed
(rpm)
Tool Feed rate (mm/mi n)
Depth of cut(m m)
Surface roughnes s (µm)
MRR (mm3/mi n)
1 1100 0.15 0.3 1.1426 1786.44
2 1100 0.25 0.5 1.2565 2188.91
3 1100 0.35 0.7 1.4308 2935.85
4 1300 0.15 0.5 1.3599 2154.60
5 1300 0.25 0.7 1.3789 2749.98
6 1300 0.35 0.3 0.9944 3547.29
7 1500 0.15 0.7 1.5799 2175.90
8 1500 0.25 0.3 0.9770 2878.87
9 1500 0.35 0.5 1.2790 3438.56
3. RESULT AND ANALYSIS
The Average effect Response Table for raw data and S/N Ratios for SR are shown in Table below. From the Table 6 and 7 and on the basis of Ranks from the Tables, it has been analyzed that the parameter Depth of cut is the most significant factor which affects the SR.
Table 6.Response table for S/N Ratios for SR
Table 7. Response table for means for SR
Level Spindle speed Tool Feed Depth of cut
1 1.277 1.361 1.038
2 1.244 1.204 1.298
3 1.279 1.235 1.463
Delta 0.034 0.157 0.425
Rank 3 2 1
The Average effect Response Table for S/N ratio for MRR shown below. From the table 8 and on the basis of Rank, it has been analyzed that Tool Feed parameter plays a significant factor which affects the MRR.
Table 8. Response Table for S/N Ratios for MRR
The final results is Analyzed using ANOVA for identified the significant factor affecting the performance measure. The purpose of analysis of variance (ANOVA) is to determine which parameters significantly affect the quality characteristic. The analysis of variance is to identify the set of all independent variable (factors) that can potentially affect the value of response variable. The ANOVA for SR is taken at 95 % of confidence level. From table 7 below it is apparent that the P values of factor Depth of cut and factor
Level Spindle
speed Tool Feed Depth of cut
1 -2.0842 -2.6002 -0.3023
2 -1.8040 -1.5239 -2.2636
3 -1.9693 -1.7334 -3.9893
Delta 0.2802 1.0763 2.9893
Rank 3 2 1
Level Spindle speed Tool Feed Depth of cut
1 67.07 66.15 68.41
2 68.82 68.26 68.07
3 68.89 70.36 68.30
Delta 1.82 4.21 0.34
© 2019, IRJET | Impact Factor value: 7.211 | ISO 9001:2008 Certified Journal | Page 7423 Tool feed is less than P=0.05. It means that these terms
[image:4.595.311.557.122.283.2]influence the model to a great extent. The most significant input factor is depth of cut for surface roughness.
Table 9. Analysis of variance Table for SR
Sourc
e DOF Seq SS Adj SS Adj MS F P
Spindl e speed
2 0.00221
5 0.002215 0.001107 3.34 0.231
Tool
Feed 2 0.041374 0.041374 0.020687 62.31 0.016
Depth
of cut 2 0.275775 0.275775 0.137887 415.36 0.002
Error 2 0.00066
4 0.000664 0.000332
Total 8 0.32002
7
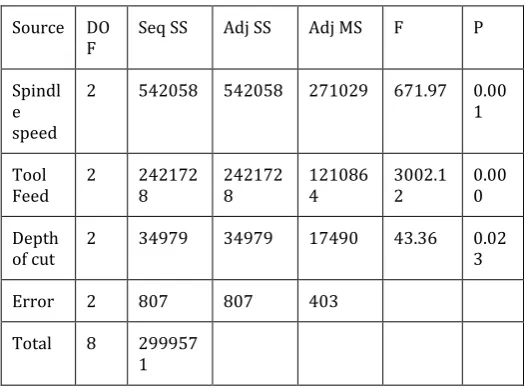
The ANOVA for MRR is taken at 95 % of confidence level. From table 8 it is apparent that the P values of factor spindle speed, tool feed and depth of cut are less than P=0.05. It means that these terms influence the model to a great extent. The most significant input factor is tool feed for material removal rate(MRR).
Table 10.Analysis of Variance Table for MRR
Source DO
F Seq SS Adj SS Adj MS F P
Spindl e speed
2 542058 542058 271029 671.97 0.00
1
Tool
Feed 2 2421728 2421728 1210864 3002.12 0.000
Depth
of cut 2 34979 34979 17490 43.36 0.023
Error 2 807 807 403
Total 8 299957
1
In the Experiment analysis, the main effect Plot for Means Fig 2 is used to find the optimal parameters for Minimum SR. So the optimum parameter combination for the minimum surface roughness is Second level of spindle speed(1300 rpm), second level of tool feed(0.25mm/min) and first level of depth of cut(0.3mm), i.e.(A2B2C1).
1500 1300 1100 1.4
1.2
1.0
0.35 0.25 0.15
0.7 0.5 0.3 1.4
1.2
1.0
Spindle Speed
M
e
a
n
o
f
M
e
a
n
s
Tool Feed
Depth of Cut
[image:4.595.30.295.181.386.2]Main Effects Plot for Means Data Means
Fig 2. Main effects plot for Means for SR
1500 1300 1100 70 69 68 67 66
0.35 0.25 0.15
0.7 0.5 0.3 70 69 68 67 66
spindle spped
M
ea
n
of
S
N
ra
ti
os
Tool Feed
Depth of Cut
Main Effects Plot for SN ratios Data Means
[image:4.595.314.552.324.466.2]Signal-to-noise: Larger is better
Fig -1: Main Effects Plot for S/N Ratios for MRR
The Main effects plot for S/N ratios fig 3 is used to optimized the parameters for Higher Material removal Rate(MRR).The optimum parameters combination for Higher Material Removal rate(MRR) for the above study is third level of spindle speed(1500 rpm), third level of tool feed(0.35mm/min.) and first level of depth of cut(0.3mm),i.e.(A3B3C1) .
3.1 Multi-response optimization using grey
relational analysis
GRA is used to convert multi response results into a single response or objective. The aim is to identify the optimal combination of process parameters that minimize the SR and maximize the MRR. The Normalized S/N ratio for SR and MRR in table 11 is calculated with the help of relation below.
[image:4.595.30.294.498.692.2]© 2019, IRJET | Impact Factor value: 7.211 | ISO 9001:2008 Certified Journal | Page 7424 Grey Relational coefficient in Table 11 is calculated with the
help of relation,
(k)
Here
(k)
is identified coefficient and value of
(k)
= 0.5 is generally used.The Grey Relational Grade is calculated by averaging the Grey relational coefficient corresponding to each performance characteristics in Table 11.
Table 11.Grey Relational Grade
R u n Spindle speed(rp m) Tool Feed( mm/ min) Depth of cut(m m) Normalized
S/N ratios Grey Relational coefficient Grey Relatio nal Grade Ra nk
SR MRR
SR MR R
1
1100 0.15 0.3 0.725 3 0
0.645 4
0.3 33
3 0.4893 5
2 1100 0.25 0.5 0.5364 0.2285 0.5188 0.393 2
0.456 7
3
1100 0.35 0.7 0.247 3 0.652 7 0.399 1 0.5 90
1 0.4946 4
4
1300 0.15 0.5 0.364
9 0.2090 0.4404 0.3 87
2 0.4138 8
5 1300 0.25 0.7 0.3333 0.5472 0.4285 0.524 7
0.4766 6
6
1300 0.35 0.3 0.971 1 1
0.945
3 1 0.9726 1
7
1500 0.15 0.7
0 0.2211 0.3333 0.3 90
9 0.3621 9
8
1500 0.25 0.3
1 0.6203 1 0.568 3
0.7841 3
9
1500 0.35 0.5
0.977 0.9382 0.9560 0.8 89
9 0.9229 2
4. CONCLUSIONS
1. The surface roughness is mainly affected by the depth of cut. With the increase in depth of cut surface roughness increases and with increase in tool feed , the surface roughness decreases, but with further increase in tool feed it again started increasing. Spindle speed has a very little effect on surface roughness for present study.
2. From ANOVA analysis it has been found that depth of cut and tool feed are the significant factors affecting the surface roughness.
3. The material removal rate is mainly affected by tool feed rate. With the increase in tool feed rate material removal rate increases and it also increase with
increase in spindle speed. Depth of cut has no effect on material removal rate for the present study.
4. From ANOVA analysis its has been found that tool feed rate is the most significant factors affecting the material removal rate.
5. Grey relational analysis were applied in this work for multi response characteristics such as MRR and SR. And the optimal parameter combination for minimum SR and higher MRR was determined as A2 (spindle
speed, 1300rpm), B3 (tool feed, 0.35 mm/min) and C1
(depth of cut, 0.3 mm), i.e (A2B3C1).
REFERENCES
[1] Lin, C. L(2004),“Use of the Taguchi Method and Grey
Relational Analysis to Optimize Turning Operations with Multiple Performance Characteristics”,materials and manufacturing processes vol. 19, issue. 2, pp. 209–220.
[2] Kumar K. Palni, Murti L Kruna ,Krtikkeyan R,“
Assessment of factors influencing surface roughness on the machining of glass fiber-reinforced polymer composites”. Journal of Reinforced Plastics and Composites, Vol. 18, No. 12,2005,pp 1739-1751 SAGE Publications.
[3] Puri A.B., Bhattacharya B., “ Modeling and analysis of
white layer depth in a wire cut EDM process through response surface methodology” Int.Journal Advanced Manufacturing technology vol 25,2005, pp 301-307.
[4] Suleman Abdul Kareem ,UsmanJibrinRumah and
ApasiAdohoma , “Optimizing machining parameters during turning process” international journal of integrated engineering vol.3 ,2011,pp 23-27.
[5] Ch.Madhu, Sharma A.V.N.L,
GopichandA.andPawan(2012) ,“Optimization of cutting parameters for Surface Roughness prediction using artificial neural network in CNC Turning.” International journal of Engineering and Sciences vol.2,2012, pp 2-7.
[6] .Joshi, A., Kothiyal, P. and Pant, R.(2012), “Experimental
Investigation Of Machining Parameters Of CNC Milling On MRR By Taguchi Method.”International Journal of Applied Engineering Research, Vol.7, Issue-11, pp. 48-52
[7] MagdumVikas B. and NaikVinayakR.,”Evaluation and
optimization of machining parameter for turning of EN 8 steel”.International journal of Engineering trends and technology,vol.4 issue 5,2013,pp. 1564-1568.
[8] .Z. Neelan Basha and S. Vivek(2013),”Optimization of
CNC turning process parameters on Aluminium 6061
using Response surface methodology.”
Vol.XXX,No.XXX,pp.546-552.
[9] Kumar, P., (2014) “Investigation of material removal
rate in electrochemical process”, International Journal of Applied Engineering and Technology, “Vol. 4, pp. 68-71.
[10] A.Venkkata Vishnu,K.B.G Tilak, G.Guruvaiah Naidu and
Dr. G. Janardhana Raju(2015),”Optimization of different process parameters of Aluminium alloy 6351 in CNC milling using Taguchi met\hod”.Vol. 3, Issue 2,Part 2,pp.404-413.
[11] Sujit Kumar Jha and Pramod K.
© 2019, IRJET | Impact Factor value: 7.211 | ISO 9001:2008 Certified Journal | Page 7425 turning of Aluminium using Taguchi method.”Vol. 23,