Title: Variation of Jupiter’s Aurora Observed by Hisaki/EXCEED: 3. Volcanic Control of Jupiter's 1 Aurora 2 Paper: GRL 3
Authors: Chihiro Tao [1, 2], Tomoki Kimura [3], Fuminori Tsuchiya [2], Go Muirakami [4], Kazuo 4
Yoshioka [5], Atsushi Yamazaki [4], Sarah V. Badman [6], Hiroaki Misawa [2], Hajime Kita [2], 5
Yasumasa Kasaba [2], Ichiro Yoshikawa [5], Masaki Fujimoto [4] 6
Affiliations: 7
[1] NICT, Koganei, Japan 8
[2] Tohoku University, Sendai, Japan 9
[3] Riken, Saitama, Japan 10
[4] ISAS/JAXA, Sagamihara, Japan 11
[5] University of Tokyo, Chiba, Japan 12
[6] Lancaster University, Lancaster, England 13
14
Corresponding Author: Chihiro Tao ([email protected]) 15
Running title (<=45 characters): Io’s volcanic effect on Jovian aurora (37) 16
Abstract&text 3437 + Figure caption 465 = 3902 17
Figure 3+ Table 1 18
UNIT= 8+4=12 19
20
Key points (<=140 characters): 21
1. Responses of Jupiter's northern aurora spectra to Io volcanic activity were detected using 22
Hisaki/EXCEED long-term monitoring (125) 23
2. Decrease of colour ratio, i.e., auroral electron energy, suggests reduced electron acceleration for 24
the more highly populated magnetosphere (139) 25
3. Long-term observation provided the typical value and variances of auroral emission power and 26
electron parameters (112) 27
28
Question 1. *Major Topic or Scientific Question 29
The major topic is the response of the Jovian magnetosphere/aurora to plasma produced by Io 30
volcanic activity, motivated by the scientific question “What is the role of Io plasma in Jupiter’s 31
magnetosphere?” 32
The plasma source is an important factor in a Jupiter-type rotation-driven magnetosphere. 33
34
Io volcanic activity modifies Jovian magnetospheric activity via thermal plasma population and the 36
magnetosphere–ionosphere coupled current system. Rapid publication is required because this study 37
has implications regarding Juno and Juno-supporting observations that are currently ongoing. 38
39
Question 3. *Broad Implications 40
This work represents an advance in the area of planet-magnetosphere-moon interaction, which has 41
relevance for communities involved in studies of the internal (planetary) and external 42
(magnetospheric) fields related to current and future missions to Jupiter (e.g., Juno, JUICE). The 43
provided typical and variation values related aurora is useful information for modelling studies. 44
--- 45
Abstract 46
[1] Temporal variation of Jupiter’s northern aurora during enhanced Io volcanic activity was detected 47
using the EXCEED spectrometer onboard the Hisaki Earth-orbiting planetary space telescope. It was 48
found that in association with reported Io volcanic events in early 2015, auroral power and estimated 49
field-aligned currents were enhanced during day of year 40–120. Furthermore, the far ultraviolet 50
colour ratio decreased during the event, indicating a decrease of auroral electron mean energy and 51
total acceleration by <30%. During the episode of enhanced Io volcanic activity, Jupiter’s 52
magnetosphere contains more source current via increased supra-thermal plasma density by upto 53
42%; therefore, it would have required correspondingly less electron acceleration to maintain the 54
enhanced field-aligned current and corotation enforcement current. Sporadic large enhancements in 55
auroral emission detected more frequently during the active period could have been contributed by 56
non-adiabatic magnetospheric energization. (137 words) 57
[2] The Jovian magnetosphere is characterized by a plasma supply of up to ~1 ton s-1 from its 59
volcanically active moon, Io. Despite the initial radial transport of the plasma, its rotational motion 60
around Jupiter is maintained by the transfer of angular momentum from the planetary atmosphere 61
[e.g., Hill, 1979]. Jupiter’s main aurora is considered to be produced by the angular momentum 62
transfer carried by the field-aligned current [e.g., Hill, 2001; Cowley and Bunce, 2001]. 63
[3] The level of volcanic activity of Io can change dramatically; the subsequent enhancement in the 64
emission of the Io plasma torus (IPT) can persist for a few days to a period of several months. In 65
association with the volcanic activation in May 2007 detected via brightening of the sodium nebula 66
observation by Yoneda et al [2009], an auroral image after the enhancement showed an equatorward 67
shift of the main aurora and an increase in the occurrence of very bright enhancement >600 GW at 68
lower latitudes [Bonfond et al., 2011]. On the other hand, the activity of aurora-related hectometric 69
radio emission was reduced [Yoneda et al., 2013]. As momentum transfer is supposed to occur 70
efficiently over a more limited radial distance of the equatorial magnetosphere for the increased 71
plasma case, theoretical models predict that the main aurora would be located at lower latitudes for 72
the case of increased Io plasma mass loading [Nichols and Cowley, 2005; Tao et al., 2010; Nichols, 73
2011]. Nichols [2011] suggested that the field-aligned current, i.e., intensity of the main auroral 74
emission, would increase or decrease when variation in plasma production occurs with or without the 75
modification of the background plasma density, respectively. In order to associate these different 76
features of the aurora (i.e., auroral intensity and particle acceleration) with the resultant auroral 77
electron energy, continuous auroral spectral observation is required. 78
[4] This monitoring can be achieved by JAXA’s Hisaki Earth-orbiting space telescope. The 79
Hisaki monitors emissions from both the IPT and Jupiter’s northern aurora simultaneously [Yoshioka 81
et al., 2013; Yoshikawa et al., 2014; Yamazaki et al., 2014]. Ground-based monitoring of the sodium 82
line from Jupiter magnetosphere showed enhancement and radial extension on the eastern side 83
starting from 10 January 2015 (day of year (DOY) 10) [Yoneda et al., 2015]. Infrared imaging of 84
Io’s surface detected a sudden brightness enhancement at Kurdalagon Patera on 26 January [de Kleer 85
and de Pater, 2016]. The intensity of emission rom the sodium neutral cloud subsequently increased 86
by almost a factor of four by the middle of February before decreasing in April. This emission 87
enhancement is actually weak compared to typical events [Yoneda et al., 2015]. This variation in 88
neutral sodium emission was followed by enhancements of IPT S+ (increase from DOY 20 and 89
decrease during DOY ~60–90), S2+ (increase from DOY ~30 and decrease during DOY 70–110), and 90
S3+ lines (increase from DOY ~40 and decrease from DOY 90) detected by EXCEED [Tsuchiya et 91
al., 2017MOP, Yoshikawa et al., 2017]. EXCEED cannot resolve auroral structure due to its 92
moderate spatial resolution (~1 RJ around Jupiter’s opposition), but it can monitor auroral spectra 93
continuously for ~40 min during each 106-min orbit. Applying the spectral analysis proposed by Tao 94
et al. [2016a, 2016b] (hereafter Paper I and Paper II, respectively), the auroral and magnetospheric 95
responses to the described volcanic activity are investigated in this study. 96
2. Observations and Data Procedure 97
[5] The Hisaki auroral observations and analysis are described in detail for the reader by Kimura et al. 98
[2015], Paper I, and Paper II, therefore we only describe them briefly herein. The northern auroral 99
region is covered by the dawn–dusk directed dumbbell-shaped slit with an effective spatial resolution 100
of 17 arcsec and a pointing accuracy of ±2 arcsec. EXCEED detects auroral emissions over the 80– 101
at half maximum (FWHM) resolution of 0.3 nm. The auroral signals within the 20 arcsec aperture of 103
the slit width are integrated for each specific wavelength. The waveband 138.5–144.8 nm is used to 104
estimate the total emission and input power. The far ultraviolet colour ratio (CR) is defined as the 105
ratio of the intensity of the waveband absorbed least by atmospheric hydrocarbons (138.5–144.8 nm) 106
to that absorbed most (123–130 nm), which for EXCEED is defined as CREXCEED. As the CR reflects 107
the depth of the auroral electron precipitation into the hydrocarbon layer, the auroral electron energy 108
can be estimated assuming a particular atmosphere model. The total number flux derived from the 109
electron energy and energy flux is converted into the field-aligned current density, using an averaged 110
auroral area based on an empirical magnetic field model called VIP4 [Connerney et al., 1998]. With 111
reference to the auroral electron acceleration theory, the source current density can then be estimated 112
(Paper II). We analysed observations when the Jupiter northern aurora was facing Earth, i.e., when 113
the central meridional longitude (CML) was 45–345° system III longitude. As the auroral oval 114
around the northern pole is shifted from Jupiter’s rotational pole, the auroral aperture and thus the 115
auroral power detectable from Earth varies with Jupiter’s rotation. This aperture effect on the total 116
power is scaled by multiplying by the factor, (maximum visible auroral length integrated over all 117
CML)/(visible auroral length at instantaneous CML), assuming a typical auroral location (Paper II), 118
which is called “revised power” hereafter. 119
[6] The solar wind conditions just upstream of Jupiter’s magnetosphere are estimated using a 120
one-dimensional magnetohydrodynamic model that propagates the solar wind variation observed at 121
Earth toward Jupiter [Tao et al., 2005]. Here, we used OMNI 1-hour data as the input for this 122
propagation model. 123
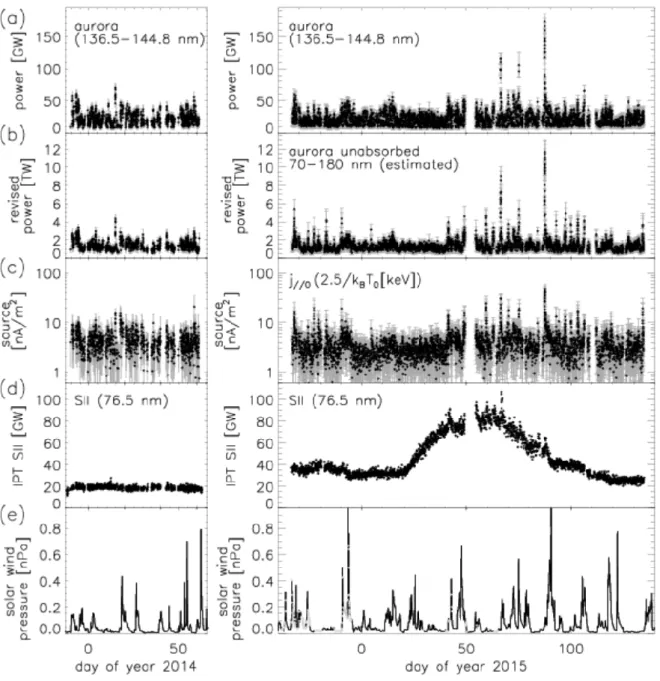
[7] Figure 1 shows an overview of the variation of the auroral parameters (Figures 1a–1c) and the 125
IPT power (Figure 1d) for two periods: season 2014 (December 2013 to April 2014) and season 2015 126
(November 2014 to May 2015). Auroral intensity enhancements can be observed in 127
minimum-hydrocarbon absorption wavebands within the Hisaki/EXCEED wavelength range (Figure 128
1a) and the total emitted power (Figure 1b). These are associated with the enhancement of the source 129
current density j//0(2.5/kBT0 [keV]) before the field-aligned acceleration of the magnetospheric 130
electrons occurs (Figure 1c). Several enhancements over a few days during the observation periods 131
are related to enhancements due to the solar wind dynamic pressure (Figure 1e), whereas the aurora 132
shows a characteristic variation associated with the long-term IPT enhancement (Figure 1d). All 133
estimated parameters are provided in the supplementary material (Figure S1). 134
[8] Compared with season 2014 and the early part of season 2015 (until DOY40), the aurora shows 135
larger enhancements more frequently after DOY40 in 2015. With reference to the more continuous 136
observations in season 2015, auroral enhancements beyond 50 GW in the 136.5–144.8 nm waveband 137
can be seen on DOY –33 to –32, –7, 12–14, 41, 48–49, 66, 70, 72, 74, 87, 96, 103, 116, and 127 in 138
2015 (Figure 1a), i.e., 3 events in the first 80 days (DOY –40 to 40) and 11 events in the second 80 139
days (DOY 40–120). 140
[9] Among them, very large enhancements of the power in the 136.5–144.8 nm waveband reach 115, 141
105, and 173 GW on DOY 66, 74, and 87 in 2015, respectively. As the emission intensity of 142
maximum-hydrocarbon absorption waveband (126.3–130.0 nm) also increases (Figure S1b), the CRs 143
and electron energies for these events are not large; their medians and standard deviations (1σ) of the 144
electron energy are 165 ± 38, 165 ± 23, and 159 ± 31 keV, respectively, slightly smaller than the 145
(0.33σ–0.49σ, where σ=39 keV). On the other hand, their electron fluxes reach 282, 268, and 431 147
MA, which are 5.2, 5.0, and 7.9 times larger than the mean value over the entire period, respectively. 148
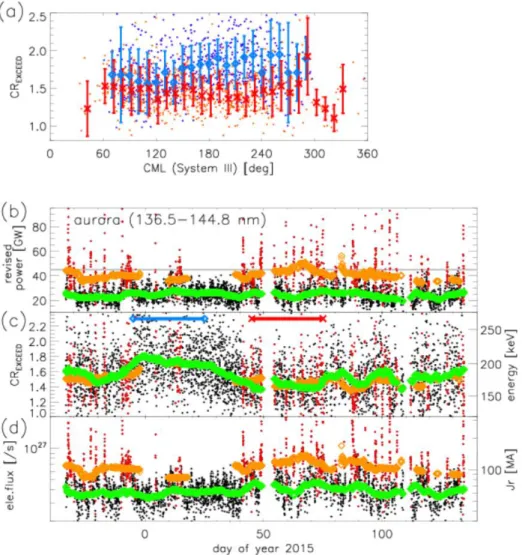
[10] Figure 2a shows the CREXCEED as a function of CML comparing before (DOY 0–30, blue) and 149
after (50–80, red) the volcanic activity enhancement. CREXCEED at CML175–225° decreases 150
significantly during the active period by up to 30%. We divided the data into two groups: auroral 151
power enhancement events (EV, red points in Figures 2b–2d) whose revised auroral power at 136.5– 152
144.8 nm reaches >45 GW and other backgrounds (BG, black points). As discussed above, the 153
occurrences of these events vary. 10-day running averages of both EV and BG show a decrease in 154
CREXCEED after DOY ~40 in 2015 (Figure 2c), and a slight increase in electron flux (Figure 2d) with 155
almost constant power (Figure 2b) is seen for BG. 156
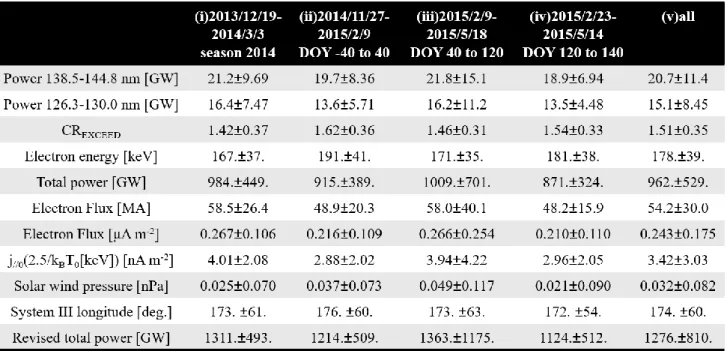
[11] Table 1 lists the median values of the key parameters over five selected periods: (i) season 2014, 157
(ii) DOY -40 to 40, (iii) DOY 40 to 120, (iv) DOY 120 to 140 of season 2015, and (v) the entire 158
dataset. The error values represent the standard deviation. The standard deviation of the emission 159
power, electron flux, and source current density increase during the period of Io enhanced activity, 160
e.g., the standard deviation of the revised total emission power is 1175 GW in (iii) and 493–512 GW 161
in the other periods. 162
[12] Figure 3a shows the relationship between the mean electron energy and energy flux taken from 163
the active (period (iii), orange points) and other quiet periods (periods (ii) and (iv), black points) in 164
season 2015. For the active period, the mean energy decreases as seen in Figure 2c and energy flux 165
mainly increases with a broadening of its distribution. The difference between the two distributions is 166
evident in the contour maps of each period shown in Figures 3b and 3c. We derived best-fit Knight 167
(RMSE) of the data. We used 90% data points which have energy flux and mean energy values 169
closest to the average of each value. Moreover, the density becomes 0.0019 and 0.0027 cm-3 during 170
the quiet and active periods, respectively. The goodness of fit is confirmed by a good distributional 171
correlation between the concentrations of data shown in red (27% occurrence), with the white curves 172
representing the best-fit Knight relation curves. The derived minimum RMSEs for these two periods 173
are relatively small such that their difference is statistically significant. The best-fit curves for the 174
constant source density (0.0019 cm-3) correspond to a source electron temperature of 1.3 keV for the 175
active period, suggesting another possibility for this change. 176
[13] The median value of the revised power is also largest in period (iii), followed in descending 177
order by periods (i), (ii), and (iv). Auroral power is modulated by solar wind dynamic pressure [Kita 178
et al., 2016]. A linear relation between auroral power and solar wind was derived using the 179
information at (ii) 0.037 and (iv) 0.021 nPa. For the pressure of 0.049 nPa of (iii), the total power 180
derived from this linear relation is 1279 GW, which is slightly smaller than the observed power of 181
1355 GW but the difference is not significant compared to the error averaged over the whole period, 182
281 GW. 183
[14] The total energy emitted over 800 points (1 point =10 min.) before (10.4<DOY2015<52), 184
during (45.8<DOY2015<82.5), and after (97.2<DOY2015<140) the volcanic active period are 185
6.0×10⁸ J, 7.6×10⁸ J, and 6.4×10⁸ J, respectively. Differences among the volcanic activity phases are 186
much larger than 2.9×10⁵ J, derived using the mean error. Additionally, the total energy input into 187
the polar region during the entire event reaches 2×10¹⁹ J, which is comparable with the total energy 188
content of the magnetospheric ions ~1.4×10¹⁹ J [Bagenal and Delamere, 2011]. 189
[15] In the auroral feature, we found the following characteristic variations: (i) enhancements of the 191
auroral power and its variation were caused by sporadic short-term (<1 rot to a few days) 192
enhancements (Figure 1), and (ii) a relatively small colour ratio, i.e., auroral electron energy (Figures 193
2 and 3a–3c), observed during DOY 40–120 of 2015. It is known that volcanic eruptions (outbursts) 194
last days, and the torus enhancement lasts from a few to tens of days. For this volcanic event in early 195
2015, the increase in infrared emission at Kurdalagon Patera was observed on DOY26, sodium 196
emission began on DOY10 until its peak on ~DOY50 [e.g., Yoneda et al., 2015], and OI emission 197
began on DOY20 and peaked during DOY40–60 [Koga et al., 2018]. Moreover, plasma transfer from 198
the IPT (~6 RJ) to the middle magnetosphere of the main auroral source region (~20 RJ) is suggested 199
to take tens of days [Bagenal and Delamere, 2011]. Therefore the variations observed during 200
DOY40–120 reflect an enhanced plasma transfer at the middle magnetosphere. There are other 201
periods with smaller CR and sporadic enhancements at the beginning of season 2015, e.g., DOY-40 202
to -10. This might have been affected by another volcanic event in late 2014, as reported by de Kleer 203
and de Pater [2016]; this was prior to the Hisaki and sodium monitors, and therefore beyond our 204
dataset. First, we qualitatively compare these parameters with the quiet period, followed by 205
comparison with previous findings obtained using different methods. 206
[16] Hisaki’s long-term monitoring provides the following statistical auroral parameters: the total 207
electron flux precipitation into the polar region of 54.2±30 MA and appearance-revised total 208
emission power of 1276±810 GW. The total electron flux is comparable with the plasma 209
corotation-enforcement current of 60–100 MA derived as a curl of the magnetic field measurement 210
[Khurana, 2001]. The revised total power is also comparable with other analyses, e.g., 1.2 TW 211
[17] For the auroral enhancement event of season 2014, the enhancement of the source current 213
density is comparable with the magnetospheric adiabatic variation due to solar wind compression 214
(see Section 5.4 of Paper II for detail). The other possible process, i.e., the positional change toward 215
an open–closed boundary, is less probable here, referring to observation of auroral deposition toward 216
low latitudes during the interval of increased Io plasma mass loading reported by Bonfond et al. 217
[2011] and theoretical suggestions [e.g., Nichols and Cowley, 2005]. 218
[18] We apply the same analysis to the 66 events in 2014–2015 seasons whose revised power at 219
136.5–144.8 nm exceeds 45 GW. We refer to the maximum value of solar wind dynamic pressure 220
over four days (from two days before to two days after the events), and the minimum value of the 221
pressure over two days before the maximum pressure. These time spans are set by taking into 222
account the solar wind model uncertainty of shock arrival and possible time lag of magnetospheric 223
response. Magnetopause location is derived from the solar wind pressure using an empirical model 224
[Huddleston et al., 1998]. We estimated the density increase due to the magnetospheric compression 225
assuming isotropic shrinking under the conservation of mass, and corresponding plasma temperature 226
variation for the adiabatic change to obtain variation of the source current j//0. Then the field-aligned 227
current density for the observed electron energy is derived referring to the Knight theory. We 228
compare the estimated increase ratio of the field-aligned current, Rmodel, with that directly estimated 229
from the auroral spectral observation, Robs. Figure 4a shows the relationship between Rmodel and Robs. 230
Since this model is based on the solar wind pressure variation, we exclude the events which are 231
independent of the solar wind pressure enhancement (maximum pressure <0.1 nPa, 13 events) shown 232
by small marks. If the variation follows this model, the relationship should be Rmodel=Robs. 233
i.e., larger Rmodel/Robs≥2, are more frequently seen for the volcanic activity cases (seven red points) 235
compared to the quiet case (two blue points). In addition, the Robs/Rmodel values increase with the 236
increasing Robs. This deviation from Robs=Rmodel indicates the contribution of the other processes 237
beyond the above model and assumptions, e.g., non-adiabatic plasma acceleration such as 238
magnetospheric reconnection and local heating, especially for the volcanic active period and large 239
enhancement events. 240
[19] As seen in Figure 3, during the active volcanic phase, the typical relationship between the 241
auroral mean energy and the flux shifts in a number of ways, e.g.: (i) to the more magnetospheric 242
populated case, i.e., from 0.0019 to 0.0027 cm-3, or (ii) to a lower temperature of the source plasma, 243
i.e., from 2.5 keV to 1.3 keV, for the constant density case, or a combination of both. According to 244
Nichols [2011], as an increase in the auroral electron flux is achieved in the case corresponding 245
increase in background density, we will discuss the plasma increase, above case (i). Note that this 246
population is the thermal electron (~a few keV) which can reach the planetary atmosphere compared 247
with the more abundant cold component (~tens eV) in the magnetosphere. This indicates that the 248
energetic supra thermal electrons are also increased by the volcanic activity, while the neutrals and 249
ionized plasma enhanced at IPT would be mainly the cold component. In addition, the estimated 250
auroral electron energy decreases for the active period, indicating a smaller acceleration. This 251
behaviour likely arises because the greater population of the source plasma would be enough to 252
maintain the corotation enforcement current with less electron number energy enhancement. A 253
spectral diagnosis of the IPT emission observed by Hisaki suggests the enhancement of the cold 254
(~several eV) and hot (~100s eV) electron density during the period of Io enhanced activity 255
population increases with distance from Jupiter [Yoshioka et al., 2017]. Although there is a 257
difference in radial distances between the location of IPT (~6 RJ) and the magnetospheric source 258
region of the main aurora (~20 RJ), the auroral analysis additionally suggests the enhancements of 259
the supra thermal plasma in the middle magnetospheric. According to a modelling study by Nichols 260
[2011], the enhancement of the total current seen in this observation also supports the increase of the 261
magnetosphere plasma population with increased plasma mass loading at Io. The plasma angular 262
velocity deviates from the corotation at smaller radius with more rapid variation during the increased 263
plasma mass-loading period. This provides a larger magnetospheric current as well as a field-aligned 264
current, which has been observed as an increase in auroral emission power [Nichols, 2011]. 265
[20] Using spatially resolved auroral spectra, Gérard et al. [2016] (and partly Gustin et al. [2004] and 266
Paper I) showed that the relation between auroral electron energy/CR and electron energy flux varies 267
according to which specific auroral feature is considered. The relationship derived from the 268
polar-integrated Hisaki dataset is the spatially-averaged characteristic, as discussed in Paper I. In 269
addition, the estimated electron energies in this study are mean values and we cannot specify the 270
auroral electron spectral change in detail, i.e., whether a decrease of electron energy over the whole 271
energy range, or a relative decrease (increase) of high (low) energy electrons, or a combination of 272
these types of changes. These are open questions beyond the scope our dataset and present analysis. 273
We need to develop additional methods to ascertain in case other acceleration processes are 274
dominant. 275
5. Summary 276
[21] Long-term monitoring of Jupiter’s aurora by Hisaki/EXCEED has detected enhancements of the 277
i.e., the auroral electron energy (by upto 30%), associated with reported Io volcanic events observed 279
in early 2015. The enhanced plasma mass-loading of Io increases the source current via an increased 280
supra-thermal (a few keV) plasma density by upto 42%, which contributes to a large field-aligned 281
current to maintain the corotation with less field-aligned acceleration. Sporadic large auroral 282
enhancements during the interval are not readily explained by an adiabatic solar wind response 283
model, which suggests a contribution by non-adiabatic magnetospheric energization. 284
Acknowledgements 285
[21] We acknowledge the working teams of Hisaki/EXCEED, WIND, ACE, and OMNI. The data 286
from the Hisaki spacecraft can be found in the Data Archives and Transmission System (DARTS) of 287
JAXA. The OMNI data used for the solar wind model were taken from the NASA Coordinated Data 288
Analysis Web (CAWeb). This work was supported by MEXT/JSPS KAKENHI Grant JP15K17769. 289
We acknowledge the contribution of the International Space Sciences Institute (ISSI) in Bern, 290
Switzerland, for hosting and funding the ISSI international teams on “The influence of Io on 291
Jupiter’s magnetosphere” (ID388) and “How does the solar wind influence the giant planet 292
magnetospheres?” (ID357) and the constructive discussions had by these team members. We thank 293
NASA/PSP membersfor useful discussions. 294
295
References 296
Badman, S. V., et al. (2016), Weakening of Jupiter's main auroral emission during January 2014, 297
Bagenal, F., and P. A. Delamere (2011), Flow of mass and energy in the magnetospheres of Jupiter 299
and Saturn, J. Geophys. Res., 116, A05209, doi:10.1029/2010JA016294. 300
Bonfond, B., M. F. Vogt, J.-C. Gérard, D. Grodent, A. Radioti, and V. Coumans (2011), 301
Quasi-periodic polar flares at Jupiter: A signature of pulsed dayside reconnections?, Geophys. Res.
302
Lett., 38, L02104, doi:10.1029/2010GL045981. 303
Connerney, J. E. P., M. H. Acuña, N. F. Ness, and T. Satoh (1998), New models of Jupiter’s 304
magnetic field constrained by the Io flux tube footprint, J. Geophys. Res., 103(A6), 11,929– 305
11,939, doi:10.1029/97JA03726. 306
Cowley, S. W. H., and E. J. Bunce (2001), Origin of the main auroral oval in Jupiter’s coupled 307
magnetosphere-ionosphere system, Planet. Space Sci., 49, 1067–1088. 308
de Kleer, K., and I. de Pater (2016), Time variability of Io's volcanic activity from near-IR adaptive 309
optics observations on 100 nights in 2013–2015, Icarus, 280, 378-404. 310
Gérard, J.-C., B.Bonfond, D.Grodent, and A.Radioti (2016), The color ratio-intensity relation in the 311
Jovian aurora: Hubble observations of auroral components, Planet. Space Sci., 131, 13–23. 312
Gustin, J., J.-C. Gérard, D. Grodent, S. W. H. Cowley, J. T. Clarke, and A. Grard (2004), 313
Energy-flux relationship in the FUV Jovian aurora deduced from HST-STIS spectral observations, 314
J. Geophys. Res., 109, A10205, doi:10.1029/2003JA010365. 315
Hill, T. W. (1979),Inertial limit on corotation, J. Geophys. Res., 84(A11), 6554–6558. 316
Hill, T. W. (2001), The Jovian auroral oval, J. Geophys. Res., 106(A5), 8101–8107. 317
Huddleston, D. E., C. T. Russell, M. G. Kivelson, K. K. Khurana, and L. Bennett (1998), The 318
location of the Jovian bow shock and magnetopause: Galileo initial results, Adv. Space Res., 21, 319
Kagitani, M., M. Yoneda, R. Koga, F. Tsuchiya, K. Yoshioka, G. Murakami, T. Kimura, I. 321
Yoshikawa (2017), Variation of ion and electron temperature on Io plasma torus during an 322
outburst measured with Hisaki/EXCEED and gourd-based telescope, Magnetospheres of the 323
Outer Planets (MOP) conference abstract. 324
Khurana, K. K. (2001), Influence of solar wind on Jupiter's magnetosphere deduced from currents in 325
the equatorial plane, J. Geophys. Res., 106(A11), 25999–26016, doi:10.1029/2000JA000352. 326
Kimura, T., et al. (2015), Transient internally driven aurora at Jupiter discovered by Hisaki and the 327
Hubble Space Telescope, Geophys. Res. Lett., 42, doi:10.1002/2015GL063272. 328
Kita, H., et al. (2016), Characteristics of solar wind control on Jovian UV auroral activity deciphered 329
by long-term Hisaki EXCEED observations: Evidence of preconditioning of the magnetosphere?, 330
Geophys. Res. Lett., 43, 6790–6798, doi:10.1002/2016GL069481. 331
Koga, R., F. Tsuchiya, M. Kagitani, T. Sakanoi, M. Yoneda, K. Yoshioka, T. Kimura, G. Murakami, 332
A. Yamazaki, I. Yoshikawa, and H. Todd Smith (2018), The time variation of atomic oxygen 333
emission around Io during a volcanic event observed with Hisaki/EXCEED, Icarus, 299, 300– 334
307. 335
Nichols, J. D. (2011), Magnetosphere-ionosphere coupling in Jupiter's middle magnetosphere: 336
Computations including a self-consistent current sheet magnetic field model, J. Geophys. Res.,
337
116, A10232, doi:10.1029/2011JA016922. 338
Nichols, J. D., and S. W. H. Cowley (2005), Magnetosphere-ionosphere coupling currents in Jupiter's 339
middle magnetosphere: Effect of magnetosphere-ionosphere decoupling by field-aligned auroral 340
Tao, C., R. Kataoka, H. Fukunishi, Y. Takahashi, and T. Yokoyama (2005), Magnetic field 342
variations in the Jovian magnetotail induced by solar wind dynamic pressure enhancements, J.
343
Geophys. Res., 110, A11208, doi:10.1029/2004JA010959. 344
Tao, C., H. Fujiwara, and Y. Kasaba (2010), Jovian magnetosphere-ionosphere current system 345
characterized by diurnal variation of ionospheric conductance, Planet. Space Sci., 58, 351–364, 346
doi:10.1016/j.pss.2009.10.005. 347
Tao, C., et al. (2016a), Variation of Jupiter's aurora observed by Hisaki/EXCEED: 1. Observed 348
characteristics of the auroral electron energies compared with observations performed using 349
HST/STIS, J. Geophys. Res. Space Physics, 121, 4041–4054, doi:10.1002/2015JA021271. 350
Tao, C., T. Kimura, S. V. Badman, N. André, F. Tsuchiya, G. Murakami, K. Yoshioka, I. Yoshikawa, 351
A. Yamazaki, and M. Fujimoto (2016b), Variation of Jupiter's aurora observed by 352
Hisaki/EXCEED: 2. Estimations of auroral parameters and magnetospheric dynamics, J. Geophys.
353
Res. Space Physics, 121, 4055–4071, doi:10.1002/2015JA021272. 354
Tsuchiya, F. et al. (2017), Enhancement of Jovian magnetospheric plasma circulation due to mass 355
supply change from the satellite Io, Magnetospheres of the Outer Planets (MOP) abstract. 356
Yamazaki, A. et al. (2014), Field-of-view guiding camera on the HISAKI (SPRINT-A) satellite, 357
Space Sci. Rev., 184, 1–4, 259–274, DOI:10.1007/s11214-014-0106-y. 358
Yoneda, M., M. Kagitani and S. Okano (2009), Short-term variation of Jupiter's extended sodium 359
nebula, Icarus, 204, 589–596. 360
Yoneda, M., F. Tsuchiya, H. Misawa, Bonfond B., Tao C., M. Kagitani and S. Okano (2013), Io's 361
volcanism controls Jupiter's radio emissions, Geophys. Res. Lett., 40, 671–675, 362
Yoneda, M., M. Kagitani, F. Tsuchiya, T. Sakanoi, and S. Okano (2015), Brightening event seen in 364
observations of Jupiter’s extended sodium nebula, Icaurs, 261, 31–33 365
Yoshikawa, I. et al. (2014), Extreme ultraviolet radiation measurement for planetary 366
atmospheres/magnetospheres from the earth-orbiting spacecraft (Extreme Ultraviolet 367
Spectroscope for Exospheric Dynamics: EXCEED), Space Sci. Rev., 184, 1–4, 237–258, 368
DOI:10.1007/s11214-014-0077-z. 369
Yoshikawa, I. et al. (2017), Volcanic activity on Io and its influence on the dynamics of the Jovian 370
magnetosphere observed by EXCEED/Hisaki in 2015, Earth, Planets and Space--Frontier Letter,
371
69, 110, doi:10.1186/s40623-017-0700-9. 372
Yoshioka, K. et al. (2013), The extreme ultraviolet spectroscope for planetary science, EXCEED, 373
Planet. Space Sci., 85, 250–260. 374
Yoshioka, K., et al. (2017), Radial variation of sulfur and oxygen ions in the Io plasma torus as 375
deduced from remote observations by Hisaki, J. Geophys. Res. Space Physics, 122, 2999–3012, 376
doi:10.1002/2016JA023691. 377
378
380 381
Figure 1. Time variations of the auroral powers emitted at wavelength (a) 138.5–144.8 nm, (b) 382
appearance normalized total unabsorbed H2 power over wavelength 70–180 nm, (c) maximum 383
field-aligned current that can be carried by precipitating magnetospheric electrons without 384
field-aligned acceleration, shown for the electron temperature kBT0 = 2.5 keV case, (d) IPT SII 385
emission (see Yoshikawa et al. [2017] for detail), and (e) solar wind dynamic pressure for season 386
on the photon statistics. Solar wind input data in season 2015 are not complete, which would affect 388
the output grey points in Figure 1e. 389
390 391
Figure 2. (a) CREXCEED as a function of CML in system III, and time variations of (b) the power 392
emitted at the wavelength 138.5–144.8 nm, (c) CREXCEED, and (d) auroral electron flux for season 393
2015. Blue (red) points in Figure 2a are observed on DOY -5–25 (45–75) in 2015, and diamonds 394
(crosses) are mean values over 10-degree binned CML with error bars showing variances. In Figures 395
2b–2d, the enhancement event (EV) and backgrounds (BG) are shown by red and black points, 396
respectively, and 10-day running average of EV and BG are shown by orange and green marks, 397
respectively. 45 GW threshold is shown by grey line in Figure 2b. Corresponding auroral electron 398
400
401
402
403 404
Figure 3. Relationship between the mean energy and energy flux of the precipitating auroral 405
electrons estimated from 10-min integrated observations shown as (a) a scatter plot using data during 406
the quiet (black dots) and active (orange dots) volcanic periods in season 2015, and occurrence map 407
for the (b) quiet and (c) active volcanic periods separately. Grey lines in Figure 3a are error bars, and 408
mean energy and energy flux distributions are plotted as histograms normalized by maximum 409
occurrence values in the right and upper panels, respectively, for each period separately. The Knight 410
relation is shown for different source populations: N0=0.0027 cm-3 (solid lines), N0=0.0019 cm-3 411
(dotted lines), N0=0.001 cm-3 (dashed lines), and N0=0.01 cm-3 (dotted-dashed lines) [e.g., Gustin et 412
compared with the value derived from the observation, Robs, and (e) histogram of Robs/Rmodel whose 414
solar wind pressure >0.1 nPa. Colour indicates different periods: 2014 seasons (blue), before the Io 415
volcanic active in 2015 (green), and during the active time (red), and sum of them (black in Figure 416
3e). Large diamonds in Figure 3d show the cases whose dynamic pressure reach >0.1 nPa, dashed 417
line shows Robs/Rmodel=1, and dotted lines show Robs/Rmodel=2, 3, and 5. 418
419
420
421 422 423
Table 1. Medians and standard deviations of key parameters during each period. 424
425
427
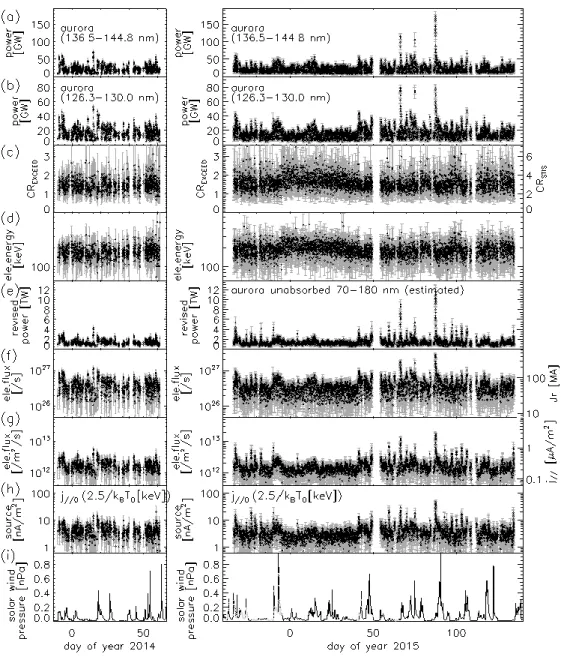
Figure S1. Time variations of the auroral parameters in the same format of Figure 4 of Paper II for 428
seasons 2014 and 2015. From top to bottom, auroral powers emitted at wavelength (a) 138.5–144.8 429
nm and (b) 126.3–130 nm, (c) CREXCEED, (d) auroral electron energy, (e) appearance normalized total 430
unabsorbed H2 power over wavelength 70–180 nm, (f) auroral electron flux and (g) flux density, (h) 431
maximum field-aligned current that can be carried by precipitating magnetospheric electrons without 432
field-aligned acceleration, shown for the electron temperature kBT0 = 2.5 keV case, and (i) solar wind 433
CRSTIS≡I155–162 nm/I123–130 nm, total current, and current density are shown on the right-hand y-axes of 435
Figures S1c, S1f, and S1g, respectively. Other formats are the same with the Figure 1. 436