Proceedings of the 2007 Joint Conference on Empirical Methods in Natural Language Processing and Computational
Improving Translation Quality by Discarding Most of the Phrasetable
J Howard Johnson and Joel Martin
Interactive Information Group National Research Council Canada
Ottawa, Ontario, Canada [email protected]
George Foster and Roland Kuhn
Interactive Language Technologies Group National Research Council Canada
Gatineau, Qu´ebec, Canada [email protected]
Abstract
It is possible to reduce the bulk of phrase-tables for Statistical Machine Translation us-ing a technique based on the significance testing of phrase pair co-occurrence in the parallel corpus. The savings can be quite substantial (up to 90%) and cause no reduc-tion in BLEU score. In some cases, an im-provement in BLEU is obtained at the same time although the effect is less pronounced if state-of-the-art phrasetable smoothing is employed.
1 Introduction
An important part of the process of Statistical Ma-chine Translation (SMT) involves inferring a large table of phrase pairs that are translations of each other from a large corpus of aligned sentences. These phrase pairs together with estimates of con-ditional probabilities and useful feature weights, called collectively aphrasetable, are used to match a source sentence to produce candidate translations. The choice of the best translation is made based on the combination of the probabilities and feature weights, and much discussion has been made of how to make the estimates of probabilites, how to smooth these estimates, and what features are most useful for discriminating among the translations.
However, a cursory glance at phrasetables pro-duced often suggests that many of the translations are wrong or will never be used in any translation. On the other hand, most obvious ways of reducing the bulk usually lead to a reduction in translation
quality as measured by BLEU score. This has led to an impression that these pairs must contribute some-thing in the grand scheme of some-things and, certainly, more data is better than less.
Nonetheless, this bulk comes at a cost. Large ta-bles lead to large data structures that require more resources and more time to process and, more im-portantly, effort directed in handling large tables could likely be more usefully employed in more fea-tures or more sophisticated search.
In this paper, we show that it is possible to prune phrasetables using a straightforward approach based on significance testing, that this approach does not adversely affect the quality of translation as mea-sured by BLEU score, and that savings in terms of number of discarded phrase pairs can be quite sub-stantial. Even more surprising, pruning can actu-ally raise the BLEU score although this phenomenon is less prominent if state of the art smoothing of phrasetable probabilities is employed.
Section 2 reviews the basic ideas of Statistical Machine Translation as well as those of testing sig-nificance of associations in two by two contingency tables departing from independence. From this, a filtering algorithm will be described that keeps only phrase pairs that pass a significance test. Section 3 outlines a number of experiments that demonstrate the phenomenon and measure its magnitude. Sec-tion 4 presents the results of these experiments. The paper concludes with a summary of what has been learned and a discussion of continuing work that builds on these ideas.
2 Background Theory
2.1 Our Approach to Statistical Machine Translation
We define a phrasetable as a set of source phrases (n -grams) ˜sand their translations (m-grams) ˜t, along with associated translation probabilities p(˜s|˜t) and p(˜t|˜s). These conditional distributions are derived from the joint frequencies c(˜s,˜t) of source / tar-getn, m-grams observed in a word-aligned parallel corpus. These joint counts are estimated using the phrase induction algorithm described in (Koehn et al., 2003), with symmetrized word alignments gen-erated using IBM model 2 (Brown et al., 1993). Phrases are limited to 8 tokens in length (n, m≤8). Given a source sentences, our phrase-based SMT system tries to find the target sentenceˆt that is the most likely translation ofs. To make search more efficient, we use the Viterbi approximation and seek the most likely combination oftand its alignmenta
withs, rather than just the most likelyt:
ˆt= argmax t
p(t|s)≈argmax t,a
p(t,a|s),
wherea = (˜s1,˜t1, j1), ...,(˜sK,t˜K, jK); ˜tk are
tar-get phrases such that t = ˜t1...˜tK; sk˜ are source phrases such thats = ˜sj1...sj˜K; and˜sk is the trans-lation of thekth target phraset˜k.
To model p(t,a|s), we use a standard loglinear approach:
p(t,a|s)∝exp "
X
i
λifi(s,t,a) #
where each fi(s,t,a) is a feature function, and
weights λi are set using Och’s algorithm (Och,
2003) to maximize the system’s BLEU score (Pa-pineni et al. , 2001) on a development corpus. The features used are: the length oft; a single-parameter distortion penalty on phrase reordering ina, as de-scribed in (Koehn et al., 2003); phrase translation model probabilities; and 4-gram language model probabilities logp(t), using Kneser-Ney smooth-ing as implemented in the SRILM toolkit (Stolcke, 2002).
Phrase translation model probabilities are features of the form:
logp(s|t,a)≈
K X
k=1
logp(˜sk|˜tk)
i.e., we assume that the phrasess˜kspecified byaare
conditionally independent, and depend only on their aligned phrases˜tk.
The “forward” phrase probabilitiesp(˜t|s˜)are not used as features, but only as a filter on the set of possible translations: for each source phrase s˜that matches some ngram in s, only the 30 top-ranked translations ˜taccording top(˜t|s˜)are retained. One of the reviewers has pointed out correctly that tak-ing only the top 30 translations will interact with the subject under study; however, this pruning technique has been used as a way of controlling the width of our beam search and rebalancing search parameters would have complicated this study and taken it away from our standard practice.
The phrase translation model probabilities are smoothed according to one of several techniques as described in (Foster et al., 2006) and identified in the discussion below.
2.2 Significance testing using two by two contingency tables
Each phrase pair can be thought of as amn, m-gram (˜s,˜t)where˜sis an n-gram from the source side of the corpus and˜tis anm-gram from the target side of the corpus.
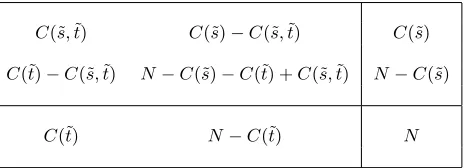
We then define: C(˜s,˜t)as the number of parallel sentences that contain one or more occurrences of ˜
son the source side andt˜on the target side; C(˜s) the number of parallel sentences that contain one or more occurrences of˜son the source side; andC(˜t) the number of parallel sentences that contain one or more occurrences of ˜ton the target side. Together with N, the number of parallel sentences, we have enough information to draw up a two by two contin-gency table representing the unconditional relation-ship betweens˜and˜t. This table is shown in Table 1.
A standard statistical technique used to assess the importance of an association represented by a con-tingency table involves calculating the probability that the observed table or one that is more extreme could occur by chance assuming a model of inde-pendence. This is called a significance test. Intro-ductory statistics texts describe one such test called the Chi-squared test.
Table 1: Two by two contingency table fors˜andt˜
C(˜s,˜t) C(˜s)−C(˜s,˜t) C(˜s)
C(˜t)−C(˜s,t)˜ N−C(˜s)−C(˜t) +C(˜s,˜t) N−C(˜s)
C(˜t) N−C(˜t) N
In particular, Fisher’s exact test calculates probabil-ity of the observed table using the hypergeometric distibution.
ph(C(˜s,˜t)) =
C(˜s) C(˜s,˜t)
N −C(˜s) C(˜t)−C(˜s,˜t)
N C(˜t)
The p-value associated with our observed table is then calculated by summing probabilities for tables that have a largerC(˜s,˜t)).
p-value(C(˜s,t˜)) = ∞
X
k=C(˜s,˜t)
ph(k)
This probability is interpreted as the probability of observing by chance an association that is at least as strong as the given one and hence its significance. Agresti (1996) provides an excellent introduction to this topic and the general ideas of significance test-ing in conttest-ingency tables.
Fisher’s exact test of significance is considered a gold standard since it represents the precise proba-bilities under realistic assumptions. Tests such as the Chi-squared test or the log-likelihood-ratio test (yet another approximate test of significance) depend on asymptotic assumptions that are often not valid for small counts.
Note that the count C(˜s,t˜) can be larger or smaller thanc(˜s,t˜)discussed above. In most cases, it will be larger, because it counts all co-occurrences of s˜ with t˜rather than just those that respect the word alignment. It can be smaller though because multiple co-occurrences can occur within a single aligned sentence pair and be counted multiple times inc(˜s,t˜). On the other hand,C(˜s,˜t)will not count
all of the possible ways that ann, m-gram match can occur within a single sentence pair; it will count the match only once per sentence pair in which it occurs. Moore (2004) discusses the use of signifi-cance testing of word associations using the log-likelihood-ratio test and Fisher’s exact test. He shows that Fisher’s exact test is often a practical method if a number of techniques are followed:
1. approximating the logarithms of factorials us-ing commonly available numerical approxima-tions to the log gamma function,
2. using a well-known recurrence for the hyperge-ometic distribution,
3. noting that few terms usually need to be summed, and
4. observing that convergence is usually rapid.
2.3 Significance pruning
The idea behind significance pruning of phrasetables is that not all of the phrase pairs in a phrasetable are equally supported by the data and that many of the weakly supported pairs could be removed because:
1. the chance of them occurring again might be low, and
2. their occurrence in the given corpus may be the result of an artifact (a combination of effects where several estimates artificially compensate for one another). This concept is usually re-ferred to as overfit since the model fits aspects of the training data that do not lead to improved prediction.
be beneficial in terms of reducing the size of data structures. This will be shown to be the case in rather general terms.
Note that this pruning may and quite often will remove all of the candidate translations for a source phrase. This might seem to be a bad idea but it must be remembered that deleting longer phrases will al-low combinations of shorter phrases to be used and these might have more and better translations from the corpus. Here is part of the intuition about how phrasetable smoothing may interact with phrasetable pruning: both are discouraging longer but infrequent phrases from the corpus in favour of combinations of more frequent, shorter phrases.
Because the probabilities involved below will be so incredibly tiny, we will work instead with the neg-ative of the natural logs of the probabilities. Thus instead of selecting phrase pairs with a p-value less than exp(−20), we will select phrase pairs with a negative-log-p-value greater than 20. This has the advantage of working with ordinary-sized numbers and the happy convention that bigger means more pruning.
2.4 C(˜s,˜t) = 1, 1-1-1 Tables and theα
Threshold
An important special case of a table occurs when a phrase pair occurs exactly once in the corpus, and each of the component phrases occurs exactly once in its side of the parallel corpus.
These phrase pairs will be referred to as 1-1-1 phrase pairs and the corresponding tables will be called 1-1-1 contingency tables becauseC(˜s) = 1,
C(˜t) = 1, andC(˜s,˜t) = 1.
Moore (2004) comments that the p-value for these tables under Fisher’s exact test is1/N. Since we are using thresholds of the negative logarithm of the p-value, the valueα=log(N)is a useful threshold to consider.
In particular, α+(where is an appropriately small positive number) is the smallest threshold that results in none of the 1-1-1 phrase pairs being in-cluded. Similarly,α−is the largest threshold that results in all of the 1-1-1 phrase pairs being included. Because 1-1-1 phrase pairs can make up a large part of the phrase table, this is important observation for its own sake.
Since the contingency table withC(˜s,˜t) = 1
hav-ing the greatest significance (lowest p-value) is the 1-1-1 table, using the threshold ofα+can be used to exclude all of the phrase pairs occurring exactly once (C(˜s,˜t) = 1).
The common strategy of deleting all of the 1-count phrase pairs is very similar in effect to the use of theα+threshold.
3 Experiments
3.1 WMT06
The corpora used for most of these experiments are publicly available and have been used for a num-ber of comparative studies (Workshop on Statisti-cal Machine Translation, 2006). Provided as part of the materials for the shared task are parallel corpora for French–English, Spanish–English, and German– English as well as language models for English, French, Spanish, and German. These are all based on the Europarl resources (Europarl, 2003).
The only change made to these corpora was to convert them to lowercase and to Unicode UTF-8. Phrasetables were produced by symmetrizing IBM2 conditional probabilities as described above.
The phrasetables were then used as a list of
n, m-grams for which counts C(˜s,˜t), C(˜s), and
C(˜t) were obtained. Negative-log-p-values under Fisher’s exact test were computed for each of the phrase pairs in the phrasetable and the entry was censored if the negative-log-p-value for the test was below the pruning threshold. The entries that are kept are ones that are highly significant.
A number of combinations involving many differ-ent pruning thresholds were considered: no pruning, 10,α−,α+, 15, 20, 25, 50, 100, and 1000. In ad-dition, a number of different phrasetable smoothing algorithms were used: no smoothing, Good-Turing smoothing, Kneser-Ney 3 parameter smoothing and the loglinear mixture involving two features called Zens-Ney (Foster et al., 2006).
3.2 Chinese
1000 100
10 1
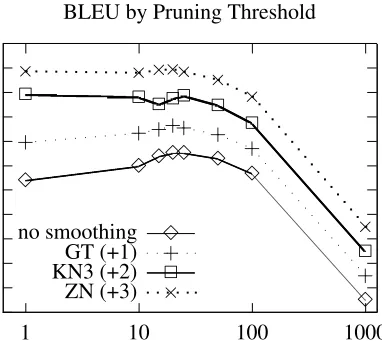
BLEU by Pruning Threshold
no smoothing
3 3 333 3 3
3 3
GT (+1)
+ + +++ + +
+ +
KN3 (+2)
2 2 222 2 2
2 2
ZN (+3)
× × ××× ×
×
×
×
107
106
105
1000 100
10 1
Phrasetable Size by Pruning Threshold
size 3 3
333 3
3
3 3
107 106
105
BLEU by Phrasetable Size
no smoothing
3 3 3
3 3 3 3
3
3 GT (+1)
+ + +
+ + + +
+
+ KN3 (+2)
2 2 2
2 2 2 2
2
2 ZN (+3)
× × ×
× × × ×
×
×
[image:5.612.82.282.55.653.2]Figure 1: WMT06: Results for French−→English. [to separate the curves, graphs for smoothed meth-ods are shifted by +1, +2, or +3 BLEU points]
Table 2: Corpus Sizes andαValues
number of parallel sentences α
WMT06: fr←→en 688,031 13.4415892 WMT06: es←→en 730,740 13.501813 WMT06: de←→en 751,088 13.5292781 Chinese–English: best 3,164,228 14.9674197 Chinese–English: UN-v2 4,979,345 15.4208089
Zens-Ney and separated our corpus into two phrase-tables, one based on the UN corpus and the other based on the best of the remaining parallel corpora available to us.
Different pruning thresholds were considered: no pruning, 14, 16, 18, 20, and 25. In addition, another more aggressive method of pruning was attempted. Moore points out, correctly, that phrase pairs that oc-cur in only one sentence pair, (C(˜s,t˜) = 1), are less reliable and might require more special treatment. These are all pruned automatically at thresholds of 16 and above but not at threshold of 14. A spe-cial series of runs was done for threshold 14 with all of these singletons removed to see whether at these thresholds it was the significance level or the prun-ing of phrase pairs with (C(˜s,˜t) = 1) that was more important. This is identified as140 in the results.
4 Results
The results of the experiments are described in Ta-bles 2 through 6.
Table 2 presents the sizes of the various parallel corpora showing the number of parallel sentences,
N, for each of the experiments, together with theα
thresholds (α=log(N)).
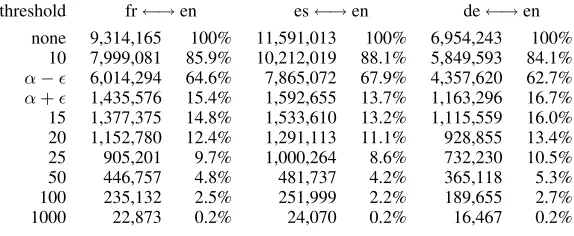
Table 3 shows the sizes of the phrasetables that result from the various pruning thresholds described for the WMT06 data. It is clear that this is extremely aggressive pruning at the given levels.
Table 4 shows the corresponding phrasetable sizes for the large corpus Chinese–English data. The pruning is not as aggressive as for the WMT06 data but still quite sizeable.
[image:5.612.82.273.70.246.2]Table 3: WMT06: Distinct phrase pairs by pruning threshold
threshold fr←→en es←→en de←→en
none 9,314,165 100% 11,591,013 100% 6,954,243 100% 10 7,999,081 85.9% 10,212,019 88.1% 5,849,593 84.1% α− 6,014,294 64.6% 7,865,072 67.9% 4,357,620 62.7% α+ 1,435,576 15.4% 1,592,655 13.7% 1,163,296 16.7% 15 1,377,375 14.8% 1,533,610 13.2% 1,115,559 16.0% 20 1,152,780 12.4% 1,291,113 11.1% 928,855 13.4% 25 905,201 9.7% 1,000,264 8.6% 732,230 10.5% 50 446,757 4.8% 481,737 4.2% 365,118 5.3% 100 235,132 2.5% 251,999 2.2% 189,655 2.7%
[image:6.612.199.409.253.355.2]1000 22,873 0.2% 24,070 0.2% 16,467 0.2%
Table 4: Chinese–English: Distinct phrase pairs by pruning threshold
threshold best UN-v2
none 18,858,589 100% 20,228,273 100% 14 7,666,063 40.7% 13,276,885 65.6% 16 4,280,845 22.7% 7,691,660 38.0% 18 4,084,167 21.7% 7,434,939 36.8% 20 3,887,397 20.6% 7,145,827 35.3% 25 3,403,674 18.0% 6,316,795 31.2%
also pruningC(˜s,˜t) = 1
140 4,477,920 23.7% 7,917,062 39.1%
that an artificial separation of 1 BLEU point has been introduced into these graphs to separate them. Without this, they lie on top of each other and hide the essential point. In compensation, the scale for the BLEU co-ordinate has been removed.
These results are summarized in the following subsections.
4.1 BLEU as a function of threshold
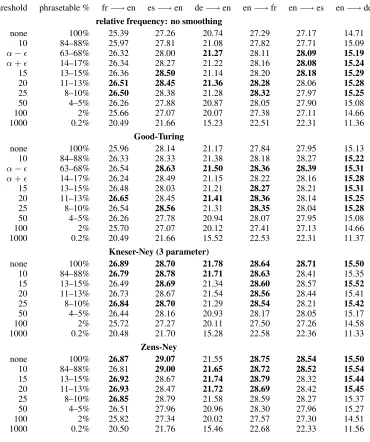
In tables 5 and 6, the largest BLEU score for each set of runs has been marked in bold font. In addition, to highlight that there are many near ties for largest BLEU, all BLEU scores that are within 0.1 of the best are also marked in bold.
When this is done it becomes clear that pruning at a level of20for the WMT06 runs would not re-duce BLEU in most cases and in many cases would actually increase it. A pruning threshold of20 cor-responds to discarding roughly90% of the phrase-table.
For the Chinese–English large corpus runs, a level of16 seems to be about the best with a small in-crease in BLEU and a60%−70%reduction in the size of the phrasetable.
4.2 BLEU as a function of depth of pruning
Another view of this can be taken from Tables 5 and 6. The fraction of the phrasetable retained is a more or less simple function of pruning threshold as shown in Tables 3 and 4. By including the per-centages in Tables 5 and 6, we can see that BLEU goes up as the fraction approaches between20%and 30%.
This seems to be a relatively stable observation across the experiments. It is also easily explained by its strong relationship to pruning threshold.
4.3 Large corpora
Table 6 shows that this is not just a small corpus phe-nomenon. There is a sizeable benefit both in phrase-table reduction and a modest improvement to BLEU even in this case.
4.4 Is this just the same as phrasetable smoothing?
It appears that the answer is, in the main, yes, al-though there is definitely something else going on. It is true that the benefit in terms of BLEU is less-ened for better types of phrasetable smoothing but the benefit in terms of the reduction in bulk holds. It is reassuring to see that no harm to BLEU is done by removing even80%of the phrasetable.
4.5 Comment aboutC(˜s,˜t) = 1
Another question that came up is the role of phrase pairs that occur only once:C(˜s,˜t) = 1. In particu-lar as discussed above, the most significant of these are the 1-1-1 phrase pairs whose components also only occur once: C(˜s) = 1, andC(˜t) = 1. These phrase pairs are amazingly frequent in the phrase-tables and are pruned in all of the experiments ex-cept when pruning threshold is equal to 14.
The Chinese–English large corpus experiments give us a good opportunity to show that significance level seems to be more an issue than the case that
C(˜s,˜t) = 1.
Note that we could have kept the phrase pairs whose marginal counts were greater than one but most of these are of lower significance and likely are pruned already by the threshold. The given con-figuration was considered the most likely to yield a benefit and its poor performance led to the whole idea being put aside.
5 Conclusions and Continuing Work
To sum up, the main conclusions are five in number:
1. Phrasetables produced by the standard Diag-And method (Koehn et al., 2003) can be aggres-sively pruned using significance pruning with-out worsening BLEU.
2. If phrasetable smoothing is not done, the BLEU score will improve under aggressive signifi-cance pruning.
3. If phrasetable smoothing is done, the improve-ment is small or negligible but there is still no loss on aggressive pruning.
4. The preservation of BLEU score in the pres-ence of large-scale pruning is a strong effect in small and moderate size phrasetables, but oc-curs also in much larger phrasetables.
5. In larger phrasetables based on larger corpora, the percentage of the table that can be dis-carded appears to decrease. This is plausible since a similar effect (a decrease in the benefit of smoothing) has been noted with phrasetable smoothing (Foster et al., 2006). Together these results suggest that, for these corpus sizes, the increase in the number of strongly supported phrase pairs is greater than the increase in the number of poorly supported pairs, which agrees with intuition.
Although there may be other approaches to prun-ing that achieve a similar effect, the use of Fisher’s exact test is mathematically and conceptually one of the simplest since it asks a question separately for each phrase pair: “Considering this phase pair in isolation of any other analysis on the corpus, could it have occurred plausibly by purely random processes inherent in the corpus construction?” If the answer is “Yes”, then it is hard to argue that the phrase pair is an association of general applicability from the evidence in this corpus alone.
Note that the removal of 1-count phrase pairs is subsumed by significance pruning with a threshold greater than α and many of the other simple ap-proaches (from an implementation point of view) are more difficult to justify as simply as the above significance test. Nonetheless, there remains work to do in determining if computationally simpler ap-proaches do as well. Moore’s work suggests that log-likelihood-ratio would be a cheaper and accurate enough alternative, for example.
We will now return to the interaction of the se-lection in our beam search of the top 30 candidates based on forward conditional probabilities. This will affect our results but most likely in the following manner:
1. For very small thresholds, the beam will be-come much wider and the search will take much longer. In order to allow the experiments to complete in a reasonable time, other means will need to be employed to reduce the choices. This reduction will also interact with the sig-nificance pruning but in a less understandable manner.
choices and so there will be no effect.
3. For intermediate thresholds, the extra prun-ing might reduce BLEU score but by a small amount because most of the best choices are included in the search.
Using thresholds that remove most of the phrase-table would no doubt qualify as large thresholds so the question is addressing the true shape of the curve for smaller thresholds and not at the expected operat-ing levels. Nonetheless, this is a subject for further study, especially as we consider alternatives to our “filter 30” approach for managing beam width.
There are a number of important ways that this work can and will be continued. The code base for taking a list of n, m-grams and computing the re-quired frequencies for signifance evaluation can be applied to related problems. For example, skip-n -grams (n-grams that allow for gaps of fixed or vari-able size) may be studied better using this approach leading to insight about methods that weakly ap-proximate patterns.
The original goal of this work was to better un-derstand the character of phrasetables, and it re-mains a useful diagnostic technique. It will hope-fully lead to more understanding of what it takes to make a good phrasetable especially for languages that require morphological analysis or segmentation to produce good tables using standard methods.
The negative-log-p-value promises to be a useful feature and we are currently evaluating its merits.
6 Acknowledgement
This material is based upon work supported by the Defense Advanced Research Projects Agency (DARPA) under Contract No. HR0011-06-C-0023. Any opinions, findings and conclusions or recom-mendations expressed in this material are those of the authors and do not necessarily reflect the views of the Defense Advanced Research Projects Agency (DARPA).”
References
Alan Agresti. 1996. An Introduction to Categorical Data Analysis. Wiley.
Peter F. Brown, Stephen A. Della Pietra, Vincent J. Della Pietra and Robert L. Mercer. 1993. The Mathemat-ics of Statistical Machine Translation: Parameter
es-timation. Computational Linguistics, 19(2):263–312,
June.
Philipp Koehn 2003. Europarl: A
Mul-tilingual Corpus for Evaluation of
Ma-chine Translation. Unpublished draft. see
http://www.iccs.inf.ed.ac.uk/˜pkoehn /publications/europarl.pdf
George Foster, Roland Kuhn, and Howard Johnson. 2006. Phrasetable Smoothing for Statistical Machine
Translation. InProceedings of the 2006 Conference
on Empirical Methods in Natural Language Process-ing, Sydney, Australia.
Reinhard Kneser and Hermann Ney. 1995. Improved
backing-off for m-gram language modeling. In
Pro-ceedings of the International Conference on Acoustics, Speech, and Signal Processing (ICASSP) 1995, pages 181–184, Detroit, Michigan. IEEE.
Philipp Koehn, Franz Josef Och, and Daniel Marcu. 2003. Statistical phrase-based translation. In Eduard
Hovy, editor, Proceedings of the Human Language
Technology Conference of the North American Chap-ter of the Association for Computational Linguistics,
pages 127–133, Edmonton, Alberta, Canada, May.
NAACL.
Robert C. Moore. 2004. On Log-Likelihood-Ratios and
the Significance of Rare Events. In Proceedings of
the 2004 Conference on Empirical Methods in Natu-ral Language Processing, Barcelona, Spain.
NIST. 2006. NIST MT Benchmark Test. see
http://www.nist.gov/speech/tests/mt/
Franz Josef Och. 2003. Minimum error rate training for
statistical machine translation. InProceedings of the
41th Annual Meeting of the Association for Computa-tional Linguistics(ACL), Sapporo, July.
Kishore Papineni, Salim Roukos, Todd Ward, and
Wei-Jing Zhu. 2001. BLEU: A method for automatic
evaluation of Machine Translation. Technical Report RC22176, IBM, September.
NAACL Workshop on Statistical Machine Translation.
2006. seehttp://www.statmt.org/wmt06/
Andreas Stolcke. 2002. SRILM - an extensible language
modeling toolkit. In Proceedings of the 7th
Inter-national Conference on Spoken Language Processing (ICSLP) 2002, Denver, Colorado, September.
Richard Zens and Hermann Ney. 2004. Improvements in
phrase-based statistical machine translation. In
Table 5: WMT06 Results: BLEU by type of smoothing and pruning threshold
threshold phrasetable % fr−→en es−→en de−→en en−→fr en−→es en−→de relative frequency: no smoothing
none 100% 25.39 27.26 20.74 27.29 27.17 14.71
10 84–88% 25.97 27.81 21.08 27.82 27.71 15.09
α− 63–68% 26.32 28.00 21.27 28.11 28.09 15.19
α+ 14–17% 26.34 28.27 21.22 28.16 28.08 15.24
15 13–15% 26.36 28.50 21.14 28.20 28.18 15.29
20 11–13% 26.51 28.45 21.36 28.28 28.06 15.28
25 8–10% 26.50 28.38 21.28 28.32 27.97 15.25
50 4–5% 26.26 27.88 20.87 28.05 27.90 15.08
100 2% 25.66 27.07 20.07 27.38 27.11 14.66
1000 0.2% 20.49 21.66 15.23 22.51 22.31 11.36
Good-Turing
none 100% 25.96 28.14 21.17 27.84 27.95 15.13
10 84–88% 26.33 28.33 21.38 28.18 28.27 15.22
α− 63–68% 26.54 28.63 21.50 28.36 28.39 15.31
α+ 14–17% 26.24 28.49 21.15 28.22 28.16 15.28
15 13–15% 26.48 28.03 21.21 28.27 28.21 15.31
20 11–13% 26.65 28.45 21.41 28.36 28.14 15.25
25 8–10% 26.54 28.56 21.31 28.35 28.04 15.28
50 4–5% 26.26 27.78 20.94 28.07 27.95 15.08
100 2% 25.70 27.07 20.12 27.41 27.13 14.66
1000 0.2% 20.49 21.66 15.52 22.53 22.31 11.37
Kneser-Ney (3 parameter)
none 100% 26.89 28.70 21.78 28.64 28.71 15.50
10 84–88% 26.79 28.78 21.71 28.63 28.41 15.35
15 13–15% 26.49 28.69 21.34 28.60 28.57 15.52
20 11–13% 26.73 28.67 21.54 28.56 28.44 15.41
25 8–10% 26.84 28.70 21.29 28.54 28.21 15.42
50 4–5% 26.44 28.16 20.93 28.17 28.05 15.17
100 2% 25.72 27.27 20.11 27.50 27.26 14.58
1000 0.2% 20.48 21.70 15.28 22.58 22.36 11.33
Zens-Ney
none 100% 26.87 29.07 21.55 28.75 28.54 15.50
10 84–88% 26.81 29.00 21.65 28.72 28.52 15.54
15 13–15% 26.92 28.67 21.74 28.79 28.32 15.44
20 11–13% 26.93 28.47 21.72 28.69 28.42 15.45
25 8–10% 26.85 28.79 21.58 28.59 28.27 15.37
50 4–5% 26.51 27.96 20.96 28.30 27.96 15.27
100 2% 25.82 27.34 20.02 27.57 27.30 14.51
1000 0.2% 20.50 21.76 15.46 22.68 22.33 11.56
Table 6: Chinese Results: BLEU by pruning threshold
threshold phrasetable % nist04 nist05 nist06-GALE nist06-NIST Zens-Ney Smoothing applied to all phrasetables
none 100% 32.14 30.69 13.06 27.97
14 40–65% 32.66 31.14 13.11 28.35
16 22–38% 32.73 30.97 13.14 28.00
18 21–36% 31.56 30.45 12.49 27.03
20 20–35% 32.00 30.73 12.50 27.33
25 18–31% 30.54 29.58 11.68 26.12
also pruningC(˜s,˜t) = 1