warwick.ac.uk/lib-publications
Original citation:
Barai, Anup, Rajan, Ashwin T., Christos, Iraklis, McGordon, Andrew and Jennings, P. A. (Paul
A.) (2017) Scale-up of lithium-ion battery model parameters from cell level to module level –
identification of current issues. In: The International Conference series on Alternative Energy
in Developing Countries and Emerging Economies (AEDCEE), Bangkok, Thailand, 25-26 May
2017. Published in: Energy Procedia
Permanent WRAP URL:
http://wrap.warwick.ac.uk/89661
Copyright and reuse:
The Warwick Research Archive Portal (WRAP) makes this work of researchers of the
University of Warwick available open access under the following conditions.
This article is made available under the Attribution-NonCommercial-NoDerivatives 4.0 (CC
BY-NC-ND 4.0) license and may be reused according to the conditions of the license. For
more details see:
http://creativecommons.org/licenses/by-nc-nd/4.0/
A note on versions:
The version presented in WRAP is the published version, or, version of record, and may be
cited as it appears here.
ScienceDirect
Energy Procedia 00 (2017) 000–000
www.elsevier.com/locate/procedia
1876-6102 © 2017 The Authors. Published by Elsevier Ltd.
Peer-review under responsibility of the Organizing Committee of 2017 AEDCEE.
2017 International Conference on Alternative Energy in Developing Countries and Emerging
Economies
Scale-up of lithium-ion battery model parameters from cell level to
module level – identification of current issues
Anup Barai
a,*, T. R. Ashwin
a, Christos Iraklis
a, Andrew McGordon
aand Paul Jennings
aaEnergy Innovation Centre, WMG, University of Warwick, Coventry CV4 7AL, UK
Abstract
An automotive Battery Management System (BMS) provides the on-board estimation of remaining energy, which in-turn employs an equivalent circuit model (ECM). ECM provides vital information like state of charge and state of health of the battery. The ECM is commonly developed and parameterised using cell level test data. The lithium-ion battery pack has tens to thousands of cells, connected in series-parallel configuration within the modules, and multiple modules are connected in series/parallel to form the battery pack. The ECM is usually scaled-up from a cell to a battery module and pack; which introduces inaccuracy, reflected as poor prediction of remaining energy. As a first step to the long-term goal to enhance the BMS performance, this research is focused on identifying the sources which contribute toward discrepancies of battery capacity and resistance, two key model parameters measured from cell level and module level test data. To achieve this, capacity and resistance of the battery cells has been measured. The same cells were used to construct four different battery modules and module capacity and resistance were measured. From the capacity test it was found that depending on how the cells are arranged within the module the capacity will vary by 5.3%. The resistance was found to be increasing as well, by 2.1-5.3%. The resistance variation mainly originates from interconnections of the cells within the modules. Electrochemical impedance spectroscopy tests were performed on the cells and modules to measure the impedance, which suggest similar results as internal resistance measured from pulse power test. This research will enable development of a methodology for robust model parameter extraction and thus ECM development for battery packs.
© 2017 The Authors. Published by Elsevier Ltd.
Peer-review under responsibility of the Organizing Committee of 2017 AEDCEE.
Keywords: Lithium-ion battery, internal resistance, battery modelling, module testing, ECM
* Corresponding author. Tel.: +4402476575928.
2 Author name / Energy Procedia 00 (2017) 000–000
1.Introduction
Lithium ion batteries have become the energy storage technology of choice due to their high energy density, high efficiency and long life. Carbon emissions legislation, in tandem with rising demand for electric and hybrid vehicles, is driving significant demand for high-power, high-energy lithium ion battery packs in the automotive industry. The demand for lithium ion batteries grew from circa 49 GWh in 2013 to circa 70 GWh in 2016 and is expected to rise to more than 96 GWh by 2020 [1], which is largely governed by the demand from automotive industry.
Typical automotive battery packs are made up of tens to thousands of cells, connected in series parallel configuration within the modules, and multiple modules are connected in series to form the battery pack. The number of cells connected in series parallel configuration varies depending on the battery pack voltage, power and capacity requirement [2]. Series connections are used to achieve higher pack voltage and parallel connections are used to achieve higher current and power capability; also, for higher pack capacity.
The remaining electric range (state of energy), instantaneous power capability, temperature and state of health of a battery pack, have become an increasingly important area of research in energy storage. A Battery Management System (BMS) provide the on-board estimation, which in-turn employs an equivalent circuit model (ECM). The ECM is commonly developed and parameterised using cell level test data. The ECM is usually theoretically scaled-up for lithium-ion battery module and pack; which introduce inaccuracy, reflected as poor prediction of remaining energy, increasing the range anxiety of the driver as reported in [3, 4], and poor estimation of battery degradation in real world operating conditions [5].
There is an inconsistency in cell manufacturing parameters, which manifests itself as a cell-to-cell variation in a lithium-ion battery pack. In addition, another inconsistency in cell connections is also apparent within the battery pack. This may lead to uneven resistance distribution within the battery pack, leading to reduced power capability, higher temperature gradient and thus reduced safety of the battery pack [6]. Furthermore, due to the resistance distribution some of the cells may reach the lowest allowed operating voltage earlier than others, decreasing battery capacity, as an active balancing circuit is not commonly used in mass produced commercial battery packs. These inconsistencies within the battery pack manifest themselves as a deviation of battery performance estimated by the BMS. The lack of knowledge of this process can restrict the advancement of the remaining energy prediction, restricting mass commercialization of electric vehicles.
As a first step to the long-term goal to enhance the BMS performance, this manuscript is focused on identification of the sources which contribute toward discrepancies between cell and module performance and in the longer term pack level performance. To achieve this, performance of battery cells are measured prior to making battery modules of different series parallel configurations; this is later compared to performance of the complete modules.
In this manuscript, outlines the experimental procedure in Section 2; results and relevant discussion with the results are presented in Section 3. Finally, Section 4 summaries the key findings.
2.Experimental procedure
Twenty eight commercially available lithium-ion cylindrical cells (18650) were used for this study. The batteries have Lithium nickel cobalt aluminum oxide (LiNi0.8Co0.15Al0.05O2) cathode and graphite (LiC6) anode. The battery
capacity is rated as 3.0 Ah (10.6 Wh), maximum discharge current as 10 Amp, 1kHz resistance of less than 35 mΩ
and operating voltage window of 2.5-4.2 V.
To measure internal resistance, SoC of the cells was adjusted to 50 %. For this, a fully charged cell was discharged for 30 min using 1C current. Subsequently cells were rested for 3 hours before measuring internal resistance [7]. Internal resistance was measured employing discharge and charge pulse of 10 sec length and maximum rated current. Resistance was calculated from the voltage drop due to a 10 sec pulse current.
Following the cell testing, four battery modules were manufactured using the 28 cells. The first module was built with 4 cells in parallel connection, 2nd module had 10 cells in parallel, 3rd module had 4 cells in series connection
and 4th module had 10 cells in series connection. The details of these modules are given in Table 1. To minimize the
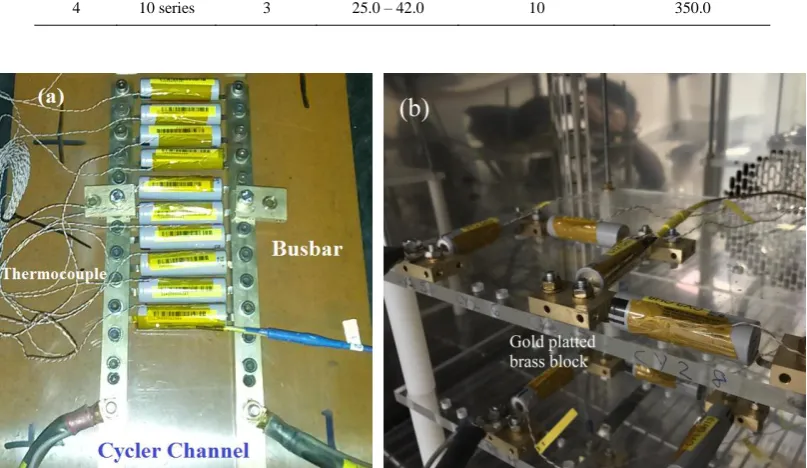
[image:4.544.86.457.237.317.2]connection resistance in parallel modules all the cells were connected to a single busbar as shown in Figure 1 (a). For series modules, interconnections were made using gold plated brass blocks as shown in Figure 1 (b). A fixed torque of 12.5 Nm was applied using the bolts to ensure low connection resistance, and is same for all 28 cells. One T-type thermocouple was installed per cell to measure the cell temperature during the test.
Table 1. Details of the 4 battery modules build with 28 cells Module
number
Type Capacity (Ah)
Operating Voltage (V)
Maximum discharge Current (A)
Pure Ohmic resistance (mΩ) 1 4 parallel 12 2.5 - 4.2 40 8.8 2 10 parallel 30 2.5 – 4.2 100 3.5 3 4 series 3 10.0 – 16.8 10 140.0 4 10 series 3 25.0 – 42.0 10 350.0
Fig. 1. (a) Parallel module with 10 cells connected with a single busbar; (b) 4 cells in series connected using gold plated brass blocks.
[image:4.544.69.473.304.538.2]4 Author name / Energy Procedia 00 (2017) 000–000
3.Results and discussion
[image:5.544.134.415.166.357.2]The capacity of the cells was found to be 3.06 ± 0.02 Ah (10.62 ± 0.09 Wh). The resistance calculated from the instantaneous voltage drop due to pulse current (0.1 sec) was found to be 37.0 ± 0.6 mΩ and total resistance from end of 10 sec pulse was 45.3 ± 0.7 mΩ. Therefore, the cell-to-cell variation of these 28 cells are within 0.8 % for capacity and within 1.5 % for resistance. The EIS test performed on these cells at 50 % SoC is shown in Fig. 2. These results also shows the impedance of the cells are quite closely matched.
Fig. 2. Internal impedance of the cells measured from EIS test.
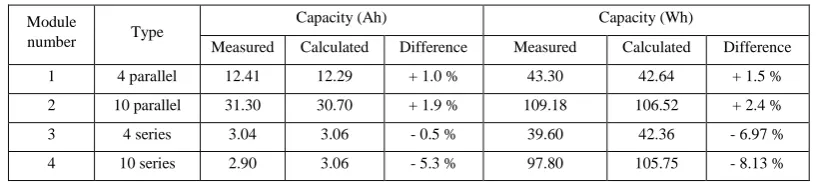
The capacity of the modules in amp-hour and watt-hour are shown in Table 2. The measured values are the values for capacity test of the modules and the calculated values are the sum of the capacity values of the individual cells within the modules from cell tests. Both parallel modules showed more capacity compared to the calculated value. In contrast, series modules showed less capacity. In the parallel module, cells were in close proximity compared to the series module. This lead to higher cell temperature rise during charge and discharge, which may lead to higher capacity as explained in [6, 8]. Due to the small cell-to-cell variation and increased resistance due to interconnections, the module with 4 cells in series reached to lowest voltage limit earlier during discharge, leading to lower capacity than expected. The cell-to-cell variation and connection resistance rise is higher for 10 cells in series, which leads to further reduction of capacity compared to 4 series module.
Table 2. Comparison of module capacity, measured vs calculated from cell capacity.
Module
number Type
Capacity (Ah) Capacity (Wh)
Measured Calculated Difference Measured Calculated Difference 1 4 parallel 12.41 12.29 + 1.0 % 43.30 42.64 + 1.5 % 2 10 parallel 31.30 30.70 + 1.9 % 109.18 106.52 + 2.4 % 3 4 series 3.04 3.06 - 0.5 % 39.60 42.36 - 6.97 % 4 10 series 2.90 3.06 - 5.3 % 97.80 105.75 - 8.13 %
[image:5.544.69.478.545.636.2]0.1 sec resistance (5.3 %) was found for 4 series module compared to 10 series modules (2.5 %). The total resistance calculated from 10 sec pulse showed similar trend (Table 3). The increase of the resistance is primarily due to the connection resistance. Although the measures has been taken i.e. used gold plated brass blocks and applied fixed torque, there may still variability existing within the connections, which may lead to the discrepancy in resistance rise within the modules.
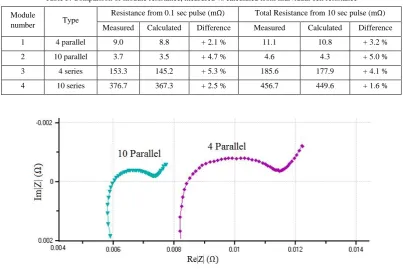
[image:6.544.69.473.229.498.2]The EIS test results on 4 parallel and 10 parallel modules are shown in Fig. 3. Due to the voltage limitation of EIS equipment (±8 V) it was not possible to perform EIS test on series modules. The EIS tests suggests similar conclusions as derived from pulse power test. Combining individual EIS test data, it is expected Nyquist plot of 4 parallel module and 4 series module will be further left on the x-axis. Further investigation with EIS test data employing equivalent circuit model (ECM) to extract model parameters is currently ongoing and will be reported in a future publication. However, these results clearly shows the current gap in the literature, identifies potential source of discrepancy, and will catalyse future research in this area.
Table 3. Comparison of module resistance, measured vs calculated from individual cell resistance
Module
number Type
Resistance from 0.1 sec pulse (mΩ) Total Resistance from 10 sec pulse (mΩ) Measured Calculated Difference Measured Calculated Difference 1 4 parallel 9.0 8.8 + 2.1 % 11.1 10.8 + 3.2 % 2 10 parallel 3.7 3.5 + 4.7 % 4.6 4.3 + 5.0 % 3 4 series 153.3 145.2 + 5.3 % 185.6 177.9 + 4.1 % 4 10 series 376.7 367.3 + 2.5 % 456.7 449.6 + 1.6 %
Fig. 3. Internal impedance of 4 parallel and 10 parallel module, measured from EIS test.
4. Conclusion
6 Author name / Energy Procedia 00 (2017) 000–000
Acknowledgements
The research presented within this paper is supported by the Innovate UK (https://hvm.catapult.org.uk/hvm-centres/wmg-catapult/) through the WMG centre High Value Manufacturing (HVM) Catapult in collaboration with Jaguar Land Rover and TATA Motors. The authors are thankful to all ‘cell work-stream’ members of HVM Catapult for their valuable advice, comments and discussions.
References
1. Jaffe, S. The battery industry: global marke sizing and forecast. in Benchmark Mineral Intelligence World Tour. 2015. Toronto.
2. Barai, A., Improvement of Consistency, Accuracy and Interpretation of Characterisation Test Techniques
for Li-ion Battery cells for Automotive Application, in WMG. 2015, University of Warwick: UK.
3. Birrell, S.A., A. McGordon, and P.A. Jennings. Defining the accuracy of real-world range estimations of
an electric vehicle. in Intelligent Transportation Systems (ITSC), 2014 IEEE 17th International Conference
on. 2014.
4. Williams, T. Real World Test: 2013 Nissan LEAF Range vs 2012 Nissan LEAF Range (w/Viideo). 2013 01/06/2015]; Available from: http://insideevs.com/real-world-test-2013-nissan-leaf-range-vs-2012-nissan-leaf-range/.
5. Gordon-Bloomfield, N. StaffCar Update: After 73,100 Miles, Our Nissan LEAF Loses its Second Capacity Bar. 2015 01/06/2015]; Available from: https://transportevolved.com/2015/04/14/staffcar-update-after-73100-miles-our-nissan-leaf-loses-its-second-capacity-bar/.
6. Grandjean, T., A. Barai, A. McGordon, Y. Guo, and J. Marco, Large format lithium ion pouch cell thermal
gradient characterisation at different ambient temperatures and current discharge rates. Journal of Power
Sources, 2017. Under Review.
7. Barai, A., G.H. Chouchelamane, Y. Guo, A. McGordon, and P. Jennings, A study on the impact of
lithium-ion cell relaxatlithium-ion on electrochemical impedance spectroscopy. Journal of Power Sources, 2015. 280(0): p.
74-80.
8. Groenewald, J., J. Marco, N. Higgins, and A. Barai, In-Service EV Battery Life Extension Through Feasible