warwick.ac.uk/lib-publications
Original citation:
Husband, K., Bremer, M. N., Stanway, Elizabeth R. and Lehnert, M. D. (2015) Dissecting the
complex environment of a distant quasar with MUSE. Monthly Notices of the Royal
Astronomical Society, 452 (3). pp. 2388-2395.
Permanent WRAP URL:
http://wrap.warwick.ac.uk/83187
Copyright and reuse:
The Warwick Research Archive Portal (WRAP) makes this work by researchers of the
University of Warwick available open access under the following conditions. Copyright ©
and all moral rights to the version of the paper presented here belong to the individual
author(s) and/or other copyright owners. To the extent reasonable and practicable the
material made available in WRAP has been checked for eligibility before being made
available.
Copies of full items can be used for personal research or study, educational, or not-for profit
purposes without prior permission or charge. Provided that the authors, title and full
bibliographic details are credited, a hyperlink and/or URL is given for the original metadata
page and the content is not changed in any way.
Publisher’s statement:
This is a pre-copyedited, author-produced PDF of an article accepted for publication in
Monthly Notices of the Royal Astronomical Society following peer review. The version of
Husband, K., Bremer, M. N., Stanway, Elizabeth R. and Lehnert, M. D.. (2015) Dissecting the
complex environment of a distant quasar with MUSE. Monthly Notices of the Royal
Astronomical Society, 452 (3). pp. 2388-2395. is available online at
http://dx.doi.org/10.1093/mnras/stv1424
A note on versions:
The version presented here may differ from the published version or, version of record, if
you wish to cite this item you are advised to consult the publisher’s version. Please see the
‘permanent WRAP URL’ above for details on accessing the published version and note that
access may require a subscription.
1H.H. Wills Physics Laboratory, University of Bristol, Tyndall Avenue, Bristol BS8 1TL, UK
2Department of Physics, University of Warwick, Gibbet Hill Road, Coventry CV4 7AL, UK
3Institut d’Astrophysique de Paris, UMR 7095, CNRS, Universit´e Pierre et Marie Curie, 98 bis Boulevard Arago, F-75014 Paris, France
Accepted 2015 June 24. Received 2015 May 22; in original form 2015 February 5
A B S T R A C T
High-redshift quasars can be used to trace the early growth of massive galaxies and may be triggered by galaxy–galaxy interactions. We present Multi-Object Spectroscopic Explorer (MUSE) science verification data on one such interacting system consisting of the well-studied
z=3.2 PKS1614+051 quasar, its AGN companion galaxy and bridge of material radiating in Lyαbetween the quasar and its companion. We find a total of four companion galaxies (at least two galaxies are new discoveries), three of which reside within the likely virial radius of the quasar host, suggesting that the system will evolve into a massive elliptical galaxy by the present day. The MUSE data are of sufficient quality to split the extended Lyαemission line into narrow velocity channels. In these the gas can be seen extending towards each of the three neighbouring galaxies suggesting that the emission-line gas originates in a gravitational interaction between the galaxies and the quasar host. The photoionization source of this gas is less clear but is probably dominated by the two AGN. The quasar’s Lyαemission spectrum is double peaked, likely due to absorbing neutral material at the quasar’s systemic redshift with a low column density as no damping wings are present. The spectral profiles of the AGN and bridge’s Lyαemission are also consistent with absorption at the same redshift indicating that this neutral material may extend over>50 kpc. The fact that the neutral material is seen in the line of sight to the quasar and transverse to it, and the fact that we see the quasar and it also illuminates the emission-line bridge, suggests that the quasar radiates isotropically and any obscuring torus is small. These results demonstrate the power of MUSE for investigating the dynamics of interacting systems at high redshift.
Key words: techniques: imaging spectroscopy – galaxies: high-redshift – galaxies: interactions – quasars: individual: PKS1614+051.
1 I N T R O D U C T I O N
The growth of galaxies and galaxy clusters can be probed using high-redshift quasars to pinpoint regions of early cluster formation (e.g. Turner1991; Springel et al.2005; Di Matteo et al.2008). The rapid buildup in mass of the central supermassive black holes and host galaxies of quasars implies that they are hosted by massive dark matter haloes – themselves the likely sites of early galaxy clustering. Thus, distant quasars can be used to explore the early interactions that may trigger quasar activity and lead to the growth of massive galaxies that eventually exist at the centres of present-day clustering. Observational evidence of galaxy clustering around at least a subset of high-redshift quasars is now becoming apparent (e.g. Toshikawa et al.2012; Husband et al.2013; McGreer et al.
2014).
E-mail: [email protected] (KH); [email protected] (MNB)
One of the earliest identified systems that showed evidence of interaction and clustering at high redshift is that of PKS1614+051, consisting of az=3.2 radio-loud quasar and companion galaxy connected by an extended bridge of ionized gas. The emission-line companion galaxy is itself an AGN (Djorgovski et al.1987; Bremer & Johnstone1995) and the bridge of gas is radiating strongly in Lyα (Hu & Cowie1987). While not unique in having clearly extended Lyα, the combination of quasar, AGN and extended Lyαemission is a rare opportunity to explore the connection between a high-redshift quasar and its environment. First discovered by Djorgovski et al. (1985), the brightness of the companion galaxy (significantly brighter than typical Lyman-break galaxies and Lyαemitters at
z∼3) and the Lyαbridge allowed the system to be studied with 4-m telescopes in the 1980s and 1990s. Given the companion galaxy, some authors (e.g. Hu & Cowie 1987) suggest it should lie in an overdense (or protocluster) environment that will evolve into a galaxy cluster by the present day.
With the advent of MUSE (Multi-Object Spectroscopic Explorer; Bacon et al.2012) – a 1×1 arcmin2field integral field unit (IFU)
on the VLT (Very Large Telescope) – a more detailed study of
at University of Warwick on October 25, 2016
http://mnras.oxfordjournals.org/
MUSE observations of PKS1614
+
051
2389
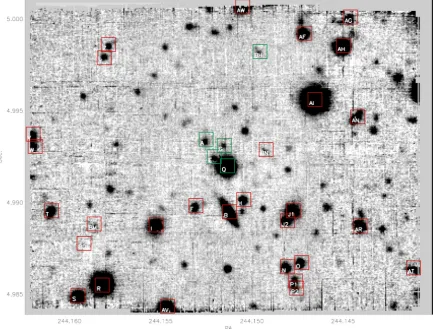
Figure 1. A white light image (4750–9350 Å) of the MUSE field of view highlighting the galaxies whose redshift could be determined as well as the stars that could be identified. Galaxies that are at the same redshift as the central quasar (Q) are highlighted in green (A, E, G and BH), whilst those at lower redshift are in red. The labelling for the central objects is the same as in Hu & Cowie (1987) with Q marking the quasar. All the details for these objects are in Table1.
this region is now possible. The large IFU enables continuum and emission-line morphologies to be acquired as well as information about the dynamics and ionization state of the gas and galaxies, without which interpretation of the complex interaction of quasars with their environments is highly challenging. Often the close en-vironment of a quasar is studied using rare, spatially coincident background quasars to probe individual sight lines through the halo containing the quasar. Here we show that we can probe numerous lines of sight around a quasar using the IFU capabilities of MUSE and the Lyαhalo of the quasar. Although already well studied, the MUSE science verification data presented in this paper provides new information on the nature of this system.
Acold dark matter cosmology withH0=70 km s−1Mpc−1, M=0.29 and=0.71 (Bennett et al.2014) is used throughout.
2 O B S E RVAT I O N S
The data were taken as part of science verification with VLT/MUSE between 2014 August 18 and 20. The 1×1 arcmin2field of view was
first centred 15 arcsec west of PKS1614+051 and then 15 arcsec to the east. Four 880 s exposures, rotated 90◦between each, were taken at each position, giving a total exposure time of 1.96 h and spectroscopic coverage of all galaxies within 1.28×1 arcmin2over
a wavelength range of 4750–9350 Å. This arrangement meant that the central∼30 arcsec wide north-south strip of the eventual image accrued twice the exposure time of the∼15 arcsec wide eastern and western strips.
The MUSE Data Reduction Software (version 0.18.5) was used for the first reduction of the data – bias subtracting, flat-fielding and calibrating the data, and aligning and constructing three dimen-sional data cubes. AnIDLscript was written to achieve a better sky
subtraction than the early MUSE pipeline by fitting and subtracting a second-order polynomial to each spatial row (along the long axis of the IFUs) of each wavelength slice of the resulting data cubes for each of the eight exposure in order to remove the sky contribution. The resulting eight data cubes (one for each of the four rotations at two separate pointings) were mean combined with cosmic ray re-jection (sigma clipping), and the median of the entire frame at each wavelength bin subtracted to remove any remaining residual from the sky subtraction. Images were constructed from the data cubes by collapsing the spectral axis over defined wavelength ranges. A further median subtraction was done to each row of each individual IFU for every exposure and then these were combined with a bad pixel mask and sigma clipping to produce the final white light image (see Fig.1).
The rms noise in the final data cube is 1×10⁻¹⁹erg s−1cm−2per
1.25 Å wavelength bin, at 5150 Å and in the centre of the data cube. The rms noise is a factor of√2 worse in the two 15 arcsec wide strips on the east and west of the image where the total exposure time is half that of the middle and the noise is up to 50 per cent lower in the middle of the wavelength range around 7000 Å. The 2σdepth, within 2 arcsec diameter apertures, of the white light, full range (4750–9350 Å) stacked image is 26.4 AB. The full width at half-maximum (FWHM) velocity resolution is measured from the
MNRAS452,2388–2395 (2015)
at University of Warwick on October 25, 2016
http://mnras.oxfordjournals.org/
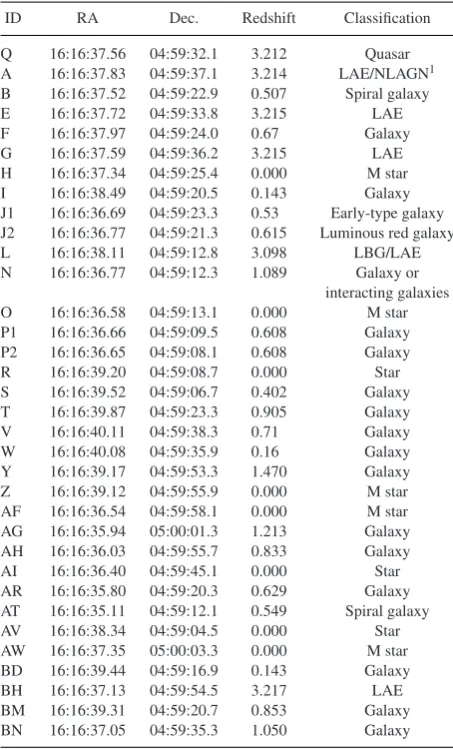
Q 16:16:37.56 04:59:32.1 3.212 Quasar A 16:16:37.83 04:59:37.1 3.214 LAE/NLAGN1 B 16:16:37.52 04:59:22.9 0.507 Spiral galaxy E 16:16:37.72 04:59:33.8 3.215 LAE F 16:16:37.97 04:59:24.0 0.67 Galaxy G 16:16:37.59 04:59:36.2 3.215 LAE H 16:16:37.34 04:59:25.4 0.000 M star I 16:16:38.49 04:59:20.5 0.143 Galaxy J1 16:16:36.69 04:59:23.3 0.53 Early-type galaxy J2 16:16:36.77 04:59:21.3 0.615 Luminous red galaxy L 16:16:38.11 04:59:12.8 3.098 LBG/LAE N 16:16:36.77 04:59:12.3 1.089 Galaxy or
interacting galaxies O 16:16:36.58 04:59:13.1 0.000 M star P1 16:16:36.66 04:59:09.5 0.608 Galaxy P2 16:16:36.65 04:59:08.1 0.608 Galaxy R 16:16:39.20 04:59:08.7 0.000 Star S 16:16:39.52 04:59:06.7 0.402 Galaxy T 16:16:39.87 04:59:23.3 0.905 Galaxy V 16:16:40.11 04:59:38.3 0.71 Galaxy W 16:16:40.08 04:59:35.9 0.16 Galaxy Y 16:16:39.17 04:59:53.3 1.470 Galaxy Z 16:16:39.12 04:59:55.9 0.000 M star AF 16:16:36.54 04:59:58.1 0.000 M star AG 16:16:35.94 05:00:01.3 1.213 Galaxy AH 16:16:36.03 04:59:55.7 0.833 Galaxy AI 16:16:36.40 04:59:45.1 0.000 Star AR 16:16:35.80 04:59:20.3 0.629 Galaxy AT 16:16:35.11 04:59:12.1 0.549 Spiral galaxy AV 16:16:38.34 04:59:04.5 0.000 Star AW 16:16:37.35 05:00:03.3 0.000 M star BD 16:16:39.44 04:59:16.9 0.143 Galaxy BH 16:16:37.13 04:59:54.5 3.217 LAE BM 16:16:39.31 04:59:20.7 0.853 Galaxy BN 16:16:37.05 04:59:35.3 1.050 Galaxy
sky lines to be 2.7 Å or equivalently 150 km s−1atz=3.215 and
the spatial FWHM of the final white light image is 0.9 arcsec. The pixel scale of MUSE is 0.2 arcsec (pixel)−1.
The final white light image is shown in Fig.1. We useSEXTRACTOR
(Bertin & Arnouts1996) followed by a visual check to identify 119 objects in our white light image, of which 60 are brighter thanR=25 AB (see Table1). We also checked the entire data cube for emission lines but only one additional object was found. This is unsurprising as any emission-line-only object would have an extremely high equivalent width and likely a very red or very blue spectrum in order for the continuum to remain undetected. The only other object with undetected continuum is the Lyαbridge indicating it has a very large rest-frame equivalent width (>60 Å using the 2σ limit on the spectrum in the wavelength range 5090–5190 Å near the Lyα emission or>180 Å using the 2σlimit on the full range white light image shown in Fig.1) that is unlikely to be powered by embedded star formation in the bridge (the maximum equivalent width from star-forming regions is 240 Å; Charlot & Fall1993; Hennawi & Prochaska2013). Analysis of both emission lines, absorption lines and comparison with Sloan Digital Sky Survey galaxy and stellar templates results in redshifts for 34 galaxies (Table1), of which four are at the redshift of the quasar (withinz=0.003). We are sensitive
wavelength range.
3 R E S U LT S
The capabilities of MUSE are clearly demonstrated in this data – with just two hours of observations, we can identify galaxies at the same redshift as the quasar across the 1 arcmin2field of view and
probe in detail the region close to the quasar containing PKS1614, its AGN companion, the emission-line bridge and any other potential companion galaxies.
3.1 Galaxy environment of PKS1614
The PKS1614+051 quasar has at least four companion galaxies: the previously known narrow-line AGN A, galaxy E – hitherto identified as a candidatez = 3.2 Lyα emitter (LAE) based on narrow-band imaging (Hu & Cowie1987; Hu et al.1991) – and two new LAEs/LBGs: G and BH. For these newly identified sources, we extend the galaxy labelling scheme of Hu & Cowie (1987) but we do not find galaxies at the positions of their C and D objects. The spectra of these companion galaxies are shown in more detail in Figs2and3.
Three of the companion galaxies (A, E and G) are close enough to be interacting with the quasar as defined by Ellison et al. (2008) and are within the expected virial radius of the quasar’s host dark matter halo suggesting that they will eventually merge with the quasar host to form a massive elliptical galaxy (perhaps at the centre of a group or cluster) by the present day. Although the spectrum of E may be affected by scattered light from the quasar, its broad-band photome-try is consistent with a Lyman break and its Lyαline is significantly narrower than the quasar’s, suggesting that it is a separatez=3.2 galaxy. E is unlikely to be driven solely by fluorescence from the quasar (e.g. Cantalupo et al.2005; Kollmeier et al.2010) as the presence of continuum emission suggests that star formation can create the Lyαemission (the rest-frame equivalent width is only
[image:4.595.49.276.102.477.2]∼15 Å). The companion galaxies are all cleanly separated from the
Figure 2. The extracted 1D spectrum of companion A with the sky lines plotted underneath.
at University of Warwick on October 25, 2016
http://mnras.oxfordjournals.org/
[image:4.595.308.546.533.706.2]MUSE observations of PKS1614
+
051
2391
Figure 3. The extracted 1D spectrum of companion E, G and BH with the sky lines plotted underneath. The dashed line shows the median of the spectrum either side of the expected break. Areas of the spectrum affected by skylines have been set to zero.
quasar demonstrating the excellent spatial sampling of the MUSE data.
In total, we confirm five galaxies including the quasar host within an area of 20×25 arcsec2byz=0.003 or a maximum comoving
volume of 1.4 comoving Mpc3, ignoring peculiar velocities i.e.
assuming the difference in redshift represents the Hubble expansion.
3.2 Gaseous environment
We have obtained a detailed, high signal-to-noise spectrum of the quasar, companion A and, for the first time, the emission-line bridge. Fig.4shows the distribution of gas in the central region around the quasar. The emission-line bridge extends over 50 physical kpc from A to the quasar and slightly beyond the quasar in the other direction (Fig.4b), with a width of around 10 kpc. Fig.4c shows the redmost and bluemost (5 Å wide or 300 km s−1) components of the Lyα
line, showing how the high surface brightness emission connects the quasar to companion A and also extends towards the two other nearby galaxies (E and G), denoted by crosses. Fig.4d shows the dispersion of the Lyαline as a function of position, found from fitting a Gaussian to the Lyαline in each spatial pixel. The Lyα emission from the bridge has a relatively low dispersion, as does the Lyαemission from companions E and G, whilst the emission
from the quasar and companion A has larger velocity dispersions as expected for active galaxies (see Table2).
The spectrum of the quasar’s Lyαemission is strongly double peaked with the central gap having a rest-frame equivalent width of 1.1 Å and the flux declining to almost zero at the central wave-length of the line. If this is due to an absorption system, the velocity width, b, is 180±15 km s−1and this implies a low column density
of (1.9±0.4)×1013cm−2using a curve of growth analysis and
assuming a covering fraction of 100 per cent, as expected for an unsaturated absorption profile without damping wings. This poten-tial absorbing material is at the systemic redshift of the quasar (as derived from other lines e.g. HeII, CIV) suggesting that the emission
arises from neutral material in or around the quasar. The spectra of A and the bridge are also consistent with being affected by the same absorbing material. Their spectral profiles display a similar sharp cutoff on the blueward edge as the quasar’s Lyαprofile (Fig.5), although the underlying Lyαemission lines in A and the bridge are narrower and appear to peak at slightly longer wavelengths than the quasar Lyαemission line.
We see no other emission lines arising from the bridge, placing a constraint on the CIV/Lyαand HeII/Lyαflux ratios of<0.03
and<0.06 (3σ), significantly below the ratios for the quasar and companion A where CIVand HeIIwere detected. This implies a
lower ionization parameter for the bridge than that typically seen from an AGN (see the discussion section below).
4 D I S C U S S I O N
4.1 Protocluster or protogalaxy environment
PKS1614+051 lies in a galaxy overdensity of at least five galaxies (including itself) within a volume of no more than 1.4 comoving Mpc3, demonstrating that MUSE is clearly capable of identifying
clustering and potential protoclusters at z ∼ 3. At this redshift, MUSE allows for little spectral coverage below the 1216 Å Lyα break. Given the relative weakness of this break at z= 3 when compared to higher redshifts, and the low signal to noise obtained on the continuum of faint sources at short wavelengths, it will be easier to use MUSE to search for LBGs at higher redshifts than that probed here.
The majority (3/4) of the companion galaxies are within a 50 kpc of the quasar, and hence well within its expected virial radius (∼280 kpc; Cantalupo et al.2014), suggesting that they will merge with the quasar to form a massive elliptical galaxy byz=0. If this is the progenitor of the massive galaxies seen atz∼1.5, then the merger needs to be completed within∼2.5 Gyr.
At this redshift, we expect protoclusters to extend over radii of 2–5 arcmin (Chiang, Overzier & Gebhardt 2013). As MUSE only probes 1 arcmin2, we can draw limited conclusions about the
wider protocluster environment of PKS1614. Nevertheless, with one companion galaxy outside its virial radius and three within, the quasar is highly likely to reside in an overdense environment likely to evolve into a group or cluster. We note that with another eight similar pointings – in total 18 h of MUSE time – the environment of the system could be probed in detail on the scale of an Advanced Camera for Surveys (ACS) or Wide Field Camera 3 (WFC3)HST
image, better matched to the expected scale of overdense regions.
4.2 Gaseous interactions
High-redshift radio-loud quasars and galaxies are often observed to have extended Lyαhaloes surrounding them, spanning 10–100 s
MNRAS452,2388–2395 (2015)
at University of Warwick on October 25, 2016
http://mnras.oxfordjournals.org/
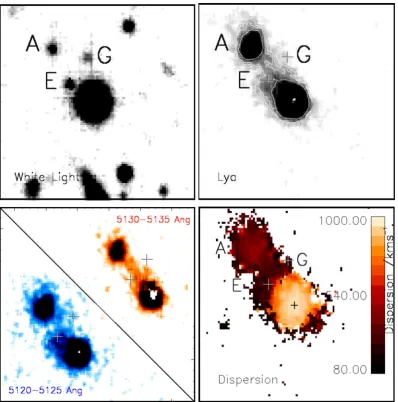
Figure 4. (a) White light image of the centre of the MUSE field of view (20×18 arcsec2) clearly showing galaxies E and G. (b) The same area in the narrow band (5120–5135 Å) encompassing Lyα. Some of the Lyαemission from the quasar and A has also been subtracted using a PSF model in order to show the extended emission more clearly. The contours trace the Lyαshowing that both the quasar and A are clearly extended in Lyαand the emission extends beyond A to the north. The crosses mark the positions of galaxies E and G. The surface brightness limit is∼4×10⁻¹⁷erg s−1cm−2arcsec−2and the contours indicate surface brightness of (4, 5, 9, 11 and 20)×10−17erg s−1cm−2arcsec−2. (c) The Lyαline is split into the bluemost (5120–5125 Å) and redmost (5130–5135 Å) velocity components. In these narrower components, the gas is seen to extended between the quasar and A and also towards galaxies E and G (marked by crosses). (d) The velocity dispersion of the Lyαline from the same Gaussian fits to each spatial pixel. This shows that the quasar has a velocity dispersion of 920 km s−1whilst companion A has a velocity dispersion of 400 km s−1. The high values are what is expected for active galaxies. Companion E and the material in the bridge have much lower velocity dispersions, around the velocity resolution of MUSE.
Table 2. The properties of the companion galaxies relative to the quasar. The Lyαflux is determined from the area under a Gaussian fit to the line with the continuum removed in a 2 arcsec aperture. The properties for the bridge are for the entire bridge structure once the contribution from the quasar and companion A are removed, except for the velocity dispersion which is the value for the centre of the bridge.
ID zpeak zsys zfit Lyαflux Lyαluminosity Lyαvel. dispersion Rabs. mag. (10−20erg s−1cm−2) (1043erg s−1) (km s−1) (mag)
Q 3.215 3.212 3.215 616 720 58.8 920 −28.1
A 3.215 3.214 3.215 33 260 3.18 400 −23.0
E 3.215 na 3.215 3960 0.035 260 −23.2
G 3.215 na 3.211 1080 0.103 190 −22.7
BH 3.217 na 3.217 773 0.074 130 −22.9
Bridge 3.215 na 3.214 10 940 1.989 250 −21.0
at University of Warwick on October 25, 2016
http://mnras.oxfordjournals.org/
[image:6.595.105.488.615.710.2]MUSE observations of PKS1614
+
051
2393
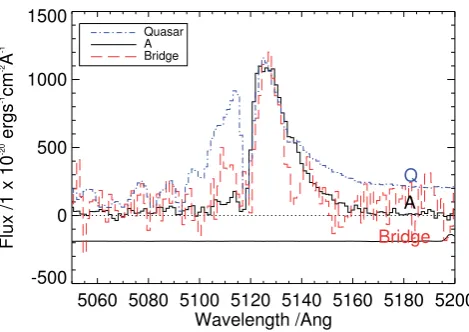
Figure 5. A zoom-in on the extracted 1D spectrum of the quasar, compan-ion A and the bridge showing the Lyαemission profile. The flux of the bridge and quasar have been scaled to that of companion A. There is strong absorption at 5120 Å that is Lyαat the quasar’s systemic redshift. All three objects show a sharp drop at this wavelength. The bridge appears to recover flux shortward of the drop, as may companion A but note that the signal to noise on the spectrum of A is much higher than the signal to noise of the bridge.
of kpc (e.g. Heckman et al.1991a; Christensen et al.2006; Villar-Mart´ın et al.2007) with line widths of 100–1500 km s−1(Heckman
et al. 1991b). The photoionization of the gas is often attributed to radiation escaping along the radio axis of the galaxy, although fainter extended Lyαhaloes are seen around compact radio galaxies (e.g. van Ojik et al.1997) and around some radio-quiet quasars (e.g. Christensen et al.2006; Herenz et al.2015). Many of the extended emission-line regions around radio galaxies (∼60 per cent) and in particular those around the smallest (<50 kpc-sized) radio sources such as PKS1614+051 have associated HIabsorption (van Ojik
et al.1997). Indeed,∼60 per cent of the 74z∼2 quasars studied by Prochaska, Hennawi & Simcoe (2013b) were found to have nearby (<200 kpc) neutral material absorbing photons from a spatially coincident background quasar. Assuming that the quasar is at the centre of a similar large-scale diffuse, high filling factor neutral halo, the picture we favour to explain the observed distribution of gas around PKS1614+051 is as follows: embedded within this diffuse halo are also the companion galaxies A, E and G and the bridge of denser, lower filling factor emission-line gas. This gas phase originates from material extracted from the companions and quasar host through mutual gravitational interactions and is ionized by AGN and/or stellar emission. Below we discuss the evidence in favour of this picture.
The gas in the bridge is aligned between the quasar and compan-ion A, and may extend slightly beyond A and the quasar along the same axis. Fig.4c shows the distribution of the redmost and blue-most component of the Lyαbridge gas. There is a comparatively narrow stream of gas connecting the quasar to companion A, with a wavelength similar to the Lyαpeak wavelength of A, suggesting the two galaxies are gravitationally interacting. The bridge also seems to extend towards galaxies E and G (marked by crosses), giving it its broad appearance in the full-width Lyαimage and indicating that these galaxies may also be interacting with the bridge and/or quasar.
Unlike many powerful high-redshift radio sources, in this case there is no obvious spatial relationship between the radio emission and the extended emission-line region. Radio observations of the quasar indicate that it is a gigahertz peaked source with the bulk
Figure 6. A comparison of the Lyαluminosity along a line through the quasar and companion A (taking a cross-section along the axis of the bridge). The line that seems to fit the data is a 1/r2convolved with a Gaussian of width equal to the PSF (dashed line), although there is no physical motivation for this. The fact that the surface brightness rises towards A and the quasar suggests that both the active galaxies are sources of the photoionization of the bridge.
of the radio emission arising from a milliarcsec scale region. The source’s radio jet originates from the quasar in a south-westerly direction before turning through 90◦ to the north-west again on subarcsec scales (Djorgovski et al.1987; Orienti et al.2006), and hence the extended emission-line region is probably aligned with the counter-jet axis, albeit on scales two or more orders of magnitude larger than that of the radio emission. However, the lack of similarly extended emission in the south-westerly direction suggest the radio jet is not the primary cause of the emission-line bridge.
The only emission line detected from the gas in the bridge is Ly α, placing strong constraints on the ratio of C IV/Ly α and
HeII/Lyα. The lack of HeIIsuggests a relatively low ionization
parameter, unlike that seen in gas coincident with jets in radio galaxies, whereas the lack of CIVemission suggests the gas is not
hot enough to ionize CIV. Although gas near AGN typically has a
high ionization parameter, low ionization parameter gas may arise at greater distances from the AGN where the photon field is more diffuse, particularly if the ionizing photons have already passed through a cloudy medium (e.g. Arrigoni Battaia et al.2015a). The majority of ionizing photons exciting the bridge emission probably emanate from the quasar and the AGN within companion A as the Lyαsurface brightness rises towards both (Fig.6), although the exact form of the surface brightness profile will depend on the optical thickness and density distribution of the gas in the bridge. The large line width of Ly α suggests that the bridge emission is not due to gravitational cooling, although gravitational cooling would produce little or no HeIIand CIV(Yang et al.2006), and
the Lyαemission is unlikely to arise from shocks as this would result in a higher fraction of C IV compared to Lyα than that
seen here (Heckman et al.1991b). The line ratios are consistent with photoionization from stars (Prescott, Dey & Jannuzi2009), although the Lyαequivalent width limit of the bridge is too high for the ionization source to be solely stellar (the equivalent width limit only allows for ionization from massive, young O stars and such a strong starburst would be a very short lived phenomenon making this an unlikely scenario). However, a more typical stellar population could provide some fraction of the ionizing photons along with ionizing photons from the two AGNs. Alternatively, the observed line ratios could just be an effect of the resonant properties of Lyα
MNRAS452,2388–2395 (2015)
at University of Warwick on October 25, 2016
http://mnras.oxfordjournals.org/
[image:7.595.311.547.58.217.2]The double-peaked Lyαprofile of companion A, the quasar and the bridge (Fig.5) may be indicative of a surrounding absorbing large neutral gas cloud or halo, as is commonly found around other quasars (e.g. Hennawi et al.2006; Prochaska et al.2013a, at similar redshifts). The absorption in all three components is at the same wavelength and goes nearly completely black implying that the absorbing material is separate to the emitting material rather than mixed in with it. This absorbing neutral halo has a radius>50 kpc centred on the quasar and hence a mass of at least∼2×10³M
(using the column density estimate above). The column density of neutral material in this halo could be significantly higher than estimated above if in addition to the low column density material there are regions of high column density gas with lower covering fractions. These higher density clumps would likely emit Ly α photons given that they are probably optically thick clouds within the ionizing field of the quasar and the companion AGN. However, we do not detect a symmetric Lyαhalo centred on the quasar, as opposed to the asymmetric bridge emission, suggesting the mass in higher density clumps is significantly less than that in the bridge. In terms of Lyαabsorption, the quasar’s environment is consistent with the typical environment of high-redshift quasars characterized by Prochaska et al. (2013a). For the bridge and A to show similar absorption, they would most likely have to be observed through a significant fraction of the absorbing halo, of a comparable column density to that affecting the quasar line of sight.
Although radiative transfer effects can also produce double-peaked Ly α emission in optically thick gas clouds (Cantalupo et al.2005; Kollmeier et al.2010), it seems improbable that this is the case here as the absorption wavelength is the same across the en-tirety of the bridge, quasar and companion A whilst the underlying Lyαemission profile changes significantly. Radiative transfer ef-fects are unlikely to produce a double-peaked profile along the line of sight to the quasar, a point source, and so the profile here most likely arises from multiphase gas that includes neutral gas clouds in front of the quasar. The fact that the absorption profile directly in front of the quasar is so similar to that across the rest of the system – there are no discontinuities in the absorption wavelength – is highly suggestive that the quasar line of sight is probing the same relative distribution of material as the line of sight to the bridge. Indeed, we see no other absorption lines in the quasar spectrum indicating that this covering neutral gas must have a low column density, consis-tent with the low column density estimate derived earlier assuming the quasar’s double-peaked profile arises from absorbing material rather than radiative transfer effects.
The PKS1614+051 system is similar to that of SDSSJ0841+3921 and its three companion AGN that are also embedded within an extended Lyαhalo, although at slightly lower redshift (Hennawi et al.2015). However, there is no evidence of merging activity or interaction in the SDSSJ0841 system and the Ly α spectral profiles from the quasar and extended nebula are not double peaked, suggesting there is just one component of (multiphase) gas present, unlike PKS1614+051 that seems to have additional interstellar medium-like material in between the galaxies. The neutral halo surrounding PKS1614+051 may well fluoresce in Lyαin a similar manner to SDSSJ0841+3921 but at a lower surface brightness than our detection limit.
lines from the bridge, allowing a plausible model of the photoion-ization source(s) to be put forward. Additionally, observations of OII, OIIIand Hαwith the James Web Space Telescope Near Infrared
Spectrograph in the future would allow the metallicity and ioniza-tion parameter of the gas to be determined, potentially constraining the origin of the gas.
As noted above, recent work on the gaseous environments of quasars, in particular the extent of surrounding neutral haloes, has used background probes (e.g. a quasar; Hennawi et al.2006; Prochaska & Hennawi2009; Prochaska et al.2013b) to explore the extent of neutral gas in the target quasar’s environment. The poten-tial advantages of the approach used here in addition to the use of a background probe is that MUSE can allow a search for absorp-tion against the extended emission on 10 s kpc scales, allowing the whole region to be explored rather than just a single sight line. The probability of identifying a background probe at small projected distance for a quasar decreases as (radius)−2so the approach used
here can also better sample the haloes at small radii. Clearly, there is potential for observing a sample of quasars with extended Lyα emission with MUSE in order to explore the small-scale quasar en-vironment. This is particularly important as Prochaska et al. (2013a) find an anisotropic distribution ofNHI absorbers around quasars, with more absorbing clouds than expected found around the quasar than in its line of sight (the proximity effect), that they attribute to the quasar emitting anisotropically – clouds along its line of sight are photoevaporated but those transverse to it are exposed to less ra-diation and survive. We see the Lyαabsorption in PKS1614 across the whole of the quasar and companion system suggesting that this quasar is radiating relatively isotropically. In addition, given that we see the bridge and both AGNs, and the bridge must lie mainly in the plane of the sky or its true extent becomes improbably large, the opening angle for AGN emission in both A and the quasar must be large and any obscuring torus small.
The profile of the Lyαabsorption is symmetric around the quasars systemic velocity suggesting that it is not associated with any inflow or outflow of material. If material was inflowing or outflowing, it would need to be continually replenished or destroyed, or be a short-lived phenomenon, as the amount of absorber material is relatively small (>2×10³M
). Instead, we postulate this neutral material sits spherically around the quasar within its dark matter halo and (some of) its large velocity width comes from the fact that these clouds are moving within the gravitational potential of the halo. It is clear that MUSE, with its large IFU coverage, provides an excellent data set to probe the quasar’s environment over an extended region, including providing important constraints on the properties of its halo gas.
5 C O N C L U S I O N S
We find that thez=3.215 quasar PKS1614+051, with its com-panion active galaxy and connecting bridge of Lyαemitting gas, is surrounded by three other Lyαemitting galaxies, two of which are very close to or within the bridge of material. This overdensity of four galaxies, all within 300 km s−1of each other and within
the virial radius of the quasar, will likely merge to form a massive
at University of Warwick on October 25, 2016
http://mnras.oxfordjournals.org/
MUSE observations of PKS1614
+
051
2395
elliptical galaxy byz∼1, perhaps residing within a group or cluster of galaxies.
The 50 kpc long bridge of Lyαemitting gas stretches between the quasar and companion galaxy A and also extends towards the two other nearby companion galaxies, suggesting that the gas was pulled out from the galaxies during a gravitational interaction between them and the quasar host. The emission line bridge is likely to be predominantly photoionized by the quasar and its AGN companion as its surface brightness rises towards them both, although the lack of CIVor HeIIin the bridge suggests a relatively low ionization
parameter. The quasar’s Lyαline is strongly double peaked, likely due to absorption by a neutral halo of gas at the systemic velocity of the quasar extending at least 50 kpc in radius with a mass of at least∼2×10³M
. The Lyαbridge is probably a separate phase to the much larger neutral halo surrounding the quasar, which it is embedded in, as the Lyαabsorption profile goes nearly completely black indicating virtually all of the Lyαphotons at that wavelength have been scattered out of the line of sight. In addition, we must be looking at the system through a significant path length of neutral material to see similar absorption across the entire system. This picture of the quasar, bridge and companion galaxies embedded in a large neutral halo is consistent with the absorption systems commonly found around quasars using a background quasar as a probe by e.g. Prochaska et al. (2013a). The fact that we see the bridge and both of the AGNs, and that we see neutral material in both the line of sight to the quasar and transverse to it, suggests the quasar is emitting isotropically and any obscuring torus obstructs only a small solid angle as seen from the nucleus.
The large field of the MUSE IFU allows the exploration of the quasar environments on a wide range of scales. The clustering of galaxies at the quasar redshift can be studied simultaneously with the small-scale exploration of the quasar’s gaseous environment using Lyαabsorption of faint sources in the immediate environment. This use of self-absorption, rather than using a rare background quasar to probe a single line of sight, is a potentially powerful technique for exploring the close environments of quasars, given the prevalence of extended Lyαemission.
This work demonstrates the effectiveness and efficiency of MUSE for elucidating the observational details of galaxy interactions and growth at high redshift. While a single pointing can explore the early growth of clustering, minimal tiling of several MUSE pointings should ideally sample the larger scale protocluster environment at these redshifts.
AC K N OW L E D G E M E N T S
KH acknowledges funding from STFC. This research is based on observations made with ESO telescopes at the La Silla Paranal Observatory under programme ID 60.A-9323(A). We thank all the staff at Paranal Observatory for their valuable support during the commissioning of MUSE.
R E F E R E N C E S
Arrigoni Battaia F., Hennawi J. F., Prochaska J. X., Cantalupo S., 2015a, preprint (arXiv:1504.03688)
Arrigoni Battaia F., Yang Y., Hennawi J. F., Prochaska J. X., Matsuda Y., Yamada T., Hayashino T., 2015b, ApJ, 804, 26
Bacon R. et al., 2012, The Messenger, 147, 4
Bennett C. L., Larson D., Weiland J. L., Hinshaw G., 2014, ApJ, 794, 135 Bertin E., Arnouts S., 1996, A&AS, 117, 393
Bremer M. N., Johnstone R. M., 1995, MNRAS, 277, L51 Cantalupo S., Porciani C., Lilly S. J., Miniati F., 2005, ApJ, 628, 61 Cantalupo S., Arrigoni-Battaia F., Prochaska J. X., Hennawi J. F., Madau P.,
2014, Nature, 506, 63
Charlot S., Fall S. M., 1993, ApJ, 415, 580
Chiang Y.-K., Overzier R., Gebhardt K., 2013, ApJ, 779, 127
Christensen L., Jahnke K., Wisotzki L., S´anchez S. F., 2006, A&A, 459, 717 Di Matteo T., Colberg J., Springel V., Hernquist L., Sijacki D., 2008, ApJ,
676, 33
Djorgovski S., Spinrad H., McCarthy P., Strauss M. A., 1985, ApJ, 299, L1 Djorgovski S., Strauss M. A., Spinrad H., McCarthy P., Perley R. A., 1987,
AJ, 93, 1318
Ellison S. L., Patton D. R., Simard L., McConnachie A. W., 2008, AJ, 135, 1877
Heckman T. M., Miley G. K., Lehnert M. D., van Breugel W., 1991a, ApJ, 370, 78
Heckman T. M., Lehnert M. D., Miley G. K., van Breugel W., 1991b, ApJ, 381, 373
Hennawi J. F., Prochaska J. X., 2013, ApJ, 766, 58 Hennawi J. F. et al., 2006, ApJ, 651, 61
Hennawi J. F., Prochaska J. X., Cantalupo S., Arrigoni-Battaia F., 2015, Science, 348, 779
Herenz E. C., Wisotzki L., Roth M., Anders F., 2015, A&A, 576, A115 Hu E. M., Cowie L. L., 1987, ApJ, 317, L7
Hu E. M., Songaila A., Cowie L. L., Stockton A., 1991, ApJ, 368, 28 Husband K., Bremer M. N., Stanway E. R., Davies L. J. M., Lehnert M. D.,
Douglas L. S., 2013, MNRAS, 432, 2869
Kollmeier J. A., Zheng Z., Dav´e R., Gould A., Katz N., Miralda-Escud´e J., Weinberg D. H., 2010, ApJ, 708, 1048
McGreer I. D., Fan X., Strauss M. A., Haiman Z., Richards G. T., Jiang L., Bian F., Schneider D. P., 2014, AJ, 148, 73
Orienti M., Dallacasa D., Tinti S., Stanghellini C., 2006, A&A, 450, 959 Prescott M. K. M., Dey A., Jannuzi B. T., 2009, ApJ, 702, 554 Prochaska J. X., Hennawi J. F., 2009, ApJ, 690, 1558 Prochaska J. X. et al., 2013a, ApJ, 776, 136
Prochaska J. X., Hennawi J. F., Simcoe R. A., 2013b, ApJ, 762, L19 Springel V. et al., 2005, Nature, 435, 629
Toshikawa J. et al., 2012, ApJ, 750, 137 Turner E. L., 1991, AJ, 101, 5
van Ojik R., Roettgering H. J. A., Miley G. K., Hunstead R. W., 1997, A&A, 317, 358
Verhamme A., Schaerer D., Maselli A., 2006, A&A, 460, 397
Villar-Mart´ın M., S´anchez S. F., Humphrey A., Dijkstra M., di Serego Alighieri S., De Breuck C., Gonz´alez Delgado R., 2007, MNRAS, 378, 416
Yang Y., Zabludoff A. I., Dav´e R., Eisenstein D. J., Pinto P. A., Katz N., Weinberg D. H., Barton E. J., 2006, ApJ, 640, 539
This paper has been typeset from a TEX/LATEX file prepared by the author.
MNRAS452,2388–2395 (2015)
at University of Warwick on October 25, 2016
http://mnras.oxfordjournals.org/