http://go.warwick.ac.uk/lib-publications
Original citation:
Carter, P. J., Steeghs, D. (Danny), 1972-, de Miguel, E., Goff, W., Koff, R. A., Krajci, T.,
Marsh, T. R., Gänsicke, B. T. (Boris T.), Breedt, E., Groot, P. J., Nelemans, G., Roelofs,
G. H. A., Rau, A., Koester, D. and Kupfer, T.. (2013) The helium-rich cataclysmic
variable SBSS 1108+574. Monthly Notices of the Royal Astronomical Society, Vol.431
(No.1). pp. 372-382. ISSN 0035-8711
Permanent WRAP url:
http://wrap.warwick.ac.uk/53857/
Copyright and reuse:
The Warwick Research Archive Portal (WRAP) makes the work of researchers of the
University of Warwick available open access under the following conditions.
© 2013 The Authors Published by Oxford University Press on behalf of the Royal
Astronomical Society
This is an Open Access article distributed under the terms of the Creative Commons
Attribution Non-Commercial License (http://creativecommons.org/licenses/by-nc/3.0/),
which permits non-commercial re-use, distribution, and reproduction in any medium,
provided the original work is properly cited. For commercial re-use, please contact
[email protected]
A note on versions:
The version presented in WRAP is the published version, or, version of record, and may
be cited as it appears here.
Advance Access publication 2013 March 07
The helium-rich cataclysmic variable SBSS 1108
+
574
P. J. Carter,
1‹D. Steeghs,
1E. de Miguel,
2,3W. Goff,
4R. A. Koff,
5T. Krajci,
6T. R. Marsh,
1B. T. G¨ansicke,
1E. Breedt,
1P. J. Groot,
7G. Nelemans,
7,8G. H. A. Roelofs,
9A. Rau,
10D. Koester
11and T. Kupfer
71Department of Physics, University of Warwick, Coventry CV4 7AL, UK
2Departamento de F´ısica Aplicada, Universidad de Huelva, 21071 Huelva, Spain
3CBA (Huelva), Observatorio del CIECEM, Huelva, Spain
4CBA (Sutter Creek), 13508 Monitor Lane, Sutter Creek, CA 95685, USA
5CBA (Colorado), Antelope Hils Observatory, 980 Antelope Drive West, Bennet, CO 80102, USA
6CBA (New Mexico), PO Box 1351 Cloudcroft, NM 88317, USA
7Department of Astrophysics/IMAPP, Radboud University Nijmegen, PO Box 9010, 6500 GL Nijmegen, the Netherlands
8Institute for Astronomy, KU Leuven, Celestijnenlaan 200D, 3001 Leuven, Belgium
9Harvard–Smithsonian Center for Astrophysics, 60 Garden Street, Cambridge, MA 02138, USA
10Max-Planck Institute for Extraterrestrial Physics, Giessenbachstr. 1, Garching 85748, Germany
11Institut f¨ur Theoretische Physik und Astrophysik, University of Kiel, 24098 Kiel, Germany
Accepted 2013 January 28. Received 2013 January 25; in original form 2012 December 8
A B S T R A C T
We present time-resolved spectroscopy and photometry of the dwarf nova SBSS 1108+574, obtained during the 2012 outburst. Its quiescent spectrum is unusually rich in helium, showing broad, double-peaked emission lines from the accretion disc. We measure a line flux ratio He I 5875/Hα =0.81 ±0.04, a much higher ratio than typically observed in cataclysmic
variable stars (CVs). The outburst spectrum shows hydrogen and helium in absorption, with weak emission of Hαand HeI6678, as well as strong HeIIemission.
From our photometry, we find the superhump period to be 56.34±0.18 min, in agreement with the previously published result. The spectroscopic period, derived from the radial veloci-ties of the emission lines, is found to be 55.3±0.8 min, consistent with a previously identified photometric orbital period, and significantly below the normal CV period minimum. This indicates that the donor in SBSS 1108+574 is highly evolved. The superhump excess derived from our photometry implies a mass ratio ofq=0.086±0.014. Our spectroscopy reveals a grazing eclipse of the large outbursting disc. As the disc is significantly larger during outburst, it is unlikely that an eclipse will be detectable in quiescence. The relatively high accretion rate implied by the detection of outbursts, together with the large mass ratio, suggests that SBSS 1108+574 is still evolving towards its period minimum.
Key words: accretion, accretion discs – binaries: close – stars: individual: SBSS 1108+574 – novae, cataclysmic variables – white dwarfs.
1 I N T R O D U C T I O N
Cataclysmic variable stars (CVs) consist of a white dwarf accreting from a Roche lobe filling main-sequence, slightly evolved, or brown dwarf companion. In systems where the white dwarf only has a weak or no magnetic field, an accretion disc forms around the white dwarf [see Warner (1995) for a detailed review].
From the start of mass transfer, CVs evolve towards shorter or-bital periods, due to loss of oror-bital angular momentum via magnetic braking (Verbunt & Zwaan 1981) and gravitational wave radiation
E-mail: [email protected]
(Faulkner 1971; King 1988). A period minimum occurs when the mass of the donor becomes too low to sustain hydrogen burning, and it is driven out of thermal equilibrium, becoming partially de-generate, and no longer shrinks in response to mass loss (Rappaport, Joss & Webbink 1982). As the donor continues to lose mass, the orbital period increases, and the system evolves back to longer pe-riods, with decreasing mass transfer rates. The period minimum for normal hydrogen-rich CVs is predicted theoretically to occur at∼65–70 min (Rappaport et al. 1982; Kolb & Baraffe 1999), and is observed at∼80 min (G¨ansicke et al. 2009).
There are a small number of CVs and related systems that have orbital periods below this minimum, including three confirmed CVs that have evolved donors – stars that have been stripped of most of
C
2013 The Authors
Published by Oxford University Press on behalf of the Royal Astronomical Society. This is an Open Access article distributed under the terms of the Creative Commons Attribution License (http://creativecommons.org/licenses/by/3.0/), which permits unrestricted reuse, distribution, and reproduction in any medium, provided the original work is properly cited.
at University of Warwick on April 9, 2013
http://mnras.oxfordjournals.org/
their hydrogen by mass-transfer or prior to the onset of mass-transfer (V485 Cen; Augusteijn et al. 1996; G¨ansicke et al. 2003; EI Psc, Thorstensen et al. 2002; CSS100603:112253−111037, Breedt et al. 2012). The majority of the known ultracompact mass-transferring binaries belong to the small class known as the AM Canum Venati-corum (AM CVn) binaries. These consist of a white dwarf accreting from a hydrogen-deficient (semi-)degenerate donor, allowing them to reach their short orbital periods (5 to∼65 min; see Solheim 2010 for a recent review). See Breedt et al. (2012) for further discussion of the evolution and population of systems below the CV period minimum.
A subset of CVs, known as dwarf novae, shows outbursts, in which the system brightens by several magnitudes for a period of days to weeks. These outbursts are thought to be caused by thermal instabilities in the accretion disc (Meyer & Meyer-Hofmeister 1981; Osaki 1989), and have been the subject of considerable observa-tional and theoretical study. Some dwarf novae show superoutbursts in addition to the normal outbursts; these last longer and are gener-ally brighter. During a superoutburst, tidal interactions between the disc and the donor star cause the disc to become asymmetric. This results in periodic modulations in the light curve, known as super-humps (e.g. Whitehurst 1988). This superhump period is typically a few per cent longer than the orbital period, and is related to the mass ratio of the system (e.g. Patterson et al. 2005). The origin of superhumps is discussed in detail by Wood et al. (2011).
Here we present time-resolved optical spectroscopy and photometry of the helium-rich CV, SBSS 1108+574 (SDSS J111126.83+571238.6). The system was identified via a survey designed to uncover AM CVn binaries in the photometric data base of the Sloan Digital Sky Survey (Roelofs et al. 2009; Carter et al. 2013). Its spectrum shows unusually strong He I emission in addition to the Balmer emission lines. It was discovered in outburst on 2012 April 22 by the Catalina Real-Time Transient Survey (CRTS; Drake et al. 2009), and reported as a new SU UMa dwarf nova by Garnavich et al. (2012). Kato et al. (2012) presented photometry of the outburst, and identified a possible orbital period of 55.367 min, in addition to superhumps.
2 O B S E RVAT I O N S
2.1 Optical spectroscopy
We obtained time-resolved spectroscopy of SBSS 1108+574 on 2012 February 28 and 2012 April 20 with the Gemini Multi-Object Spectrograph (GMOS; Hook et al. 2004) at the Gemini-North tele-scope on Mauna Kea, Hawaii. We used the B600+grating with a 1 arcsec slit. GMOS has three 2048×4608 e2v deep deple-tion CCDs, which were used in six amplifier mode. The resulting spectra cover the wavelength range 4120–6973 Å, with an average dispersion of 1.85 Å per pixel.
The observations consist of 65 spectra in total, most of which have an exposure time of 173 s. The observations in February were cut short after only about one half of the binary orbit, and so are insufficient to determine the orbital period of the system. A second attempt was made to complete a 3 h observing block on 2012 April 20, when the system was caught in an unexpected outburst (it had not been identified as a dwarf nova prior to this outburst.). These spectra cover approximately three binary orbits. The log of our spectroscopic observations is given in Table 1.
Table 1. Summary of our spectroscopic observations of
SBSS 1108+574.
Date UT Exposure time (s) Exposures
2012 Feb 28 10:49–11:24 180 11
2012 Apr 20 06:06–08:55 173 54
The spectra were reduced using optimal extraction as imple-mented in thePAMELA1 code (Marsh 1989), which also uses the STARLINKpackagesKAPPA,FIGAROandCONVERT. Wavelength calibra-tion was obtained from copper–argon arc lamp exposures taken at the start of the first set of spectra, and at the start, middle and end of the observations during the second block. About 10 arc lines were identified for each of the six sections of the spectra, and fitted with fourth order polynomials, resulting in root mean square residuals of approximately 0.15 Å.
The spectra were corrected for instrumental response and flux-calibrated using the standard star Feige 34, observed as part of the Gemini baseline calibration programme. The spectra are not cor-rected for slit losses, so the flux calibration is not absolute; however, the relative flux calibration and continuum slope are reliable.
2.2 Photometry
SBSS 1108+5742was detected in outburst on 2012 April 22 by the CRTS, at a magnitude of 15.5. This is the only outburst of the system detected by CRTS during its six year coverage. It has also been observed on three occasions by the Sloan Digital Sky Survey (SDSS; see Table 2), indicating a previous outburst occurred on 2003 March 6, when it was detected at ag-magnitude of 15.6.
Differential photometry was carried out by four observers of the Centre for Backyard Astrophysics (CBA), the observations span-ning a total of ∼135 h between 2012 April 23 and 2012 May 15. Details of the observers, locations and equipment are given in Table 3, and a log of our observations is given in Table 4. Unfil-tered images were taken with exposure times in the range 50–120 s, while exposures using theVfilter had integration times of 120 or 240 s. The comparison star was either GSC 3827−0886 or GSC 3827−0824, and all data were placed on to a common magnitude scale with uncertainties no larger than ∼0.05 mag. Magnitudes reported here are formed from adding theVmagnitude of the com-parison star to our differential magnitudes, and do not correspond to any standard system. Heliocentric corrections were applied to all observation times prior to analysis.
3 R E S U LT S
3.1 Average spectral features
The average quiescent spectrum of SBSS 1108+574 is shown in Fig. 1. It shows a blue continuum with strong broad emission lines of both hydrogen and helium. The helium lines are unusually strong, similarly to those seen in CSS1122−1110 (Breedt et al. 2012), distinguishing SBSS 1108+574 from other dwarf novae. Fig. 6 in Carter et al. (2013) shows the Hαand HeI5875 equivalent widths
1
PAMELA is included in the STARLINK distribution ‘Hawaiki’ and later
releases. The STARLINK Software Group homepage can be found at
http://starlink.jach.hawaii.edu/starlink.
2SBSS 1108+574 was assigned the CRTS ID CSS120422:111127+571239
after the outburst.
at University of Warwick on April 9, 2013
http://mnras.oxfordjournals.org/
Table 2. SDSS observations of SBSS 1108+574.
MJD u g r i z
52233.50 18.92±0.03 19.23±0.02 19.27±0.02 19.29±0.02 19.39±0.06
52704.27 15.91±0.01 15.62±0.01 15.82±0.01 16.00±0.01 16.17±0.02
[image:4.595.67.262.168.233.2]52708.37 15.82±0.02 15.67±0.02 15.85±0.02 16.04±0.02 16.23±0.03
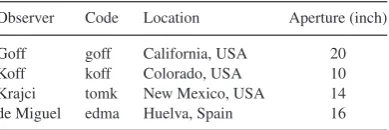
Table 3. Details of the observers, location and telescope aper-tures used for the photometry.
Observer Code Location Aperture (inch)
Goff goff California, USA 20
Koff koff Colorado, USA 10
Krajci tomk New Mexico, USA 14
de Miguel edma Huelva, Spain 16
of this system in relation to the normal CV population. It is also worth noting the similarity between the colour of SBSS 1108+574 and the AM CVn binaries [see fig. 11 in Carter et al. (2013)].
The HeI lines and Hβ all show signs of being triple-peaked, exhibiting a central emission component in addition to the classic double-peaked emission from the accretion disc. A weak ‘central spike’ is a phenomenon almost never seen in CVs, but it is seen in the similar system CSS1122−1110. This central emission component has a low radial velocity amplitude, and is identified as originating on or close to the surface of the accreting white dwarf (Marsh 1999;
Table 4. Log of our photometric observations. C corresponds to unfiltered frames.
HJD start HJD end Observer Exposures Filter Mean magnitude
245 6041.359 245 6041.624 edma 356 C 16.05
245 6041.627 245 6041.853 koff 257 C 16.10
245 6042.354 245 6042.628 edma 368 C 16.21
245 6042.622 245 6042.911 koff 248 C 16.28
245 6044.755 245 6044.910 tomk 265 C 16.38
245 6045.624 245 6045.919 koff 298 C 16.44
245 6046.660 245 6046.938 goff 170 C 16.53
245 6047.628 245 6047.914 koff 227 C 16.60
245 6047.660 245 6047.958 goff 96 V 16.60
245 6048.411 245 6048.461 edma 48 C 16.59
245 6052.698 245 6052.932 goff 150 V 16.76
245 6053.696 245 6053.885 tomk 178 C 16.78
245 6054.382 245 6054.552 edma 156 C 16.74
245 6054.670 245 6054.921 goff 150 V 16.70
245 6055.362 245 6055.464 edma 90 C 16.65
245 6056.399 245 6056.598 edma 90 C 16.77
245 6056.669 245 6056.939 goff 164 V 16.75
245 6057.365 245 6057.549 edma 172 C 16.69
245 6059.380 245 6059.463 edma 78 C 16.88
245 6059.669 245 6059.928 goff 156 V 16.92
245 6060.669 245 6060.922 goff 151 V 16.87
245 6061.702 245 6061.916 goff 132 V 16.95
245 6062.360 245 6062.546 edma 173 C 17.07
245 6062.677 245 6062.809 goff 84 V 17.14
245 6062.658 245 6062.860 koff 155 C 17.17
245 6063.371 245 6063.480 edma 102 C 17.15
Figure 1. Average spectrum of SBSS 1108+574 in quiescence. The most prominent lines have been labelled.
at University of Warwick on April 9, 2013
http://mnras.oxfordjournals.org/
[image:4.595.49.542.289.712.2] [image:4.595.45.543.295.713.2]Morales-Rueda et al. 2003). It is likely that the appearance of this feature in the average spectrum (Fig. 1) is due to the contribution of the bright spot, which does not completely average out due to incomplete coverage of the binary orbit.
The quiescent Gemini spectrum of SBSS 1108+574 shows broad depressions near 4340 Å and 4870 Å that we identify as Hγ and Hβabsorption lines from the white dwarf photosphere. These ab-sorption profiles are substantially perturbed by the Balmer and He emission lines, preventing a meaningful estimate of the white dwarf atmospheric properties from the optical data alone.GALEXhas de-tected SBSS 1108+574 during its All-Sky Imaging Survey (AIS) in the far-ultraviolet (FUV) and near-ultraviolet (NUV) channel, and again as part of the Medium Imaging Survey (MIS) using the NUV channel only (see Table 5). We modelled the Gemini spectrum (correcting the absolute flux tog=19.2, measured in quiescence by SDSS) along with theGALEXbroad-band fluxes using
pure-Table 5. GALEXobservations of SBSS 1108+574.
Date Survey FUV flux (µJy) NUV flux (µJy)
2004 Jan 25 AIS 30.74±5.92 53.64±5.17
2005 Jan 25 MIS 48.25±1.34
Figure 2. Shown in black are the Gemini spectrum, adjusted in flux to
match the quiescent magnitude of SBSS 1108+574 (g=19.2), and the UV
fluxes measured byGALEX. A white dwarf withMwd=0.6 MandTeff=
12000 K at a distance of 290 pc (shown in red) adequately matches the broad Balmer line profiles in the GMOS spectrum, and the UV fluxes. More accurate atmospheric parameters will require FUV spectroscopy.
hydrogen white dwarf atmosphere models from Koester (2010). For an adopted white dwarf mass ofMwd=0.6 Mwe find a tem-perature ofTeff=12000±1000 K, and a distance ofd=290± 30 pc (Fig. 2). Allowing for±0.2 Min the white dwarf mass adds another ±1000 K in the uncertainty of the temperature.
The vast majority of short-period CVs are relatively old systems with typical ages of several Gyr (e.g. Kolb, King & Ritter 1998; Schreiber & G¨ansicke 2003; Knigge, Baraffe & Patterson 2011). The cooling ages implied by their white dwarf primaries are gen-erally much shorter – in the case of SBSS 1108+574, the effective temperature corresponds toτcool4×108yr only. The solution to this conundrum is that the white dwarfs are (re-)heated by ac-cretion. Short-term fluctuations of the mass transfer rate, such as dwarf nova outbursts, affect only their outer envelope of a white dwarf, and the effective temperature responds on time-scales of weeks to years (e.g. G¨ansicke & Beuermann 1996; Sion et al. 1998; Slevinsky et al. 1999). In contrast, the effective temperature de-termined sufficiently long after a dwarf nova outburst reflects the secular mean of the accretion rate over∼105yr (for low ˙Msystems, Townsley & Bildsten 2003; Townsley & G¨ansicke 2009). Adopt-ing a white dwarf mass ofMwd=0.6 M(Mwd=0.9 M), we estimate ˙M∼10−10M
yr−1( ˙M∼3×10⁻¹¹M
yr−1). In addition to the hydrogen and helium lines, FeIIemission at 5169 Å, and Si emission at 6347 Å and 6371 Å are identified.
The average outburst spectrum is shown in Fig. 3. It shows a bluer continuum than the quiescent spectrum, and both helium and hydrogen in absorption, a common feature in outbursting dwarf novae due to the bright, optically thick disc. It also shows He II 4686, Hαand HeI6678 in emission, with the classic double-peaked profile caused by the accretion disc.
Table 6 shows the reduction in equivalent widths of the prominent lines between quiescence and outburst. The ratio of the equivalent widths of Hαto HeI 5875 is approximately three times smaller than typically found in CVs (Carter et al. 2013). From the quiescent spectrum we calculate a line flux ratio HeI5875/Hα=0.81±0.04, a much higher ratio than normally observed in cataclysmic vari-ables, where it is typically 0.2–0.4 (e.g. Williams & Ferguson 1982; Thorstensen & Taylor 2001; Breedt et al. 2012).
3.2 Photometric periods
Nightly light curves for April 23 and April 24 are shown in Fig. 4. A periodic signal of amplitude∼80 mmag is clearly seen during the first two nights.
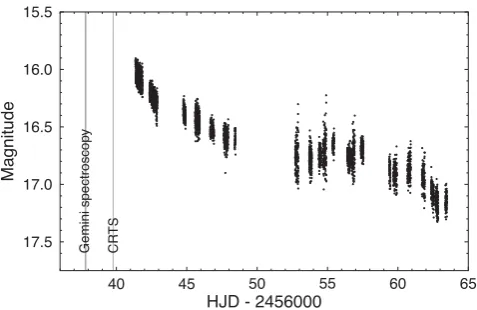
[image:5.595.47.288.257.503.2]The full light curve of our observations is shown in Fig. 5. The system fades at a nearly constant rate of∼0.10 mag d−1over the first week. This is followed by a period of∼6–10 d over which
Figure 3. Average spectrum of SBSS 1108+574 during outburst. The most prominent lines have been labelled.
at University of Warwick on April 9, 2013
http://mnras.oxfordjournals.org/
[image:5.595.50.551.586.713.2]Table 6. Equivalent widths and FWHM of prominent lines. Estimated uncertainties
are for a 1σconfidence level.
Line Quiescent Outburst
EW (Å) FWHM (km s−1) EW (Å) FWHM (km s−1)
Hγ −17.4±2.0 2100±50 3.7±0.3 3500±100
HeI4471 −12.9±1.5 2200±50 1.5±0.2 2000±100
HeII4686 −13.7±1.5a 3300±200 −6.9±0.1 1600±50
Hβ −32.0±2.0 1900±50 1.6±0.3 4400±300
HeI4921 −11.0±1.5 1900±100 ... ...
HeI5015b −18.8±0.5 2400±100 ... ...
HeI5875 −49.0±1.0 2100±50 1.3±0.5 2300±100
Hα −84.0±3.0 1950±50 −5.0±1.0 1700±50
HeI6678 −35.5±1.4 2000±100 −1.3±0.5 1800±200
Note. Values marked ‘...’ could not be measured reliably.
aBlended with He
I4713.
bThe red wing falls in the gap between the CCDs, and may be blended with He
[image:6.595.42.550.232.574.2]I5047.
Figure 4. Light curves for April 23 and April 24. Each light curve spans∼12 h.
the mean magnitude remains essentially constant; afterwards, the system resumes its way to its low state. Oscillations were observed in all nightly light curves, although they tended to become less well-defined as the system turned fainter and the signal-to-noise ratio decreased. The amplitude was not seen to change appreciably. The Lomb–Scargle periodogram of the whole data set is shown in Fig. 6. We first removed any obvious trend in the nightly light curves and subtracted the nightly mean magnitude. The frequency of the fundamental signal is found at 25.56 cycles d−1, corresponding to a period of 56.34 min. The presence of a close peak at 25.64 cycles d−1 with nearly the same power is an indication of variations in the periodicity of the fundamental signal during the time spanned by
our observations. As the superhump signal is not totally periodic, the power spreads out, resulting in the second peak. This period instability is typical of superhumps and rules out a possible orbital nature of the fundamental signal. The±1 cycle d−1aliases are also clear in Fig. 6.
AnO−Canalysis of our data confirms the variation in the period over the time spanned by our observations. This period instability has a significant impact on the accuracy with which we can deter-mine the superhump period; we therefore take the strongest peak in the periodogram as our superhump period, and use the separation of the two strong peaks as an estimate of the uncertainty on this period, 56.34±0.18 min. This estimated uncertainty is consistent
at University of Warwick on April 9, 2013
http://mnras.oxfordjournals.org/
Figure 5. Full light curve of our photometric observations, showing the times of our spectroscopic observations and the detection by the CRTS.
Figure 6. Lomb–Scargle periodogram of the photometric data set. The lower panel shows the detail around the strongest peak. The fundamental frequency and an additional peak that is not identified as due to aliasing are indicated by arrows. We interpret these signals as the superhump period and orbital period of the binary.
with the variation revealed by theO−Canalysis. The phase-folded light curve constructed from the first two nights of observations is shown in Fig. 7.
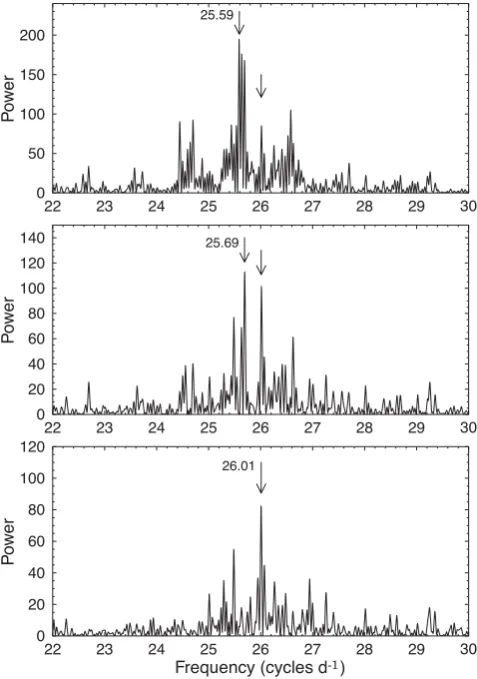
[image:7.595.310.546.56.230.2]There is an additional peak centred at 26.01 cycles d−1which seems to bear no relation with the time windowing of our observa-tions. This is identified as corresponding to the underlying orbital motion, giving a period of 55.36±0.03 min, and confirming the findings of Kato et al. (2012). This signal remains after prewhiten-ing the light curve with the main frequency at 25.56 cycles d−1, and is the strongest signal remaining after sequentially prewhitening the residual light curve with two further strong frequencies (25.59
Figure 7. Light curve of the first two nights of observations, folded on the detected superhump period, 56.34 min. The zero phase is arbitrary.
and 25.69 cycles d−1) associated with the superhumps (see Fig. 8). We also find relatively strong signals corresponding to the third and fourth harmonics of this frequency. The strength of these peaks would not be unexpected given the sharp dip that would be caused by a possible eclipse of the disc (see section 3.6). This supports the identification of this frequency as corresponding to the orbital period.
3.3 The spectroscopic period
To find the spectroscopic period we measured the radial velocity variation of the emission lines using the single Gaussian technique of Schneider & Young (1980), as implemented inMOLLY.3We varied the full width at half-maximum (FWHM) of this Gaussian from 200 to 3000 km s−1. For each resulting radial velocity curve we calculated the Lomb–Scargle periodogram (Scargle 1982), and fit the radial velocities with a circular orbit of the form
V(t) = Ksin
2π(t−t0) Porb
+γ, (1)
wherePorbis derived from the strongest peak in the periodogram. Examining the results, we determine that the errors are smallest for an FWHM of∼2200 km s−1for the He
II4686 line. We use such a wide Gaussian as this gives an average of the velocity over the entire line, minimizing the errors introduced by the unusual structure of the lines from the outbursting disc. We show the Lomb–Scargle periodogram calculated from the HeIIradial velocities in Fig. 9. A clear signal is seen at 26.03 cycle d−1, corresponding to a period of 55.3 min. The HeII4686 radial velocity curve, folded on this period, is shown in Fig. 10. The parameters of the fits to equation (1), derived from the radial velocity measurements, are shown in Table 7. We take the zero phase, HJD0, as being defined by the blue to red crossing of the velocities.
There is considerable scatter around the radial velocity curve shown in Fig. 10, which is likely caused by the unusual line structure during the outburst (see Fig. 11). Calculating the radial velocities from the line wings using two narrower Gaussians gives similar results, but the effect of the unusual structure causes greater scatter
3
MOLLY was written by T. R. Marsh and is available from
http://www.warwick.ac.uk/go/trmarsh/software.
at University of Warwick on April 9, 2013
http://mnras.oxfordjournals.org/
[image:7.595.45.288.255.540.2]Figure 8. Periodograms of the photometric data set after prewhitening. The top panel shows the periodogram after prewhitening the data with the
previously identified strongest frequency at 25.56 cycles d−1(see Fig. 6).
The strongest peak is at 25.59 cycles d−1. The middle panel shows the
periodogram after prewhitening the previous light curve with the 25.59
cy-cles d−1signal. The strongest peak is now found at a frequency of 25.69
cy-cles d−1. The lower panel shows the periodogram after prewhitening the
previous light curve with the 25.69 cycles d−1signal. The strongest peak
is now found at 26.01 cycles d−1, and is identified as corresponding to
the orbital motion. The strongest peak and the 26.01 cycles d−1signal are
indicated by arrows in each panel.
Figure 9. Lomb–Scargle periodogram calculated from the HeII4686 radial
velocities of SBSS 1108+574. The location of the orbital period identified
[image:8.595.43.282.57.397.2]from the photometry is indicated by the dotted line for comparison.
Figure 10. Measured HeIIradial velocities folded on a period of 55.3 min.
The solid and dotted lines are the best-fitting radial velocity curve andγ
velocity; the parameters are shown in Table 7.
Table 7. Orbit parameters derived from radial velocity measurements.
Porb(min) HJD0 K(km s−1) γ(km s−1)
55.3±0.8 245 6037.7551(4) 111±7 37.1±5.0
in the radial velocities, and greater errors, and so we prefer the single Gaussian method.
The uncertainty on the period was estimated by carrying out 10 000 bootstrap selections of the radial velocity curve. For each subset, 54 radial velocities were selected from the full radial velocity curve, allowing for points to be selected more than once, and the periodogram calculated, taking the strongest peak as the period. The standard deviation of these computed periods, ignoring those that correspond to higher harmonics, is taken as a measure of the uncertainty in the derived orbital period.
3.4 Mass ratio
Superhumps are caused by a resonant interaction between the ac-cretion disc and the donor star that causes the disc to become asym-metric. The increased viscous dissipation caused by this interaction between the donor and the distorted disc leads to the brightness vari-ations observed during dwarf nova superoutbursts. The observed su-perhump period is the beat period between the orbital period of the system and the precession period of the deformed disc (Whitehurst 1988).
As the superhump phenomenon is due to resonance, and the precession rate for resonant orbits depends on the mass ratio of the system, there is a strong link between the superhump period and the mass ratio. The superhump period-excess,
=(Psh−Porb)/Porb, (2)
is found to increase with increasing mass ratio,q. An empirical rela-tion is derived from eclipsing dwarf novae, in which the mass ratio and superhump excess can be measured independently (Patterson et al. 2005; Knigge 2006; Kato et al. 2009).
Of the three alternative–qrelations, the Patterson et al. (2005) form,
=0.18q+0.29q2, (3)
and the Kato et al. (2009) form, both assume=0 whenq=0. This is a reasonable assumption as we would expect a secondary with negligible mass to have a negligible tidal interaction with the disc. The third version of the relation, given by Knigge (2006), does not use this assumption. The Patterson et al. (2005) formulation is
at University of Warwick on April 9, 2013
http://mnras.oxfordjournals.org/
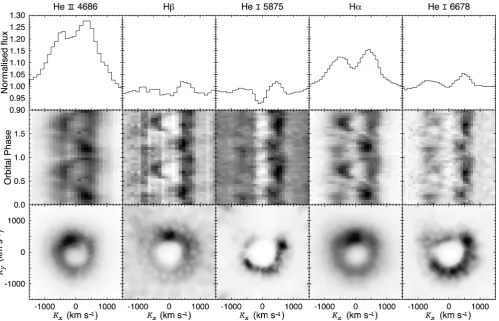
[image:8.595.327.527.243.275.2] [image:8.595.43.285.553.692.2]Figure 11. Average continuum-normalized line profiles, phase-folded trailed spectra and Doppler maps of the strongest lines in the outburst spectra. The
tomograms for Hβand HeI5875 were created after subtracting a spline fit to the background.
usually favoured for AM CVn binaries (Breedt et al. 2012), as ob-servations of the only known eclipsing system, SDSS J0926+3624, agree best with this form (Copperwheat et al. 2011), and so we use that version here.
The total time covered by our spectroscopic observations is not sufficiently long to reach the accuracy of the photometric pe-riods, and so we take the weak additional signal in Fig. 6 as the orbital period. As the superhump period varies during our observations, we conservatively take the separation of the two strongest peaks in Fig. 6 as a measure of the uncertainty on the superhump period for calculation of the excess. This gives the superhump excess in SBSS 1108+574, = 0.0176 ± 0.0032, and the mass ratio, q = 0.086 ± 0.014. We note that this is very large compared to the mass ratio found for CSS1122−1110,
q = 0.017 (Breedt et al. 2012), despite the similar orbital periods.
Our larger estimate for the superhump excess is consistent with the value found by Kato et al. (2012) for their stage B superhumps,
=0.0174±0.0002. Using the smaller excess they measured for their stage C superhumps, and the Kato et al. (2009) form of the–q
relation, they derive a mass ratioq=0.06. We note that the values we derive forqusing the Patterson et al. (2005) form of the–q
relation are consistent with the values calculated using the Knigge (2006) form. For our data the Kato et al. (2009) formulation gives a larger value ofq; however, this relation is calibrated using the shorter superhump periods that occur late in the superoutburst, and so likely overestimatesqfor our longer periods from earlier in the superoutburst.
3.5 Dynamic spectrum
The line profiles and trailed spectra for the strongest lines, folded on the orbital period, 55.3 min (26.03 cycles d−1), are shown in Fig. 11. It is clear that there is greater flux in the redshifted line peak than the blueshifted peak; this unexplained asymmetry is often seen in the spectra of outbursting CVs. We also note the presence of underlying absorption due to the optically thick outbursting disc; this is particularly noticeable in the HeI5875 line, and makes the S-wave difficult to discern when it crosses the line centres.
An S-wave is clear in the strongest line, HeII4686, but becomes weaker with decreasing line strength. The presence of this S-wave can be seen in the other lines shown in Fig. 11; however, the HeI lines appear to show a brighter varying signal with higher veloci-ties than the S-wave, that is almost in anti-phase. A second varying signal is also seen in the Hαtrailed spectrum. This feature is likely responsible for the strength of the second harmonic in the peri-odograms of these lines. There is no coherent S-wave visible in the trailed spectra when folded on these second harmonic frequencies; thus we are confident that we have identified the correct period of this system.
The corresponding Doppler tomograms (Marsh & Horne 1988) give a similar picture of emission in the disc. A bright spot is clearly visible in the maps for HeII4686, Hαand Hβ. The bright spot is not usually seen in CVs during outburst, as the bright outbursting disc normally outshines it. Since these were calculated using the same zero phase for all lines, assumed from the HeII4686 radial velocities, HJD0=245 6037.7551, the maps may be rotated due
at University of Warwick on April 9, 2013
http://mnras.oxfordjournals.org/
to the unknown phase shift between our zero phase and the true zero phase of the white dwarf. Note that the bright spot appears at slightly different phases in each line. The extended bright spot seen in Hαoverlaps in phase with the bright spots seen in both HeII4686 and Hβ. Some evidence of the bright spot may also be seen in the Doppler maps of the HeIlines; however, they are dominated by the brighter varying signal causing the band of increased emission in the right-hand quadrants.
We note that we do not detect the presence of spiral arms in our data. Spiral arms have been observed in a number of dwarf novae during outburst (e.g. Steeghs 2001; Baba et al. 2002), and are thought to be caused by the tidal effect of the donor on the large disc. As our observations may correspond to an early point in the evolution of the outburst, it is possible that spiral arms develop later in the outburst.
The Hβline profile reveals a strong feature in the high velocity wing of the blueshifted peak, centred at about−800 km s−1. The redshifted peak also extends beyond the range of the bright spot visible in the trailed spectrum. The origin of this feature is unclear, and it appears in the Doppler map as a ring of emission at higher velocity than most of the disc emission.
We detect no rotation between Doppler maps created using only the first and only the third orbit, further verifying our identification of the orbital period.
We plot the Roche lobes and stream velocities for aq=0.086 binary together with the HeII4686 Doppler map in Fig. 12. The velocity positions of the accretor, donor and centre of mass are also shown. Again, the map may be rotated about its origin due to the unknown phase shift between our assumed zero phase and the true zero phase.
3.6 Grazing eclipse
[image:10.595.308.544.54.236.2]The trailed spectra (Fig. 11) show a slight reduction in the line flux at a phase of∼1. To examine this further we construct a light curve
Figure 12. HeII4686 Doppler map overplotted with Roche lobes and
stream velocities of aq=0.086 binary. The map was rotated by applying a
[image:10.595.45.285.468.690.2]−0.08 phase shift compared to the maps in Fig. 11.
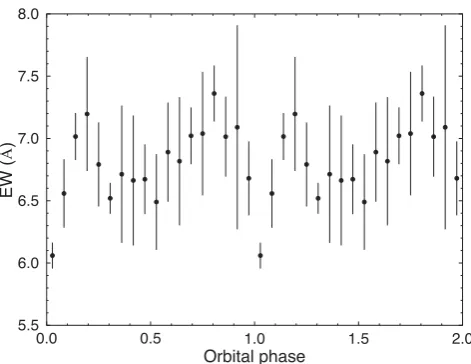
Figure 13. Binned, phase-folded HeII4686 EW against orbital phase. The
dip at about phase zero is attributed to a grazing eclipse of the accretion disc. Note that the EW axis has a narrow range; the depth of the eclipse is approximately 11 per cent.
of the HeII4686 EW, shown in Fig. 13. This reveals a clear dip, which we attribute to an eclipse of the outer disc.
This allows us to constrain the inclination of the system, as it must be large enough that the outer edge of the disc can be eclipsed. Since there is no eclipse of the inner disc or the accretor, we can also place an upper limit on its value. Using our derived value for
q, the Eggleton (1983) formula for the Roche lobe radius of the secondary, and the approximate tidal limit for the maximum radius of the accretion disc (e.g. Warner 1995), we find 63◦.8±1.◦0<i<
78.◦6±0◦.6.
The outbursting disc is expected to be larger than the quiescent disc, significantly increasing the likelihood of a grazing eclipse during outburst. It is therefore likely that there will be no eclipse detectable in quiescence.
4 D I S C U S S I O N
The strength of the helium emission lines compared to the hydrogen lines in the average spectrum (Fig. 1 and Table 6) highlights the unusual nature of this system. Whilst a detailed abundance analysis cannot be carried out with our current data, this is a strong indication of a much greater helium abundance than normally seen in CVs. Models of accretion discs and donors in CVs and AM CVns indicate that very little hydrogen is required to excite strong Balmer lines (Williams & Ferguson 1982; Marsh, Horne & Rosen 1991; Nagel, Rauch & Werner 2009; Nelemans et al. 2010), and the hydrogen abundance in SBSS 1108+574 may be significantly lower than 10 per cent.
Our derived period, 55.3±0.8 min (26.03±0.38 cycles d−1), is well below the CV period minimum, clearly indicating that the donor is significantly evolved, having been stripped of most of its hydrogen by mass-transfer or prior to the onset of mass-transfer. Our spectroscopic period favours the weak 55.36 min (26.01±0.01 cycles d−1) signal detected from the photometry and identified as the orbital period, over the 56.34 min (25.56 cycles d−1) signal identified as the superhump period. We are therefore confident that the candidate orbital period signal detected in our photometry and by Kato et al. (2012) is the correct orbital period. This confirms SBSS 1108+574 as one of the shortest period CVs known, and places it well within the AM CVn period range.
at University of Warwick on April 9, 2013
http://mnras.oxfordjournals.org/
There are three proposed formation channels for the AM CVn binaries, defined by the type of donor. The donor can be (1) a sec-ond, lower mass white dwarf (Paczy´nski 1967; Faulkner, Flannery & Warner 1972), (2) a semi-degenerate helium star (Savonije, de Kool & van den Heuvel 1986; Iben & Tutukov 1987) or (3) an evolved main-sequence star that has lost most of its hydrogen en-velope. The latter is thought to form via the ‘evolved CV’ channel (Sienkiewicz 1984; Tutukov et al. 1985; Thorstensen et al. 2002; Podsiadlowski, Han & Rappaport 2003), but this formation channel has generally been considered to be unimportant in comparison to the double white dwarf and helium star channels. Podsiadlowski et al. (2003), however, argue that the evolved CV channel could contribute a significant fraction of the total AM CVn binary popu-lation. SBSS 1108+574 has all the characteristics of an AM CVn progenitor in the evolved CV formation channel.
It must be noted that not all CVs with evolved donors reach-ing periods below the normal period minimum will form AM CVn binaries as they are currently recognized (Yungelson et al., in prepa-ration). Many systems will in fact reach their own period ‘bounce’, and evolve back towards longer orbital periods, without depleting their hydrogen sufficiently to appear as AM CVn binaries. Current models suggest that the fraction of evolved CV channel AM CVn bi-naries may be lower than previously predicted (Podsiadlowski et al. 2003; Yungelson et al., in preparation). It is clear, however, that sys-tems like SBSS 1108+574 and CSS1122−1110 (Breedt et al. 2012) fall between the standard definitions of AM CVn binaries and CVs. The large mass ratio we derive,q=0.086± 0.014, indicates a different evolution to the standard AM CVn binary population; for GP Com (Porb =46.6 min; Marsh 1999),q=0.018 (Roelofs et al. 2007), and for V396 Hya (Porb=65.1 min; Ruiz et al. 2001), q=0.013 (Steeghs 2010). The fact that the system shows outbursts indicates that the mass transfer rate is still relatively high, which is not expected for AM CVn binaries that have passedPminand evolved back to long periods (e.g. Nelemans 2005; Kotko et al. 2012). Compare our estimated accretion rate, ˙M∼10−10M
yr−1(for a 0.6 Maccretor), to the value Roelofs et al. (2007) derived for GP Com, ˙M <3.6×10⁻¹²M
yr−1, and the value Nagel et al. (2009) estimated for V396 Hya, ˙M∼10−11M
yr−1, again presenting a strong contrast between SBSS 1108+574 and the long period AM CVn binaries. This indicates that SBSS 1108+574 is still evolving towards shorter orbital periods, becoming increasingly helium-rich.
5 C O N C L U S I O N
We have presented time-resolved spectroscopy of the helium-rich dwarf nova SBSS 1108+574 (SDSS J1111+5712), confirming the period detected photometrically during the 2012 April outburst. The system shows unusually strong helium emission in both outburst and quiescence, suggesting a high helium abundance. We measure the superhump period from our photometry as 56.34±0.18 min, consistent with the result of Kato et al. (2012). The spectroscopic period is found to be 55.3±0.8 min, significantly below the normal period minimum (∼80 min), confirming the system as an ultra-compact CV containing a highly evolved donor. The relatively high accretion rate, together with the large mass ratio, suggests that SBSS 1108+574 is still evolving towards its period minimum.
AC K N OW L E D G E M E N T S
We thank the anonymous referee for useful comments and sugges-tions. PJC acknowledges the support of a Science and
Technol-ogy Facilities Council (STFC) studentship. DS, TRM, BTG and EB acknowledge support from the STFC grant no. ST/F002599/1. TK acknowledges support by the Netherlands Research School for Astronomy (NOVA). GHAR acknowledges an NWO-Rubicon grant. GN acknowledges an NWO-VIDI grant.
Based on observations obtained under programme GN-2012A-Q-54 at the Gemini Observatory, which is operated by the As-sociation of Universities for Research in Astronomy, Inc., under a cooperative agreement with the NSF on behalf of the Gemini partnership: the National Science Foundation (United States), the Science and Technology Facilities Council (United Kingdom), the National Research Council (Canada), CONICYT (Chile), the Aus-tralian Research Council (Australia), Minist´erio da Ciˆencia, Tec-nologia e Inovac¸˜ao (Brazil) and Ministerio de Ciencia, Tecnolog´ıa e Innovaci´on Productiva (Argentina).
Funding for the SDSS and SDSS-II has been provided by the Alfred P. Sloan Foundation, the Participating Institutions, the Na-tional Science Foundation, the U.S. Department of Energy, the National Aeronautics and Space Administration, the Japanese Monbukagakusho, the Max Planck Society and the Higher Ed-ucation Funding Council for England. The SDSS Web Site is http://www.sdss.org/.
Balmer/Lyman lines in the models were calculated with the modi-fied Stark broadening profiles of Tremblay & Bergeron 2009, kindly made available by the authors.
R E F E R E N C E S
Augusteijn T., van der Hooft F., de Jong J. A., van Paradijs J., 1996, A&A, 311, 889
Baba H. et al., 2002, PASJ, 54, L7
Breedt E., G¨ansicke B. T., Marsh T. R., Steeghs D., Drake A. J., Copperwheat C. M., 2012, MNRAS, 425, 2548
Carter P. J. et al., 2013, MNRAS, 429, 2143 Copperwheat C. M. et al., 2011, MNRAS, 410, 1113 Drake A. J. et al., 2009, ApJ, 696, 870
Eggleton P. P., 1983, ApJ, 268, 368 Faulkner J., 1971, ApJ, 170, L99
Faulkner J., Flannery B. P., Warner B., 1972, ApJ, 175, L79 G¨ansicke B. T., Beuermann K., 1996, A&A, 309, L47 G¨ansicke B. T. et al., 2003, ApJ, 594, 443
G¨ansicke B. T. et al., 2009, MNRAS, 397, 2170
Garnavich P., Littlefield C., Marion G. H., Irwin J., Kirshner R. P., Vinko J., 2012, Astron. Telegram, 4112
Hook I. M., Jørgensen I., Allington-Smith J. R., Davies R. L., Metcalfe N., Murowinski R. G., Crampton D., 2004, PASP, 116, 425
Iben I. Jr, Tutukov A. V., 1987, ApJ, 313, 727 Kato T. et al., 2009, PASJ, 61, 395
Kato T. et al., 2012, PASJ, preprint (astro-ph/1210.0678) King A. R., 1988, QJRAS, 29, 1
Knigge C., 2006, MNRAS, 373, 484
Knigge C., Baraffe I., Patterson J., 2011, ApJS, 194, 28 Koester D., 2010, Mem. Soc. Astron. Italiana, 81, 921 Kolb U., Baraffe I., 1999, MNRAS, 309, 1034 Kolb U., King A. R., Ritter H., 1998, MNRAS, 298, L29
Kotko I., Lasota J.-P., Dubus G., Hameury J.-M., 2012, A&A, 544, A13 Marsh T. R., 1989, PASP, 101, 1032
Marsh T. R., 1999, MNRAS, 304, 443
Marsh T. R., Horne K., 1988, MNRAS, 235, 269 Marsh T. R., Horne K., Rosen S., 1991, ApJ, 366, 535 Meyer F., Meyer-Hofmeister E., 1981, A&A, 104, L10
Morales-Rueda L., Marsh T. R., Steeghs D., Unda-Sanzana E., Wood J. H., North R. C., 2003, A&A, 405, 249
Nagel T., Rauch T., Werner K., 2009, A&A, 499, 773
at University of Warwick on April 9, 2013
http://mnras.oxfordjournals.org/
Nelemans G., 2005, in Hameury J.-M., Lasota J.-P., eds, ASP Conf. Ser. Vol. 330. The Astrophysics of Cataclysmic Variables and Related Ob-jects. Astron. Soc. Pac., San Francisco, p. 27
Nelemans G., Yungelson L. R., van der Sluys M. V., Tout C. A., 2010, MNRAS, 401, 1347
Osaki Y., 1989, PASJ, 41, 1005
Paczy´nski B., 1967, Acta Astron., 17, 287 Patterson J. et al., 2005, PASP, 117, 1204
Podsiadlowski P., Han Z., Rappaport S., 2003, MNRAS, 340, 1214 Rappaport S., Joss P. C., Webbink R. F., 1982, ApJ, 254, 616
Roelofs G. H. A., Groot P. J., Benedict G. F., McArthur B. E., Steeghs D., Morales-Rueda L., Marsh T. R., Nelemans G., 2007, ApJ, 666, 1174 Roelofs G. H. A. et al., 2009, MNRAS, 394, 367
Ruiz M. T., Rojo P. M., Garay G., Maza J., 2001, ApJ, 552, 679 Savonije G. J., de Kool M., van den Heuvel E. P. J., 1986, A&A, 155, 51 Scargle J. D., 1982, ApJ, 263, 835
Schneider D. P., Young P., 1980, ApJ, 238, 946 Schreiber M. R., G¨ansicke B. T., 2003, A&A, 406, 305 Sienkiewicz R., 1984, Acta Astron., 34, 325
Sion E. M., Cheng F. H., Szkody P., Sparks W., G¨ansicke B., Huang M., Mattei J., 1998, ApJ, 496, 449
Slevinsky R. J., Stys D., West S., Sion E. M., Cheng F. H., 1999, PASP, 111, 1292
Solheim J., 2010, PASP, 122, 1133
Steeghs D., 2001, in Boffin H. M. J., Steeghs D., Cuypers J., eds, Lecture Notes in Physics, Vol. 573, Astrotomography, Indirect Imaging Methods in Observational Astronomy, Springer-Verlag, Berlin, p. 45
Steeghs D., 2010, in Proc. High Time Resolution Astrophysics – The Era of Extremely Large Telescopes (HTRA-IV). May 5–7, 2010. Agios Nikolaos, Crete Greece
Thorstensen J. R., Taylor C. J., 2001, MNRAS, 326, 1235
Thorstensen J. R., Fenton W. H., Patterson J. O., Kemp J., Krajci T., Baraffe I., 2002, ApJ, 567, L49
Townsley D. M., Bildsten L., 2003, ApJ, 596, L227 Townsley D. M., G¨ansicke B. T., 2009, ApJ, 693, 1007 Tremblay P.-E., Bergeron P., 2009, ApJ, 696, 1755
Tutukov A. V., Fedorova A. V., Ergma E. V., Yungelson L. R., 1985, Soviet Astron. Lett., 11, 52
Verbunt F., Zwaan C., 1981, A&A, 100, L7
Warner B., 1995, Cataclysmic Variable Stars. Cambridge Univ. Press, Cam-bridge
Whitehurst R., 1988, MNRAS, 232, 35
Williams R. E., Ferguson D. H., 1982, ApJ, 257, 672
Wood M. A., Still M. D., Howell S. B., Cannizzo J. K., Smale A. P., 2011, ApJ, 741, 105
This paper has been typeset from a TEX/LATEX file prepared by the author.
at University of Warwick on April 9, 2013
http://mnras.oxfordjournals.org/