University of Warwick institutional repository:
http://go.warwick.ac.uk/wrap
A Thesis Submitted for the Degree of PhD at the University of Warwick
http://go.warwick.ac.uk/wrap/66809
This thesis is made available online and is protected by original copyright.
Please scroll down to view the document itself.
Exploring Customer Relationship Management using
Simulation Modelling in the Retail Sector
By
Yuen Fung Ting
A thesis submitted in partial fulfilment of the requirements
for the degree of Doctor of Philosophy in Engineering
University of Warwick, WMG
i
Abstract
The goal is to help the retail industry define customer-company relationships, and to manage the relationships in a more effective way in terms of the balance between retail service quality and product quality. This study proposes a two-step modelling approach to the development of an exploratory-based customer relationship management (CRM) simulation model, which consists of a static relationship (exploratory) module and a dynamic simulation module.
To support and test the model development, Hunter Douglas, a world-class leader in the window fashions industry, was used as a case study for data collection. A customer survey and focus group discussions were therefore conducted with staff and customers. Hypothesis testing and other statistical methods including factor analysis, ANOVA, multiple regression, post-hoc analysis, sensitivity analysis, and policy analysis were adopted in this research to develop the exploratory module. System dynamics modelling and simulation were applied to develop the dynamic simulation module.
The major dimensions regarding retail service quality, product quality and customer loyalty were defined in the exploratory module. Five dimensions regarding retail service quality (policy, physical aspects, reliability, problem solving, and personal interaction) and three dimensions regarding product quality (feature, aesthetics, and customer-perceived quality) were considered and their impacts on the two levels of customer loyalty - customer loyalty to the store and customer loyalty to employees - were investigated. These measures consist of forty variables in total. Through the exploratory module, it is found that reliability, physical aspects, and problem solving exert positive impacts on customer loyalty to the store while personal interaction significantly influences customer loyalty to employees. Furthermore, gender differences have significant impacts on customer loyalty to the store, particularly in terms of physical aspects, reliability, problem solving and aesthetics.
Connecting with the exploratory module, the dynamic simulation module further takes account of employee satisfaction, spending on advertising and order completion efficiency. This module can make significant contribution to the field of CRM by providing the retail industry with a full picture of CRM for the scenario analysis and strategic planning. Based on the findings of the dynamic simulation module, appropriate CRM strategies had been adopted and various aspects of Hunter Douglas, including customer satisfaction, employee satisfaction, numbers of repeat customers, sales volume, etc. have significantly improved. These fruitful results achieved by Hunter Douglas, a typical retailer, confirm the high value and the contribution of this research to the retail industry.
Acknowledgements
First, I am extremely grateful to my supervisor, Dr. Jay Bal, for his guidance and all the useful discussions and brainstorming sessions. Jay has been incredibly generous with his time and has provided me with a range of interesting and accessible open problems to work on. His deep insights helped me at various stages of my research. He read my thesis word by word and gave me very useful comments and suggestions on every page.
My sincere gratitude is reserved for Dr. WH Ip for his invaluable insights and suggestions. He has provided me a lot of guidance in the area of modelling and gave me a lot of advices in the overall structure of the thesis.
Very special thanks to Professor Lord Kumar Bhattacharyya for giving me this great opportunity to carry out my doctoral research with the department. His continuous encouragement gave me strength to move on.
I would also like to thank Hunter Douglas Gallery in Hong Kong in supporting me to carry out this research and using their data for analysis.
Declarations
I hereby declare that this thesis is my own work and that, to the best of my
knowledge and belief, it reproduces no material previously published or written, nor material that has been accepted for the award of any other degree or diploma,
except where due acknowledgement has been made in the text.
Table of Contents
ABSTRACT ... I
DECLARATIONS ... III
TABLE OF CONTENTS ... IV
LIST OF FIGURES ...IX
LIST OF TABLES ...XII
1. INTRODUCTION ... 15
1.1. IMPORTANCE OF SERVICE AND PRODUCT QUALITIES... 15
1.2. IMPORTANCE OF CUSTOMER RELATIONSHIP MANAGEMENT ... 16
1.3. CHALLENGES FACED BY THE RETAIL INDUSTRY ... 16
1.4. MOTIVATION FOR THE STUDY ... 17
1.5. STUDY AIM AND OBJECTIVES ... 19
1.6. ORGANISATION OF THIS THESIS ... 20
2. LITERATURE REVIEW ... 22
2.1. CUSTOMER RELATIONSHIP MANAGEMENT ... 22
2.2. ANALYTICAL METHODS OF CUSTOMER RELATIONSHIP MANAGEMENT ... 25
2.3. SYSTEM DYNAMICS ... 27
2.3.1. Introduction to System Dynamics ... 28
2.3.2. Applications of System Dynamics ... 31
2.3.3. System Dynamics as a Strategic Facilitator ... 32
2.3.4. System Dynamics and Customer Relationship Management ... 33
2.4. EFFECTS OF RETAIL SERVICE QUALITY AND PRODUCT QUALITY ON CUSTOMER LOYALTY ... 34
2.4.1. Retail Service Quality ... 34
2.4.2. Product Quality ... 37
2.4.3. Customer Loyalty ... 41
2.4.5. Linkage between Product Quality and Customer Loyalty ... 44
3. METHODOLOGY ... 46
3.1. RESEARCH FRAMEWORK ... 46
3.2. HYPOTHESIS FORMULATION FOR THE EXPLORATORY MODULE ... 47
3.3. CASE STUDY ... 49
3.3.1. Selection of a Typical Retailer ... 50
3.3.2. A Company Profile of Hunter Douglas ... 54
3.3.3. Challenges Faced by Hunter Douglas ... 56
3.4. DATA COLLECTION AND ANALYSIS METHODS ... 57
3.4.1. Survey Research ... 57
3.4.2. Questionnaire Design of Customer Survey ... 57
3.4.3. The Sampling Process of the Customer Survey ... 68
3.4.4. Statistical Methods ... 69
3.4.5. The System Dynamics Approach ... 72
3.5. COMPUTER APPLICATIONS ... 73
3.5.1. SPSS Used for Hypothesis Testing and Empirical ... 73
3.5.2. iThink Used for System Dynamics Modelling and Simulation ... 73
4. DERIVATION OF THE EXPLORATORY MODULE... 77
4.1. THE FRAMEWORK OF THE EXPLORATORY MODULE ... 77
4.2. ANALYSIS AND RESULTS ... 80
4.2.1. Assessments of the Validity and Reliability of the Measurement Instruments ... 80
4.2.1.1. Validity of the Instruments ... 80
4.2.1.2. Reliability of the Instrument ... 88
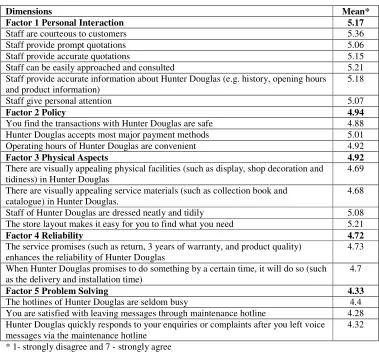
4.2.2. Rank Order of Customer Perceptions on Retail Service Quality, Product Quality, and Customer Loyalty ... 93
4.2.5. Post-hoc Analysis ... 106
5. DEVELOPMENT OF THE DYNAMIC SIMULATION MODULE ... 109
5.1. FRAMEWORK OF THE DYNAMIC SIMULATION MODULE ... 109
5.2. MODELLING OF THE DYNAMIC SIMULATION MODULE ... 110
5.2.1. Parameters and their Interrelationships ... 110
5.2.2. Visualisation of the Dynamic Simulation Module ... 118
5.2.2.1. The High-Level Mapping Layer ... 119
5.2.2.2. The Model Construction Layer ... 120
5.2.3. Data Input of the Dynamic Simulation Module ... 127
6. SIMULATION AND ANALYSIS OF THE DYNAMIC SIMULATION MODULE ... 132
6.1. SIMULATION RESULTS ... 132
6.1.1. The Impact of Employee Satisfaction ... 132
6.1.2. Factors Influencing Customer Satisfaction ... 133
6.1.3. The Impact of Order Completion Efficiency ... 135
6.1.4. Factors Influencing Customer Loyalty... 137
6.1.5. Customer Loyalty and Customer Retention ... 138
6.1.6. Customer Satisfaction and Acquisition ... 139
6.1.7. Purchase Rate and Sales Rate ... 141
6.2. SENSITIVITY AND POLICY ANALYSES ... 142
6.2.1. Sensitivity Analysis... 143
6.2.1.1. Varying Employee Satisfaction from 0 to 100 Level ... 144
6.2.1.2. Varying Satisfaction with Retail Service Quality from 0 to 100 Level ... 148
6.2.1.3. Varying Satisfaction with Product Quality from 0 to 100 Level ... 151
6.2.1.4. Varying Spending on Advertising from 0 to 10 ($,000/month) ... 155
6.2.1.5. Varying Spending on Training from 0 to 10 ($,000/month) ... 158
6.2.2. Policy Analysis ... 162
6.2.2.1. The Reference Model (Order Lead Time=2 Months) ... 163
6.2.2.4. Comparison between Reference Model and Policy Experiments ... 167
7. FINDINGS AND DISCUSSIONS OF THE EXPLORATORY-BASED CRM SIMULATION MODEL 170 7.1. THE EXPLORATORY MODULE ... 170
7.1.1. Importance of Retail Service Quality to Customer Loyalty ... 170
7.1.2. Different Focus on the Needs of the Male and Female Customers... 172
7.2. THE DYNAMIC SIMULATION MODULE ... 174
7.2.1. Resources Allocated for Improving Employee Satisfaction ... 174
7.2.2. The Focus on Improving Satisfaction with Product Quality ... 175
7.2.3. Importance of Satisfaction with Retail Service Quality and Spending on Advertising 176 7.2.4. Importance of Spending on Training ... 177
7.2.5. Workflow Improvement to Shorten the Order Lead Time ... 177
7.3. DIFFICULTIES ENCOUNTERED ... 178
8. ORIGINALITY AND CONTRIBUTIONS ... 180
8.1. A TWO-STEP MODELLING APPROACH TO CUSTOMER RELATIONSHIP MANAGEMENT ... 180
8.2. RESEARCH CONTRIBUTIONS ... 183
8.2.1. Contributions to the Literature ... 183
8.2.2. Contributions to the Retail Industry ... 185
9. CONCLUSIONS ... 187
9.1. OBJECTIVES ACHIEVED AND MAJOR FINDINGS ... 187
10. FUTURE RESEARCH ... 190
APPENDICES ... 191
APPENDIX 1: QUESTIONNAIRE FOR CUSTOMER SURVEY ... 191
APPENDIX 2: AFTER-SALES SERVICE QUESTIONNAIRE CONDUCTED BY HUNTER DOUGLAS IN 2010 ... 196
APPENDIX 3: RESULTS OF AFTER-SALES SERVICE SURVEY CONDUCTED BY HUNTER DOUGLAS IN 2010 ... 197
APPENDIX 5: SIMULATION DATA EXTRACTED FROM THE DYNAMIC SIMULATION MODULE ... 205
APPENDIX 6: SENSITIVITY ANALYSIS DATA EXTRACTED FROM THE DYNAMIC SIMULATION MODULE ... 209
APPENDIX 7: POLICY ANALYSIS DATA EXTRACTED FROM THE DYNAMIC SIMULATION MODULE ... 217
List of Figures
Figure 2.1 Relationships among customer satisfaction, customer loyalty and business performance
(Buttle, 2004)... 24
Figure 2.2 Dimensions of retail service quality ... 36
Figure 2.3 Dimensions of product quality ... 39
Figure 3.1 Research framework ... 47
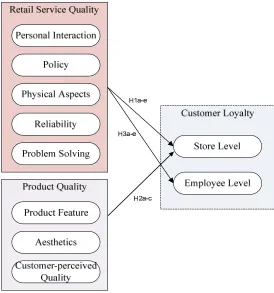
Figure 3.2 Proposed exploratory module ... 49
Figure 3.3 Product classification versus service level required ... 52
Figure 3.4 Symbols of building blocks of iThink ... 74
Figure 4.1 The framework of the exploratory module... 78
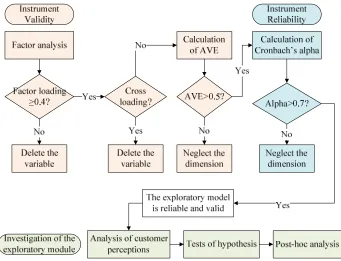
Figure 4.2 An analysis flowchart of the exploratory module ... 79
Figure 4.3 A summary of hypothesis results ... 105
Figure 5.1 The development process of the dynamic simulation module ... 110
Figure 5.2 Key factors affecting customer satisfaction ... 115
Figure 5.3 The relationship between employee satisfaction and customer satisfaction ... 116
Figure 5.4 The relationship among customer satisfaction, customer acquisition, customer retention, sales volume, and customer loyalty ... 118
Figure 5.5 The high-level mapping layer of the dynamic simulation module ... 119
Figure 5.6 The model construction layer of the dynamic simulation module... 121
Figure 5.7 The company sector of the dynamic simulation module ... 122
Figure 5.8 The employee sector of the dynamic simulation module ... 122
Figure 5.9 The customer sector of the dynamic simulation module ... 123
Figure 6.1 A simulation graph showing employee satisfaction, personal interaction, order completion efficiency, and satisfaction with retail service quality ... 133
List of Tables
Table 3.1 Variables of retail service quality... 60
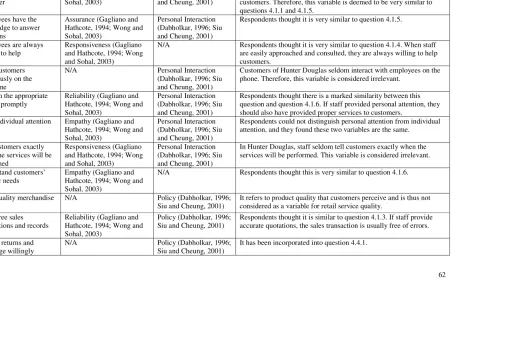
Table 3.2 Reasons for the exclusion of certain variables ... 62
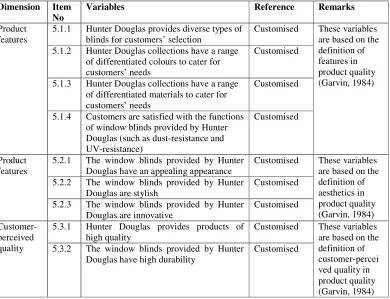
Table 3.3 Variables of product quality ... 64
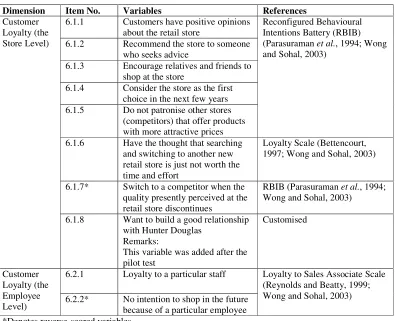
Table 3.4 Variables regarding customer loyalty ... 66
Table 3.5 Variables of customer satisfaction ... 68
Table 3.6 Descriptions of the statistical methods used ... 70
Table 4.1 Significant factor loadings for different sample sizes ... 81
Table 4.2 The factor loading of all variables regarding retail service quality ... 83
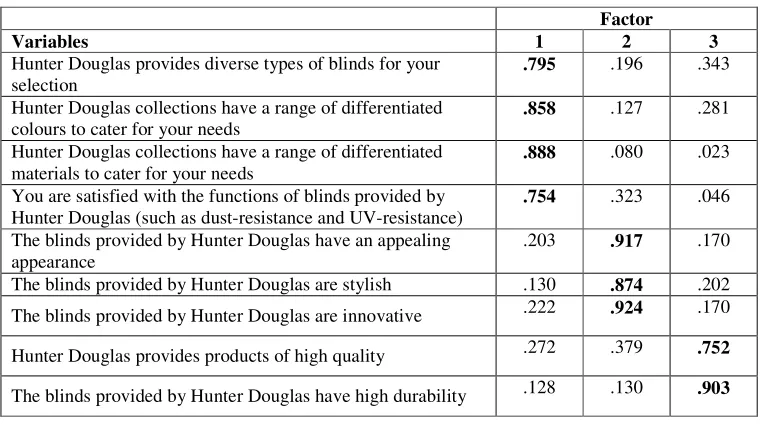
Table 4.3 The factor loading of all variables regarding product quality ... 84
Table 4.4 The factor loading of all variables regarding customer loyalty ... 84
Table 4.5 Resulting variables regarding retail service quality after the factor analysis ... 85
Table 4.6 Resulting variables regarding customer loyalty after factor analysis ... 85
Table 4.7 Results of KMO and Bartlett's test on retail service quality... 86
Table 4.8 An interpretation of the KMO measure (Janssens, 2008) ... 86
Table 4.9 The correlation matrix and resulted AVE regarding retail service quality ... 87
Table 4.10 The correlation matrix and resulted AVE regarding product quality ... 87
Table 4.11 The correlation matrix and resulted AVE regarding customer loyalty ... 87
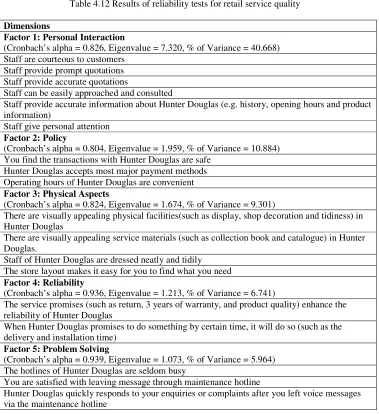
Table 4.12 Results of reliability tests for retail service quality ... 89
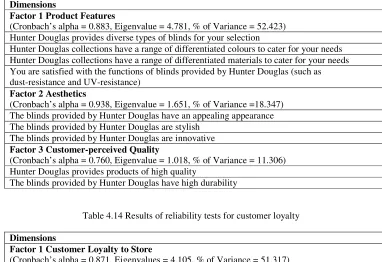
Table 4.13 Results of reliability tests for product quality ... 90
Table 4.14 Results of reliability tests for customer loyalty ... 90
Table 4.15 Mean scores of retail service quality ... 94
Table 4.16 Mean scores of product quality ... 95
Table 4.17 Mean scores of customer loyalty ... 95
Table 4.18 Difference of the results of retail service quality due to gender difference ... 97
Table 4.19 Difference of the results of product quality due to gender difference ... 98
Table 4.20 Difference of the results of customer loyalty due to gender difference... 98
Table 4.22 VIF of the dimensions regarding retail service quality and product quality ... 102
Table 4.23 Results of the regression analysis on customer loyalty to employees ... 104
Table 4.24 Results of the regression analysis on customer loyalty to employees (Excluding the dimensions regarding product quality) ... 104
Table 4.25 VIF of the dimensions regarding retail service quality ... 104
Table 4.26 A summary of the results of hypothesis tests ... 106
Table 4.27 Results of the regression analysis of retail service quality and product quality on customer loyalty to the store: influence caused by gender difference ... 108
Table 5.1 Parameters studied in the literature and the proposed model ... 112
Table 6.1 Values of employee satisfaction and their representative lines ... 144
Table 6.2 Percentage changes in customer satisfaction by varying employee satisfaction ... 147
Table 6.3 Percentage changes in the number of existing customers by varying employee satisfaction ... 148
Table 6.4 Percentage changes in sales volume by varying employee satisfaction ... 148
Table 6.5 Values of satisfaction with retail service quality and their representative lines... 149
Table 6.6 Percentage changes in customer satisfaction by varying satisfaction with service quality ... 151
Table 6.7 Percentage changes in customer number by varying satisfaction with service quality 151 Table 6.8 Percentage changes in sales volume by varying satisfaction with retail service quality ... 151
Table 6.9 Values of satisfaction with product quality and their representative lines ... 152
Table 6.10 Percentage changes in customer satisfaction by varying satisfaction with product quality ... 155
Table 6.11 Percentage changes in existing customer number by satisfaction with product quality ... 155
Table 6.12 Percentage changes in sales volume by varying satisfaction with product quality ... 155
Table 6.13 Values of spending on advertising and their representative lines ... 156
advertising ... 158
Table 6.16 Percentage changes in sales volume by varying spending on advertising ... 158
Table 6.17 Values of spending on training and their representative lines ... 159
Table 6.18 Percentage changes in customer satisfaction by varying spending on training ... 162
Table 6.19 Percentage changes in number of customers by varying spending on training ... 162
Table 6.20 Percentage changes in sales volume by varying spending on training ... 162
Table 6.21 Percentage changes in customer satisfaction by varying order lead time ... 168
Table 6.22 Percentage changes in customer loyalty by varying order lead time ... 168
Table 6.23 Percentage changes in the number of existing customers by varying order lead time168 Table 6.24 Percentage changes in sales volume by varying order lead time ... 168
1.
Introduction
Jay Conrad Levinson, the author of the best-selling book on Guerrilla Marketing,
said: “In order to sell a product or a service, a company must establish a
relationship with the consumer. It must build trust and rapport. It must understand
the customer's needs, and it must provide a product that delivers the promised
benefits” (Levinson and Godin, 1994, p.4).
To achieve this rapport with the customer the management of retail services is therefore of paramount importance and has become a strategic focus of retailers.
As supported by many scholars (Bell and Zemke, 1992; Heskett et al., 1994;
Zeithaml et al., 1996), companies with superior service quality are likely to be
more profitable, owing to better customer satisfaction and stronger loyalty. In this
regard, service management can help companies gain competitive advantages. In
this cut-throat and dynamic market, companies need to build long-term customer
relationship and maximise profitability through enhancing both service and
product quality.
1.1.
Importance of Service and Product Qualities
The quality of products and services is the direct factor influencing customers’
satisfaction and their loyalty to a company (Cronin, 2000; Noyan and Simsek,
2014). Products are a major starting point for satisfying customer’s needs
(Torres-Moraga et al., 2008). Better product quality will maintain a higher
satisfaction level for customers and encourage customers to spend more and/or
purchase again. Service quality is another factor to delight customers and build
1.2.
Importance of Customer Relationship Management
Ghosh et al. (2010) indicated that retailers who are able to generate customer loyalty will succeed during a period of economic recession. According to scholars
(Fuentes-Blasco et al., 2014; Keaveney, 1995; O’Brien and Jones, 1995), customer loyalty will enhance the likelihood of customers returning, providing
business referrals, as well as generating positive word-of-mouth publicity.
Ndubisi (2004), Terpsta and Verbeeten (2014) further stated that the cost of
serving one loyal customer is significantly less than that of attracting and serving
one new customer. Customer relationship management (CRM), which plays an
important role in maintaining long-term relationships, can therefore be essential
for business survival and growth. To compete with others, CRM can serve as a
powerful tool to help companies better understand their customers’ needs and
enable them to do so in a manner superior to that of their competitors (Chu, 2007;
Khodakarami and Chan, 2014).
1.3.
Challenges Faced by the Retail Industry
Customers are increasingly more concerned with value of service and product
qualities, which in turn influence customer satisfaction and the relationship to a company. Companies in the retail industry often face the challenge of offering
customers high-quality services and products as well as shorter delivery time
while remaining cost-effective. Deciding where to invest in improving customer
satisfaction and retention is thus a major issue. Should the retailer invest in higher
quality products, or more or better trained sales people? There is no lack of
CRM’s applications, such as those for solving problems of adverse selection (Cao
due to the lack of research in the relationship among service quality, product
quality and customer loyalty, companies face challenges in formulating
competitive CRM strategies. Hence, further research is required to better
understand the effects of service quality and product quality on customer loyalty;
a comprehensive tool balancing customer purchasing behaviour, customer
satisfaction, and customer loyalty would also be desirable for better resource
allocation and strategic planning.
1.4.
Motivation for the Study
Service quality has long been an important research topic due to its apparent
relationship to customer satisfaction and higher customer retention (Bennett and
Higgins, 1988, Bolton and Drew, 1991; Chopra, 2014), repeating purchasing
behaviour (Taylor and Cronin, 1994; Das, 2014) and expanded market share
(Bowen and Hedges, 1993). Product quality is another crucial element contributing to customer satisfaction and leading to customer loyalty. To gain
competitive advantages and formulate better CRM, the impacts of service quality
and product quality on customer loyalty should be investigated. However, the
linkage between service and product qualities as well as customer loyalty appears
to have received little attention in the service management and marketing
literature. Most previous studies in this domain place emphasis on “intentions to
make purchase again”, “customers’ willingness to recommend the company to
others”, “satisfaction with the brand”, “trust building”, and so on (Cronin and
Taylor, 1992; Boulding et al., 1993). Although Dabholkar (1996) researched the
significance of service quality, his study largely focuses on measuring service
policy, physical aspects, reliability, and problem solving. The studies concerning
service quality (Boulding et al., 1993; Dabholkar, 1996) are not recent and thus
probably not applicable to today’s market, which is dynamic and rapidly changing.
Due to the fact that there are a limited number of studies exploring the impacts of
service quality and product quality on customer loyalty, this area needs further
study and analysis. This requirement is further enhanced because increasingly
social media has taken the full control of a company’s service reputation outside
its own control. These new social media channels mean that any lapses on service
or product quality are quickly communicated to existing and potential customers.
CRM plays an important role in supporting business growth particularly in this
competitive and dynamic market. However, it is often a complex and challenging
task for companies to apply it, particularly those in the retail industry. A Hong
Kong based retailer “Hunter Douglas” will serve as a case study in this research.
It utilises a marketing strategy named “4Ps”, standing for product, price,
promotion, and place. “4Ps” is a common and popular marketing strategy in the
retail industry. However this approach only helps envisage strategies from the
perspective of products (Kwok, 2007), thus it cannot fully capture the essence of
CRM – the interactions between customers and the company. Secondly, customer
satisfaction is a key measure of the customers’ response to products and services
(Barnes, 2001). Relationships with customers can only be built when customers
are satisfied with the products and services of a company, hence repeating purchases. To retain customers and maximise customer loyalty for long-term
customer relationships, it is crucial to assess customer satisfaction constantly and
purchasing behaviour. Retailers often conduct surveys to analyse customer
relationships in the hope of determining factors that drive customers to be
satisfied and make purchases. However, they find that the survey results are often
insufficient to support decision making and policy settings. Despite the fact that
surveys are relatively easy to conduct and can yield rich information, the survey
methods are limited by people’s insight into their own behaviour and by their
willingness and ability to reveal what they know (Sternthal et al., 1994). In this
regard, retailers are unable to identify and gather useful information to construct a
full picture which describes the interactions among various major factors affecting customer relationships. Consequently, they fail to understand customers’
behaviour and to manage customer satisfaction and this hinders retailers from
formulating appropriate CRM strategies.
As suggested by Cowart and Goldsmith (2007), different measurement scales
should be adopted in future research to determine if causal relationships exist. A
model which illustrates the full picture of customer relationships with retailers and
provides support for strategic planning would be helpful to tackle these matters
(Swift, 2002). This effort can contribute towards better CRM.
1.5.
Study Aim and Objectives
This study aims to develop an exploratory-based CRM simulation model (ECSM),
with a focus on product and service qualities as well as customer satisfaction and
loyalty, ultimately providing a CRM solution to the retail industry. The objectives
of this study are as follows:-
(a) major measures of retail service quality and product quality are identified,
(b) the impacts of retail service quality and product quality on customer
loyalty are examined, and
(c) the various measures of retail service quality and product quality with
regard to gender difference are explored.
2. To develop a dynamic simulation module that significantly influence customer
relationships and provide the case study industry with a model of CRM for
scenario analysis and strategic planning.
3. Analysing and understanding the relationships can help companies get insights into new possibilities and opportunities to achieve desired goals (Hakansson
and Snehota, 1995; Esbjerg et al., 2012). The ECSM developed would be a
practical tool to help manage customer relationships with internal and external
factors.
1.6.
Organisation of this Thesis
This thesis starts with an explanation of the fundamentals for the development of
this research. Thereafter, the recent development of CRM and the related tools are
introduced and discussed in Chapter 2. The impacts of service and product
qualities on customer loyalty are also explored, this then provide insights into the
subsequent formulation of hypotheses. In addition, this chapter presents a review
of literature to justify the approaches adopted in the proposed methodology.
Chapter 3 provides the study framework and highlights promising research
paradigms in the field of CRM. The research methodology, procedures and tools
for data collection and analysis are described in this chapter and provide supports
The development of the ECSM consisting of the exploratory module and the
dynamic simulation module is explained in Chapters 4 and 5 respectively. Chapter
4 describes the framework of the exploratory module and the procedure to test the
hypotheses defined in Chapter 3. The empirical results are discussed. Chapter 4
also verifies the exploratory module with statistical methods and provides findings
on the impacts of product and service qualities on customer loyalty as well as
customer loyalty with regard to gender difference. These findings could give
companies insights into their strategic focus and marketing strategies. To enhance
decision makers’ understanding on CRM, the dynamic simulation module is then developed and discussed in Chapter 5 to visualise the interrelationships among
customer satisfaction, customer purchasing behaviour and customer loyalty.
Chapter 6 further explains the simulation of the dynamic simulation module and
the results. The evidence from the module can help companies allocate
appropriate resources to improve the retention of customers. The importance of
the key factors and the focal points of the two modules are highlighted in Chapter
7. The findings would help companies get insights into the formulation of better
business strategies for the sake of enhancing CRM.
The originality and the contributions from this research are discussed in Chapter 8.
The two-step modelling approach for CRM proposed in this research is original.
Apart from this, the research also makes contributions to the literature as well as
2.
Literature Review
A literature review was conducted to provide theoretical basis for the
development of the model proposed. The proposed CRM model focuses on retail
service quality, product quality and customer loyalty for the reasons highlighted in
Chapter 1. Studies of these aspects are therefore examined so as to provide
grounds for the subsequent model development. Furthermore, literature on
analytical methods for CRM and system dynamics was investigated to derive the
approach to the proposed model development.
2.1.
Customer Relationship Management
In order to better satisfy customer needs, it was proposed that the role of
marketing should be changed from putting the manufacturers’ focus on products
to putting it on the customers (Kimery and Rinehart, 1998). It is important for
modern enterprises to manage relationships with customers carefully (Madill et al.,
2007), thus researchers have analysed the essence as well as the benefits of CRM
(Zeng et al., 2003; Chalmeta, 2006; Khodakarami and Chan, 2014). Bryan (2002)
pointed out that adopting CRM is imperative to help maintain relationships with
suppliers and customers. Buttle (2004) suggested that CRM is the core business strategy that integrates internal processes and functions with external networks to
generate value that benefits customers; CRM is also an important way for
companies to stay competitive in the market. This is grounded on high-quality
customer data with the help of information technology. According to Payne and
Frow (2005), CRM is the strategic process of identifying desirable customer
segments, micro-segment or individual customers on a one-to-one basis, and of
well as the lifetime value of customers to the company through targeted customer
acquisition, profit enhancing relationship activities, and customer retention. CRM
is an effective approach to improve new product development and company
performance (Ernst et al., 2011).
Customer satisfaction and loyalty are not only the key drivers of profit growth but
also the necessary elements for CRM. Measuring customer satisfaction from
buying and using a product or service is the first step to decide whether the quality
of a product or service needs to be enhanced to improve customer relationships. Taylor (1995), Harness and Harness (2004) also identified customer satisfaction
as the key element in company competitiveness. Through striving for greater
customer satisfaction, companies will continuously improve the rate of customers
making repetitive purchases. This is because customers who have a repetitive
pattern of purchase behaviours are those having a satisfying experience, and thus
are loyal customers (Sherry, 2003). Loyal customers would offer favourable
word-of-mouth referrals to their friends and family, and thus help the company
generate more transactions and hopefully profits. Customer loyalty without doubt,
is beneficial to a business. Customer satisfaction and loyalty are interrelated and
indispensable when formulating strategies for better CRM as they contribute to
the long-term profits of companies.
Buttle (2004) indicated that it is profitable for companies to adopt CRM, as it links and coordinates business performance and customer satisfaction, as
illustrated in Figure 2.1. Through understanding customers’ needs and creating
satisfaction, thereby increasing customers’ intention to make purchases again
(Anderson, 1994; Taylor, 1995). This in turn enhances customer loyalty and
results in a significant impact on the financial performance of the business.
Companies are motivated to adopt CRM for both offensive and defensive reasons.
Offensive motivations are associated with a desire to improve profitability by
reducing costs and increasing revenues through improving customer satisfaction
and loyalty. Defensive motivations arise when leading competitors adopt CRM
successfully and a company fears losing customers and revenues (Buttle, 2004). It
is clear that the increasing emphasis on CRM leads to concern over determining the relationships among parties. It is evident that taking customer satisfaction,
customer loyalty, and business performance into consideration is necessary when
designing a CRM model and this study is not an exception.
Figure 2.1 Relationships among customer satisfaction, customer loyalty and business performance (Buttle, 2004)
A CRM system includes tools, technologies and procedures that help manage
customer relationships, facilitate sales, as well as improve interactions with
customers, business partners, and even throughout the enterprise (Davenport et al.,
2001). The main goal of a CRM system is to help sales and marketing personnel
The extensive use of CRM can have a substantial influence on gaining loyal and
satisfied customers as the business processes are improved, acquisition costs
reduced, and the brand is better acknowledged, all of which would translate into
financial performance (Gefen and Ridings, 2002). Bryan (2002) described CRM
system as a strategic tool for improving customer satisfaction and therefore
customer loyalty would be enhanced in the long term. A CRM system is always
useful for companies to measure the resource utilisation for customer satisfaction
to be built, so that the effectiveness of the customer relationship strategy can be
determined.
2.2.
Analytical
Methods
of
Customer
Relationship
Management
Customers today are better educated and confident, and would always have higher
expectations of services and demand a wider range of choices. Companies may
face challenges to analyse massive amount of customer and marketing data in an
effective manner for managing customer relationships in this dynamic market.
CRM is a significant tool for modern enterprises to stay competitive in the
dynamic market. The current trends with social media, open data and big data has vastly increased the data assets available to marketers, thus analytical methods of
CRM will therefore become necessary and are a popular research topic.
Researchers use different analytical tools to analyse CRM data and help foster
strong relationships between customers and companies. Sheng and Liu (2005)
analysed the research data collected from hair salons in Taiwan using hypothesis
assessing the influential level and causal relationships among variables. The
findings of such study highlight the importance of service quality, which has
strong and positive impact on customer satisfaction. In addition, Chow (2004)
proposed a relationship quality model which provides recommendations to
financial service practitioners on managing CRM via information sharing. The
aim was to enhance the relationship quality, which eventually increases
anticipation of future interaction and willingness to refer the products or services
to others. A two-step analytical method of confirmatory factor analysis and
structural model evaluation were employed in testing hypotheses and analysing the results. The model enables financial service companies to decide which CRM
strategies are most beneficial to both customers and companies. Chu (2007)
adopted a data mining software tool, Clemention, to analyse the customer service
data so as to find the pattern, on which the decision made can be grounded. The
analysis results direct the company to provide value-added services. However, the
analysis model omitted key information such as product attributes and customer
behaviours, and also disregarded the linkages between information. The results
appear to be less than comprehensive and fail to support the formulation of
effective CRM strategies.
Buttle (2004) used a balanced scorecard which covers four sets of interrelated key
performance indicators, namely “financial”, “customer”, “internal”, and “learning
and growth” for studying CRM strategies. The connection between these indicators is that employees/staff (learning and growth) do things (internal) for
customers (customer) that have effects on business performance (financial). This
interdependent relationship. This also suggests that satisfied employees perform
internal processes well to create value for customers who in turn become loyal
and to profitable processes for the company.
Through reviewing the literature, it can be summarised that the existing analytical
methods commonly used for CRM are the balanced scorecard, data mining, as
well as statistical and empirical analyses. They can reveal patterns and
relationships but do not provide the value and significance of these patterns and
relationships. They are used for historical data analysis rather than prediction. The value and significance of these patterns and relationships are important to provide
companies with decision support and strategic planning options in the hope of
achieving greater customer satisfaction. In the dynamic and fast-changing
environment, it is necessary to employ a system that is highly flexible and
user-friendly so that companies can analyse and monitor the situations based on
different scenarios or on a case-by-case basis. This could make the analysis more
authentic, pragmatic and practical for the business world. In this regard, this study
further explores this area and proposes to develop the ECSM.
2.3.
System Dynamics
Though CRM is significant, it involves various elements that are hard to manage,
such as customer behaviours and the market environment, which are dynamic and
complex. System dynamics is a useful approach for analysing and managing
complex and dynamic problems. It has been widely applied in different disciplines
for strategic management and decision support. Thanks to its characteristics,
tool to support CRM.
2.3.1. Introduction to System Dynamics
System dynamics is a method for studying and managing complex feedback
systems. Systems dynamics was founded in the early 1960s by Forrester at the Massachusetts Institute of Technology (Forrester, 1961). Forrester (1961) stated
that system dynamics is used to investigate the information-feedback characteristics in complex systems, as well as to look into the models that design
an organisational form and policy. With the application of system dynamics,
companies can better understand the structure and dynamics of complex systems
(Sterman, 2000; Chen et al., 2014). Coyle (1996) defined system dynamics as a
method of analysing problems, with time being an important factor.
Wolstenholme (1990) also considered system dynamics a rigorous method for
qualitative description, exploration, and analysis of complex systems in terms of
their processes, information, organisational boundaries, and strategies. It
facilitates quantitative simulation modelling and analysis for the system structure
to be designed and the system behaviours to be analysed.
System dynamics is built on the information-feedback theory, which provides
symbols for mapping business systems in terms of diagrams and equations, and a
programming language for making computer simulations (Pugh, 1998). Chen et al.
(2008) remarked that system dynamics is capable of addressing every sort of
feedback system practically. While the word “system” is applied to all sorts of
situations, “feedback” refers to the differentiating descriptor. Sterman (2000)
feedback processes, along with stock and flow structures, time delays, and
nonlinearities, as well as in determining the dynamics of the system through
simulation. More importantly, the feedback loops of system dynamics make it
distinctive and outperform other approaches to studying complex systems
(Sterman, 2000).
System dynamics is a useful approach to modelling and simulations. It is valuable
for gaining insights into complex systems and thus making the right decisions
(Lin et al., 1998). Through visualising and simulating complex situations, companies can test their business plans, strategies, and policies so that the
decision making process can be facilitated. As mentioned by Lai et al,. (2003),
companies can make use of a system dynamics model to test alternative policies
and to redesign the system in order that business plans can be improved and more
effective policies can be made. John (2007) also pointed out that the idea of
rehearsing future plans is fundamental to contemporary strategy formulation and
scenario development. Modelling and simulations of system dynamics are
beneficial for companies and individuals to forecast and anticipate future plans
before bringing them to life. System dynamics therefore becomes a strategy issue
as a top concern for the management (Helms, 1990).
System dynamics, with its modelling and simulation, can show the structure of the
system, the interconnection among its components, and changes in any area that would affect the whole system and its constituent parts over time. Hence, system
dynamics models can be used to measure and predict the behaviour of systems, as
These modelling and simulation characteristics make system dynamics distinctive.
With system dynamics theory as a basis, causal loop diagrams and stock-and-flow
diagrams are the tools used to model the system (Sterman, 2000). Causal loop
diagrams describe a set of variables, linked by arrows, through which the causal
influences between the variables can be shown. They are used to capture the
hypothesis about the causes of dynamics and to show the feedbacks that are
believed to be responsible for a specific problem (Fulvio, 2006). However, causal
loop diagrams do not allow the stock-and-flow structure of a system to be
described. With reference to Frida et al. (2004), stock-and-flow diagrams help describe how a system is connected by feedback loops, which create nonlinearity
a frequently found problem. Stocks represent the state of the system and generate
the information upon which decisions and actions are based. They give systems
inertia and create delays by accumulating the difference between the inflow and
outflow to a process (Fulvio, 2006). These accumulations can be tangible stocks,
such as cash and equipment, as well as intangible ones, such as employee skills,
customer loyalty, and knowledge. Besides, computer applications are often useful
for developing and simulating system dynamics models. iThink is a helpful
computer application for modelling, simulating, and redesigning business, and it
provides a multi-level, hierarchical environment for models to be constructed and
interacted (Towill, 1993). Running “what if” simulations to test certain policies on
such a model can greatly aid in understanding how a system changes over time.
2.3.2. Applications of System Dynamics
System dynamics has been developing for over 40 years (Robert, 1996). Recent
advances in interactive modelling tools, particularly simulation applications and
those for the representation of feedback structure, make it possible for everyone to
engage in the modelling process (Sterman, 2000). Since system dynamics is a powerful method to gain useful insights into situations of dynamics complexity
and policy resistance, it is increasingly used to support the design and analysis of policies in companies (Sterman, 2000). This suggests that system dynamics could
be an appropriate and useful tool to support the formulation of CRM strategies.
With reference to the existing literature, there is a wide range of applications of
system dynamics to other disciplines, such as strategic planning (Lam et al., 2010),
business process reengineering and system redesign (Berry et al., 1994;
Georgantzas, 1996; Ashyeri and Keij, 1998), policy design and analysis (Lai et al.,
2003), knowledge management (Frida et al., 2004), business decision making
(Chan et al., 2010), and supply chain management (Lai et al., 2003). For instance,
Berry et al. (1994) implemented system dynamics in a manufacturing system to
study the system behaviours, particularly the causal-effect relationships, for the sake of improving the design, robustness and operating effectiveness of the
system. Lai et al. (2003) applied system dynamics, using minimal inventories, to a
company’s supply system in order to facilitate just-in-time logistics. This
provided a new paradigm to analyse logistics policies and to understand the
interactions among customers, competitors, and suppliers. As a consequence, a
company’s performance can be shaped over time and an improvement in terms of
of many studies on the application of system dynamics in strategy and policy
planning, there is limited study material on adopting system dynamics for CRM.
2.3.3. System Dynamics as a Strategic Facilitator
Most of the problem-structuring methods yield qualitative models that only show causal relationships but omit the parameters, functional forms, external inputs and
initial conditions to test the models. Regardless of the forms of the models and techniques employed, the results of these models are never more than a set of
causal attributions, and initial hypotheses must then be tested (Starman, 2000).
Due to the complexities of these conceptual models, it is also difficult for one to
fully understand their implications. To address these problems, system dynamics
is suggested to test different models. Without system dynamics, even the best
conceptual model can only rely upon the feedback from the real world for it to be
tested and improved. This feedback process is very slow and often rendered
ineffective by dynamic complexity, time delays, inadequate and ambiguous
feedback, poor reasoning skills, defensive reactions, and the costs of
experimentation. Under these circumstances, system dynamics become a reliable
way to test hypotheses and evaluate the possible effects of policies. Scholars have done much research to further provide evidences to support that system dynamics
is useful for supporting decision making (Forrester, 1961; Forrester, 1992; Robert,
1996; Sterman, 2000; Mohammed and Arunee, 2001; Lai, 2002), facilitate
effective strategy and policy design (Morecroft, 1992; Sterman, 2000; Zhang et al.,
2007), and managing business growth (Forrester, 1968; Senge, 1990). This
implies that customer relationships could probably be managed with the support
2.3.4. System Dynamics and Customer Relationship Management
CRM often involves complex systems that are difficult to understand. Such
systems are very sensitive to some changes and insensitive to others, which makes
it challenging to predict the behaviour of the system. Bryan (2002) defined CRM
as a dynamic process of managing a customer-company relationship so that customers continue to attach to the company for mutual benefits and are dissuaded
from participating in activities unprofitable to the company. The process of CRM is dynamic and therefore the working assumptions and appropriate actions may
need to be changed in response to fluctuations in environment or in
customer-company relationships. System dynamics is thus suitable and useful for
CRM. Chen et al. (2008) used system dynamics to develop a CRM model based
on the theory of customer chain relationship, which highlights how to manage and
build a good relationship with customers for the CRM of the company.
To strive for survival in the market, companies should be able to manage
customers and build customer loyalty. Every interaction between customers and
companies is as much an opportunity for companies to build customer loyalty as a
risk to lose customers and business to competitors. If companies can take a more active role in listening and responding to customers’ feedback, they are more
likely to satisfy customers and build customer loyalty. The application of system
dynamics in CRM is thus recommended as it is suitable and handy for helping
companies capture, analyse and manage customers’ responses, through which
strategies and policies can be formulated to build customer loyalty. It can not only
identify causal relationships and feedback mechanisms, but also forecast and
support and strategic planning in the hope of achieving better customer
satisfaction and CRM.
2.4.
Effects of Retail Service Quality and Product Quality on
Customer Loyalty
To improve CRM, it is necessary to understand the effects of retail service quality
and product quality on customer loyalty. Retail service quality and product quality are two important and primary elements to satisfy customers and ultimately build
customer loyalty. This section will involve a discussion of the three elements,
namely retail service quality, product quality and customer loyalty, followed by a
discussion of their relationships.
2.4.1. Retail Service Quality
Retail service quality is a key driver of customer loyalty (Clottey et al., 2008). Retailers often classify their retail services into two categories. One is “store
service”, which means in-store credit, returns and exchanges adjustments, variety,
quality and dependability of service, and price of after-sale service. Another one is
“sales service”, which means the extent to which prompt and individual service
attention can be achieved (Gagliano and Hathcote, 1994). Parasuraman et al.
(1988) defined service quality as “the degree of discrepancy between customers'
normative expectations for the service and their perceptions of the service
performance”. In order to measure this discrepancy, they devised SERVQUAL
which divides service items into five dimensions, including tangibles, reliability,
responsiveness, empathy, and assurance. Khatibi et al. (2002) stated that
service quality, but this is not supported by all researchers. Cronin and Taylor
(1992) introduced SERVPERF, a measure that concerns only perception,
indicating that it outperforms SERVQUAL and is more applicable for measuring
service quality. In addition, when people are asked to indicate their “desired level”
(expectations) and “existing level” (perceptions) of the service, there is a
psychological constraint that people always tend to rate the former higher than the
latter (Wall and Payne, 1973). It is found that service quality measured in
SERVQUAL relies more heavily on the perception score than on the expectation
score (Babakus and Boller, 1992), rendering it unreliable. Respondents sometimes even appear to be bored and confused by the administration of the expectation and
perception for SERVQUAL (Bouman and van-der-Wiele, 1992), which might
affect the quality of the data adversely. The ability for SERVQUAL to be
generalised across various service settings is also doubted (Rao and Kelkar, 1997),
as it has not been tested empirically in the retail store environment (Dabholkar et
al., 1996).
In order to capture the dimensions that are important to retail customers,
Dabholkar et al. (1996) combined findings from three qualitative studies on retail
service quality as well as those from SERVQUAL to develop a scale named
Retail Service Quality Scale (RSQS). There are five dimensions in the RSQS and
they are shown in Figure 2.2 and presented as follows:-
(i) Personal interaction: Employees are courteous, helpful, able to inspire confidence and trust from the customers;
(ii) Policy: Operating hours, payment options, store charge cards, parking, and so
(iii) Physical aspects: Store appearance and convenience of the store layout;
(iv) Reliability: Retailer keeps its promises and “does things right”; and
(v) Problem solving: Employees are trained to handle potential problems, such
as customer complaints, returns, and exchanges.
Figure 2.2 Dimensions of retail service quality
According to Dabholkar et al. (1996), the dimension of physical aspects has a
broader meaning than the tangible dimension of SERVQUAL does. This
dimension includes not only the appearance of the physical facilities but also the
convenience of the store layout and public areas (e.g. fitting rooms). The
dimension of reliability is similar to SERVQUAL’s reliability dimension and
involves the store’s ability to keep promises and do things right. The dimension regarding personal interaction is a combination of the SERVQUAL’s dimensions
of responsiveness and assurance. It measures customers’ perceptions of whether
the store is operated by courteous and helpful employees who inspire confidence
and trust. Problem solving is newly proposed by Dabholkar et al. (1996) as a new
dimension is viewed as separate from the personal interaction dimension because
“service recovery is being recognised as a critical part of good service”
(Dabholkar et al., 1996). Joe (2012) also supported that problem solving is one of
the key factors to measure retail service quality. The last dimension, policy, is also
a new dimension introduced by the researchers and represents “aspects of service
quality that are directly influenced by store policy” (Dabholkar et al., 1996).
The RSQS is a generalised scale suitable for studying retail businesses which
offer a mix of services and goods. Siu and Cheung (2001) have adopted this scale to measure the service quality of a well-known multi-national retail store in Hong
Kong. Wong and Sohal (2003) used this scale to measure the service quality of a
large chain retail store in Australia. With reference to the use of the scale in retail
service quality validated by scholars, this scale was considered to be suitable and
was adopted in this study.
2.4.2. Product Quality
Product development is often a good starting point for satisfying customers and
building customer loyalty. The advantages of getting an early start to develop products include market pioneering, first mover advantages, low-cost proactive
innovation, and industry redefinition. The disadvantages of ignoring product
development at an initial stage include loss of market opportunities, loss of market
leadership, high cost reactive innovation, and high-cost brand development
(Eduardo et al., 2008). According to Matsa (2011), it is a strong incentive for
Product quality is often the key to delight customers and drive business success. It
is also one of the key drivers of customer loyalty in retail store environment
(Clottey et al., 2008). In order to measure product quality, Garvin (1984)
proposed a definition of product quality with the following eight dimensions (see
Figure 2.3):-
(i) Performance: A product’s primary operating characteristics;
(ii) Features: The additional features or the “bells and whistles” of the product;
(iii) Conformance: The extent to which a product’s design and operating
characteristics meet established standards;
(iv) Reliability: The probability that a product will operate properly over a
specified period of time under stated conditions of use;
(v) Durability: The amount of use the customer gets from a product before it
physically deteriorates or until replacement is preferable;
(vi) Serviceability: The speed, competence, and courtesy of repair;
(vii)Aesthetics: How a product appeals to our five senses; and
(viii)Customer-perceived quality: Customer’s perception of a product’s quality
Figure 2.3 Dimensions of product quality
Each of the eight dimensions (in Figure 2.2) is self-contained and distinct. A
product can be ranked high on one dimension but low on another (Garvin, 1984).
Even though Garvin’s eight-dimension framework was initially proposed in 1984,
its relevance to the definition of product quality is still apparent, given its
continued application in the research in this area (Rose and Nabil, 2002). In 1995,
Madu et al. (1995) used “price”, “product features”, and product reliability” as some of the key indicators under the construct of “customer satisfaction”. In 1996,
Ahire et al. (1996) conducted a study to examine the effects of integrated quality
management strategies on a company’s product quality; the study examines the
dimensions (performance, reliability, conformance, and durability) suggested by
Garvin. Causal relationships between multifarious constructs of quality (i.e.
organisation performance are also examined. It was found that in reality quality
mangers also cited, among other responses, Garvin’s dimensions such as
“reliability”, “aesthetics” and “performance” when answering the open-ended
question “how is quality defined in your primary place of employment”
(Sebastianelli and Tamimi, 2002).
Dimensions which are important to CRM and more relevant to this research are
chosen to be included in this study. Those having less measurable effect and being
less relevant are excluded (Eduardo et al., 2008). For example, the dimension of performance and features are combined in many cases, as the line separating
primary product characteristics (i.e. performance) from secondary characteristics
(i.e. features) is difficult to draw (Garvin, 1984). Besides, the ranking of
conformance and reliability is based on performance or features that are less likely
to reflect individual preferences. Moreover, given that data on conformance are
often difficult to obtain and proxies are frequently used, these two dimensions are
not used in this study. Durability is a measure of product life requiring
measureable product attributes but may not be able to reflect individual preference,
so it is also not included in the study. Serviceability refers to the speed,
competence, and courtesy of repair, which are all represented in the problem
solving aspect of service quality and thus, it need not be measured under the
construct of product quality. As a result, the following three dimensions are
defined and used to describe the construct of product quality in this study:- (i) Product features;
(ii) Aesthetics; and
2.4.3. Customer Loyalty
There are several definitions of customer loyalty in the literature available. It
refers to a favourable attitude towards a brand in addition to purchasing it
repeatedly (Day, 1969), “the relationship between the relative attitude toward an
entity and patronage behaviour” (Dick and Basu, 1994), and it “occurs when repeat purchase behaviour is accompanied by a psychological bond” (Javis and
Wilcox, 1977). With reference to these definitions, customer loyalty is generally used to describe an occurrence when customers repeatedly purchase a product or
service over time and hold favourable attitudes towards the product or service, or
towards the company supplying the product or service.
Customer loyalty refers to both attitudinal and behavioural measures towards the
product, service or company. It concerns the likelihood of repurchase,
introduction and recommendation of companies to others, establishment of public
praise (Bowen and Shoemaker, 1998), price tolerance, and reduction in
opportunity to switch to competitors. Customer loyalty is also the best predictor of
behavioural intentions (Zeithaml et. al., 1996). Customers are loyal to a store and
will continue to make purchases from it in the future. Taking account of the benefits that customer loyalty can bring, retailers are encouraged to pursue,
develop, and maintain a loyal customer base. For example, loyal customers
allocate relatively more of their budget to their “first choice” store than other
customers do (Knox and Denison, 2000) and they are likely to make more
purchases compared to the less loyal customers (Baldinger and Rubinson, 1996).
To ensure survival in the long term, companies need to pay more attention on
single most important driver of companies’ financial performance (Reichheld,
2003).
There are two forms of loyalty, namely person-to-person loyalty (employee level)
and person-to-company loyalty (store level). These two forms of loyalty differ
from each other. Person-to-company relationship is typically short-term and less
intense in comparison to person-to-person relationship, which tends to be
symmetric and pleasant (Lacobucci and Ostrom, 1993). It is also argued that
person-to-person loyalty is more substantial than other forms of loyalty, such as brand loyalty (Oliver, 1997). Even so, they are interrelated. Beatty et al. (1996)
pointed out that customers’ primary loyalty is to a salesperson, who positively
influences customers’ loyalty to the store. Macintosh and Lockshin (1997)
confirmed that loyalty to salesperson is an antecedent to the loyalty to the store.
Therefore, customer loyalty is measured in two levels in this study, i.e. the
employee level and store level, by different loyalty scales.
Researchers indicated that there are important conceptual differences between
store and employee levels (Wong and Sohal, 2003). It is found that positive
feelings towards the employee whom they contact are often carried over to
feelings towards the company (Goff et al., 1997). A positive feeling towards the
salesperson who gives kindly and right advice in the course of the purchase can
help build up trust and confidence, thus leading to a positive image to the store as well (Wong and Sohal, 2003). Regarding the positive relationship between
employee loyalty and store loyalty, the former is demonstrated to be an antecedent
to the salesperson and this salesperson is highly loyal to the company, the
customer’s positive feelings about the salesperson will translate into positive
feelings about the company (Reynolds and Beatty, 1999). This is because
customers’ loyalty to the company will be manifested through their loyalty to the
employee whom they contact (Wong and Sohal, 2003). As there is an
interrelationship between these two forms of loyalty, establishing good relation
between salespersons and customers is an approach recommended to bring
positive image and loyalty to the company (Wong and Sohal, 2003).
2.4.4. Linkage between Retail Service Quality and Customer Loyalty
In general, good service quality leads to customer loyalty as it would enhance
customers’ trust and satisfaction towards the company. Customers would be more
willing to act beneficially to the strategic health of a company, a process during
which customer loyalty will be gradually established. Boulding et al. (1993)
found that favourable perceptions of service quality increase the likelihood of
customers engaging in behaviours that are advantageous to companies.
Furthermore, de-Ruyter et al. (1998) indicated that there is a positive relationship
between perceived service quality and loyalty in five different service industries. This is further exemplified by a study conducted in the hospital industry (Wong et
al., 1999) where the relationship between the dimensions of service quality and
customer loyalty is positive.
While loyalty is often included as an outcome variable in service quality models
(Cronin and Taylor, 1992; Boulding et al., 1993), there is a number of factors that