warwick.ac.uk/lib-publications
Original citation:Rashid, Muhammad and Gupta, A.. (2014) Mathematical model for combined effect of SEI formation and gas evolution in Li-ion batteries. ECS Electrochemistry Letters, 3 (10). A95-A98.
Permanent WRAP URL:
http://wrap.warwick.ac.uk/98135
Copyright and reuse:
The Warwick Research Archive Portal (WRAP) makes this work by researchers of the University of Warwick available open access under the following conditions. Copyright © and all moral rights to the version of the paper presented here belong to the individual author(s) and/or other copyright owners. To the extent reasonable and practicable the material made available in WRAP has been checked for eligibility before being made available.
Copies of full items can be used for personal research or study, educational, or not-for-profit purposes without prior permission or charge. Provided that the authors, title and full
bibliographic details are credited, a hyperlink and/or URL is given for the original metadata page and the content is not changed in any way.
Publisher’s statement:
http://dx.doi.org/10.1149/2.0041410eel
A note on versions:
The version presented here may differ from the published version or, version of record, if you wish to cite this item you are advised to consult the publisher’s version. Please see the ‘permanent WRAP URL’ above for details on accessing the published version and note that access may require a subscription.
1
MATHEMATICAL MODEL FOR COMBINED EFFECT OF SEI
FORMATION AND GAS EVOLUTION IN LI-ION BATTERIES
Muhammad Rashid* and Amit Gupta**,1
Department of Mechanical Engineering, Indian Institute of Technology Delhi,
New Delhi 110016, INDIA
*Electrochemical Society Student Member **Electrochemical Society Member
2
ABSTRACT
In this study, a mathematical model to investigate the combined effect of SEI film formation
and gas evolution over the degradation of Li-ion cells is developed. A Li-ion cell is simulated
for three discharge/charge rates until 80% of the rated capacity is irreversibly lost in side
reactions. The model shows that the thickness of SEI film and volume of gases evolved is
between 0.03-0.22 μm and 1.6-10.6%, respectively. It is shown that, in addition to greater
diffusion limitations, capacity degradation at higher cycling rates is faster due to reduction in
cyclable lithium caused by its accumulation in the negative electrode.
KEYWORDS
3
Recent developments in Li-ion batteries (LIBs) have projected them to dominate the
automotive sector due to their high gravimetric and volumetric energy density1. However, life
of LIBs is limited due to fading of capacity of these energy storage systems with repeated
cycling. Various side-reactions take place as the ions of lithium travel from one electrode to
another through the electrolyte phase, some of which are electrolyte decomposition, passive
film formation, gas evolution and active material dissolution2,3. These unwanted reactions
consume active material and electrolytes, forming an insoluble solid and some liquid and
gaseous products2-5. The formation of a different gases at each electrode also depends on
whether the cell is being charged or discharged. For instance, CO, C2H4, CO2, and H2 are
formed at negative electrode due to electrolyte reduction, whereas electrolyte oxidation
produces CO2 at the positive electrode3,6. The formation of gas in a Li-ion battery can lead to
(i) swelling and pressure build-up inside the battery, and (b) loss of contact between electrode
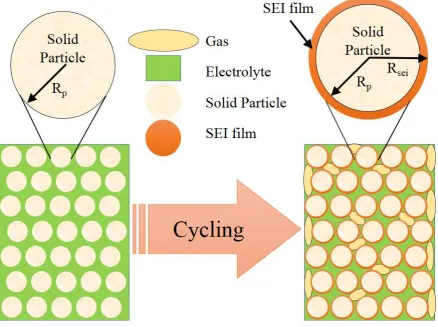
particles and reduction in the electrolyte volume fraction inside the porous electrode3 (as is
shown in Fig. 1). This reduction in electrolyte volume fraction limits the diffusion of Li-ions
through the electrolyte phase, thereby increasing the cell resistance and ohmic losses.
In the past, some experimental and numerical work has been carried out to understand the
influence of electrolyte decomposition-based SEI (solid electrolyte interphase) formation over
capacity fading of LIBs4-12. Methekar et al.13 simulated the formation of passive film across the
anode and concluded that slower charging rates result in slower growth rate of the SEI film.
However, it has been suggested that the formation of SEI occurs in tandem with the generation
of gas in LIBs as part of the electrolyte decomposition reaction, which for ethylene carbonate
(EC) as an electrolyte is given by2
2 2 2 2 2 4
4
With this consideration, it was shown that the generation of gases in LIBs can be controlled by
adding Li2CO3 as an electrolyte additive6. Another work demonstrated the evolution of gases
in various cathode materials under normal and overcharged conditions14. In a recent study, an
SEI layer based reduced-order model has been developed9 to quantify performance faster than
differential models for its obvious usage towards operational control9,10; however, it does not
consider any gas generation inside the battery.Although porosity change caused by deposits
on the anode has been studied previously15,16 , the formation of gas was ignored in these studies
as well. A thermo-electrochemical model to quantify the effect of gas evolution was developed
to observe the impact of gas volume fraction (and corresponding decrease in electrolyte volume
fraction) over a typical cell performance3. This quasi-steady model demonstrated the effect of
overall gas formation over battery performance, rather than continuous gas generation and its
impact on discharge capacity with increasing number of cycles. The influence of spatially
varying volume fraction over ohmic drop across the porous electrode has also been studied17.
However, no work has been directed towards identifying the impact of concurrent gas
generation and formation of SEI on the negative electrode over the transport properties of
electrodes and cycling performance of LIBs with repeating discharge and charge cycles. Thus,
the specific objectives of this work are:
a. Development of an SEI film formation and gas evolution based cyclic degradation
model of LIBs, and
b. To quantify the reduction in electrolyte volume fraction due to SEI and gas volume
fraction, and its impact over battery discharge capacity and performance as a function
of cycle number.
Mathematical model
Details of the ideal-cell isothermal model, which follows the porous-electrode and
5
section, the mathematical formulation of SEI formation and gas evolution and their coupling
with the electrochemical model are presented.
The reduction of the electrolyte at the anode, such as EC and as given in equation (1), is known
to produce insoluble alkyl carbonates and ethylene gas. This insoluble alkyl carbonate deposits
over anode particles to form a thin SEI film. The formation of a low conductivity film at the
anode increases resistance for Li diffusion, whereas gaseous products behave like inert
materials and reduce the electrolyte volume fraction3. To capture these two interdependent
events, the parasitic reaction current density of the electrolyte decomposition reaction can be
considered to follow the cathodic Tafel kinetics11,12
para n c para n para RT F j a
J 0 exp , (2)
where
para s e para sei n
J
U R
a
(3)
The fraction of volume of solid deposit in the form of SEI film and gases produced by
electrolyte decomposition reaction at anode can be written as4
para i
i J V
t nF
(4)
where subscript ‘i’ stands for solid deposit (sd) or gases (g). The actual volume changes in a
cell could be predicted by determining the deformation of the cell casing by prescribing the gas
pressure as a loading on the structure. To reduce model complexity, the physical model has
been simplified by taking the cell volume as fixed; instead the gas formed is assumed to occupy
the pore-space in the negative electrode. Thus, the volume occupied by precipitated solid at
6 s p sd sd V V (5)
The volume of the solid phase (i.e., including SEI) can be written asVsei Vp Vsd. Combining
with eqn. (5) and on simplification, the radius of the solid phase will be given by
3 / 1 1 s sd n sei r r
(6)Thus, the thickness of the SEI film(
sei
r
sei
r
n) can be expressed as
1 1
3 / 1 s sd n
sei r
(7)and the resistance of the film will be
sei sei sei R (8)
The instantaneous electrolyte volume fraction due to film formation and gas generation is given
by
0
e e sd g
(9)The volume occupied by the generated gas and SEI film is perceived to depend over various
parameters such as electrolyte potential, solid phase potential, applied current and the exchange
current density of the parasitic reaction. However, in the literature a lack of clarity prevails
regarding the dependence of exchange current density of parasitic reaction on applied current
due to dearth of experimental and analytical procedures to quantify the relationship. In other
words, the exchange current density has only been reported for a fixed value of charging
(typically 1C). However, it is known that parasitic reactions dominate (and parasitic reaction
7
exchange current density on applied current has been approximated in this study by a
non-linear relationship given by
1 0 0 1 C m app para C i j j i
(10)
where
j
10C is fixed to be 4×10⁻⁷ A/m211,12 and m is assumed to be 0.5.These equations, together with the pseudo-2D electrochemical model18,19, comprise the
governing equations for the degradation model. To solve this set of differential, algebraic and
non-linear coupled equations, the finite-element based solver COMSOL Multiphysics was
employed with a total of 79 two-noded, one-dimensional elements across the cell domain. A
direct solver capable of supporting cluster computing has been used for conducting
simulations20. The CPU time for simulating 1000 cycles at 1C rate on a single core of an i7
processor with 8GB RAM was approx.100 hours.
Results and Discussion
The pseudo-2D model with SEI formation and gas evolution phenomena has been simulated in
this work to study the behavior of LiMn2O4/MCMB cell. The electrolyte used is 1:2 EC:DMC
with 2M LiPF6. Open circuit potentials of electrodes and electrolyte transport property have
been taken from Doyle et al21. For the lithium ethylene carbonate deposited on the anode, the
mass density5 and electronic conductivity12 have been taken to be 1690 kg/m3 and 3.79×10⁻⁷
S/m, respectively. The molar volume of generated gas has been taken as 4×10⁻⁴ m3/mol. Other
cell parameters are: for the negative electrode (thickness=100 μm, particle size=12.5 μm, e0
=0.357), for the positive electrode (thickness=183 μm, particle size=8 μm, e0=0.444),
separator (thickness=52 μm). Upara for the parasitic reaction has been taken to be 0.4V11,12. As
done in practice, the cell has been cycled at different charge-discharge rates within cut off
8
Each ‘cycle’ consisted of a constant current discharge (i.e., iapp) to the lower cutoff voltage,
followed by same current charge (i.e., -iapp) to the upper cutoff voltage, and finished with a
constant voltage charge until the charging current decayed to 1/20th of the 1C current.
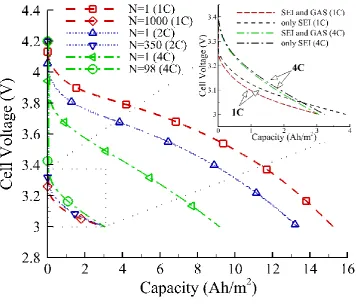
Fig. 2 shows the variation of cell potential with capacity at different cycling rates of 1C, 2C
and 4C. As the discharge rate increased, the initial cell potential was considerably lower than
the OCP, which is also consistent with an earlier work22. Based on simulations, the capacity of
a ‘fresh’ cell was calculated as 15.23, 13.32 and 9.16 Ah/m2 at 1C, 2C and 4C, respectively.
As shown in Fig. 2, when cycling the cell under different rates of 1C, 2C and 4C, 80% of the
nominal (1C) capacity was lost in 1000th, 350th, and 98th cycle, respectively. This decrease in
the number of cycles indicates that the combined SEI-gas formation model captures the
increased rate of degradation at higher rates. The results of simulation conducted without
considering gas evolution have been shown in the inset of Fig. 2. The discharge capacity of the
cell at 1C rate for 1000th cycle was 3.9 and 3.05 Ah/m2 for only SEI and SEI with gas evolution
model, respectively. However, the thickness of the SEI film was nearly equal due to identical
charging conditions in both cases.
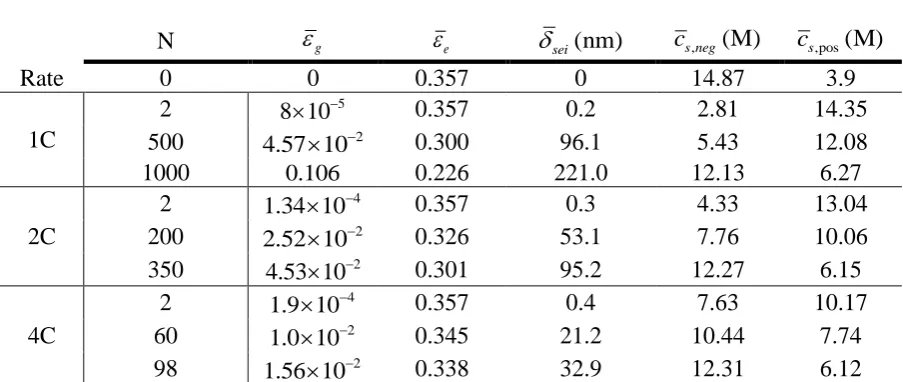
The variation in space-averaged SEI film thickness with cycle number for different cycling
rates is given in Table 1. Also listed are the change in the average volume fraction of the
electrolyte and gas generated for different cycling rates. It can be observed that the volume
fraction of electrolyte decreases monotonously as it is consumed in the decomposition reaction.
Further, the electrolyte reacts with cyclable Li-ions to form an SEI film (whose thickness
increases) which is accompanied by the release of gas. Gas evolution and film formation was
rapid (albeit for a shorter duration) when the cell was cycled at higher rates of 2C and 4C;
however, the overall magnitude is lesser when compared to the 1C rate owing to the shorter
9
cell life was 0.22, 0.095, and 0.033 μm for 1C, 2C and 4C, respectively. The corresponding
volume of gas evolved was recorded to be 10.6, 4.5, and 1.6%, respectively, which is an
improvement on the fixed 7% volume of gas assumed irrespective of charging rate in an earlier
study3. The increased rate of capacity fade at higher currents is due to two reasons: (a) the
transport limitation of Li-ion diffusion inside the negative electrode and electrolyte, and (b) the
reduction in cyclable lithium concentration across the cell.
To explain the reduction in cyclable lithium between the electrodes, the average lithium
concentration in the negative electrode at the end of discharge after a few cycles was analyzed
and is listed in Table 1. For all rates, it can be noticed that the concentration of lithium in the
negative electrode increased continuously with cycling (and decreased for the positive
electrode). This increase in solid lithium in the negative electrode was due to the constant
current (CC) discharge process. As mentioned earlier, the complete cycle consisted of CC
discharge followed by CC and constant voltage (CV) charge. Charging the cell at CV transfers
the maximum possible lithium from the positive to the negative electrode, whereas due to CC
discharge that much lithium cannot be extracted from the latter electrode. By this way, lithium
is accumulated in the negative and depleted from the positive electrode. From Table 1, it is also
clear that this phenomenon of reduction in ‘cyclable’ lithium is rapid in the case of cycling at
higher rates and is the prime reason for the rapid cell degradation during high rate cycling.
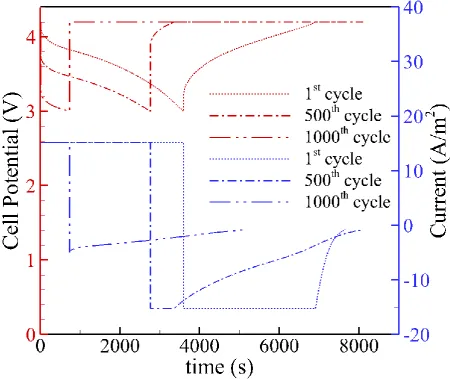
To highlight the reduction in cell capacity and potential with cycling, the current profile and
cell potential for the 1st, 500th, and 1000th cycle at 1C rate are shown in Fig. 3. As the cycle
number increased, the cell discharged in a short duration due to substantial drop in electric
potential over the SEI film. During the first cycle, the time duration of charging through CC
was longer than CV; however, as the cycle number increased, duration of CC decreased and
CV increased due to the resistance offered by the SEI film over the negative electrode and
10
number increased further, the internal resistance caused a large potential change across the
film, due to which the Li-ion cell ceased to go through the CC charging process. Rather, and
as shown in Fig. 3, CV charging began much earlier and continued for a longer time duration
until a cut-off current was reached. Moreover, the effect of the SEI film was also felt during
the CC discharge portion of every new cycle as the time duration for discharging the cell kept
decreasing due to a higher potential drop across the film. This lowering of the discharge
duration resulted in a continuous decline in the cell capacity to a point where it dropped by
80% of the starting capacity.
To conclude, a mathematical model has been developed to investigate the combined effect of
the SEI film formation and gas evolution over the capacity degradation of Li-ion cells. A rapid
loss in cell capacity at high rates was attributed to the reduction in cyclable lithium in the cell.
Simulations demonstrated that high rate operation results in increased rates of film and gas
formation and rapid capacity loss.
NOMENCLATURE
an specific interfacial area of the negative electrode (m-1)
F Faraday’s constant (96,487 C/mol)
iapp applied current (A/m2)
J total current density (A/m3)
Jpara parasitic reaction current density (A/m3)
0 para
j parasitic reaction exchange current denity
n number of electrons
rn particle radius of anode(m)
rsei particle radius with SEI film (m)
11 Rsei film resistance (Ω/m2)
t time (s)
T temperature (K)
Upara equilibrium potential of parasitic reaction (V)
V volume (m3)
Vp volume of active material in the anode (m3)
n c,
cathodic transfer coefficient of anode
sei
SEI film thickness (m)
0
e
initial volume fraction of electrolyte
e
volume fraction of electrolyte
g
volume fraction of gas
sd
volume fraction of solid deposit
e
electrolyte phase potential (V)
s
solid phase potential (V)
para
12
REFERENCES
1. J.M. Tarascon and M. Armand, Nature, 414, 359 (2001).
2. P. Arora, R.E. White, S. Carolina and M. Doyle, J. Electrochem Soc., 145, 3647 (1998).
3. J.H. Seo, J. Park, G. Plett and A.M. Sastry, Electrochem. Solid-State Lett., 13, A135
(2010).
4. Y. Dai, L. Cai and R.E. White, J. Electrochem. Soc., 160, A182 (2012).
5. X. Lin, J. Park, L. Liu, Y. Lee, A. M. Sastry and W. Lu, J. Electrochem. Soc., 160,
A1701 (2013).
6. J. Shin, C. Han, U. Jung, S. Lee, H. Kim and K. Kim, J. Power Sources,109, 47 (2002).
7. P. Ramadass, B. Haran, P.M. Gomadam, R. White and B.N. Popov, J. Electrochem.
Soc.,151, A196 (2004).
8. M. Broussely, P. Biensan, F. Bonhomme, P. Blanchard, S. Herreyre, K. Nechev and
R.J. Staniewicz, J. Power Sources, 146, 90 (2005).
9. A. V. Randall, R.D. Perkins, X. Zhang and G.L. Plett, J. Power Sources, 209, 282
(2012).
10.G.L. Plett, Electrochem. Solid-State Lett., 2, 63 (2013).
11.G. Ning, R.E. White and B.N. Popov, Electrochim. Acta, 51, 2012 (2006).
12.G. Ning and B.N. Popov, J. Electrochem. Soc., 151, A1584 (2004).
13.R.N. Methekar, P.W.C. Northrop, K. Chen, R.D. Braatz and V.R. Subramanian, J.
Electrochem. Soc.,158, A363 (2011).
14.W. Kong, H. Li, X. Huang and L. Chen, J. Power Sources,142, 285 (2005.
15.G. Sikha, B. N. Popov and R. E. White, J. Electrochem. Soc., 151, A1104 (2004)
16.M. Safari, M. Morcrette, A. Teyssot and C. Delacourt, J. Electrochem. Soc., 156,
13
17.V. Ramadesigan, R.N. Methekar, F. Latinwo, R.D. Braatz and V.R. Subramanian, J.
Electrochem. Soc.,157, A1328 (2010).
18.M. Doyle, T. F. Fuller and J. Newman, J. Electrochem. Soc., 140, 1526 (1993).
19.T. F. Fuller, M. Doyle and J. Newman, J. Electrochem. Soc., 141, 1 (1994).
20.P. R. Amestoy, I. S. Duff and J. Y. L’Excellent, Comput. Methods Appl. Mech. Eng.,
184, 501 (2000).
21.M. Doyle, J. Newman, A. S. Gozdz, C. N. Schmutz and J. M. Tarascon, J. Electrochem.
Soc., 143, 1890 (1996).
22.P.W.C. Northrop, V. Ramadesigan, S. De and V.R. Subramanian, J. Electrochem. Soc.,
14
FIGURE CAPTION
Figure 1 Schematic representation of anode before and after cycling.
Figure 2 Voltage vs. capacity for different cycling rates. The inset shows a comparison
of results considering (i) only SEI, and (ii) SEI with gas formation when
almost 80% capacity is lost due to degradation.
Figure 3 Current and cell potential for 1C rate for different number of cycles. The
abscissa has been translated so that the beginning of discharge for each cycle
18
TABLE CAPTION
Table 1 Various output properties of the cell at the end of discharge as a function of
the ongoing cycle number (N) for various rates. For instance, N=500 will
19 Table 1
Rate
N g e sei(nm) cs neg, (M) cs,pos(M)
0 0 0.357 0 14.87 3.9
1C
2 5
8 10 0.357 0.2 2.81 14.35
500 2
4.57 10 0.300 96.1 5.43 12.08
1000 0.106 0.226 221.0 12.13 6.27
2C
2 4
1.34 10 0.357 0.3 4.33 13.04
200 2
2.52 10 0.326 53.1 7.76 10.06
350 2
4.53 10 0.301 95.2 12.27 6.15
4C
2 4
1.9 10 0.357 0.4 7.63 10.17
60 2
1.0 10 0.345 21.2 10.44 7.74
98 2