This paper is available online free of all access charges (see http://jxb.oxfordjournals.org/open_access.html for further details)
ReseaRch PaPeR
A scanner system for high-resolution quantification of
variation in root growth dynamics of
Brassica rapa
genotypes
Michael O. Adu1,2, Antoine Chatot1,*, Lea Wiesel1, Malcolm J. Bennett2, Martin R. Broadley2, Philip J. White1 and Lionel X. Dupuy1,†
1 Department of Ecological Sciences, The James Hutton Institute, Invergowrie, Dundee, DD2 5DA, Scotland, UK
2 Plant and Crop Sciences Division, School of Biosciences, University of Nottingham, Sutton Bonington Campus, Leicestershire, LE12 5RD, UK
* Current address: Daphnestraße 32, 81925 München, Germany
† To whom correspondence should be addressed. E-mail: [email protected]
Received 2 September 2013; Revised 22 November 2013; Accepted 20 January 2014
Abstract
The potential exists to breed for root system architectures that optimize resource acquisition. However, this requires the ability to screen root system development quantitatively, with high resolution, in as natural an environment as possible, with high throughput. This paper describes the construction of a low-cost, high-resolution root phenotyp-ing platform, requirphenotyp-ing no sophisticated equipment and adaptable to most laboratory and glasshouse environments,
and its application to quantify environmental and temporal variation in root traits between genotypes of Brassica rapa
L. Plants were supplied with a complete nutrient solution through the wick of a germination paper. Images of root systems were acquired without manual intervention, over extended periods, using multiple scanners controlled by customized software. Mixed-effects models were used to describe the sources of variation in root traits contribut-ing to root system architecture estimated from digital images. It was calculated that between one and 43 replicates would be required to detect a significant difference (95% CI 50% difference between traits). Broad-sense heritability was highest for shoot biomass traits (>0.60), intermediate (0.25–0.60) for the length and diameter of primary roots and lateral root branching density on the primary root, and lower (<0.25) for other root traits. Models demonstrate that root traits show temporal variations of various types. The phenotyping platform described here can be used to quantify
environmental and temporal variation in traits contributing to root system architecture in B. rapa and can be extended
to screen the large populations required for breeding for efficient resource acquisition.
Key words: Architecture, high-resolution, high throughput, model, nitrogen, phenotyping, phosphorus, root.
Introduction
Breeding crops with better root system architectures (RSAs) for the acquisition of water and mineral elements and, thereby, greater resource-use efficiency, requires the ability to screen root system development quantitatively, in high resolution, nondestructively, in as natural an environment as
possible, on a large number of genotypes in a short time (de
Dorlodot et al., 2007; Walter et al., 2007; Zhu et al., 2011;
Fiorani and Schurr, 2013). Traditional techniques used in the
field include soil coring (Box and Ramsuer, 1993),
trench-ing (Vepraskas and Hoyt, 1988), and pinboard excavation
(Oliveira et al., 2000), followed by washing substrate from the roots and quantification of root length and diameters. These techniques are slow and laborious, destructive, prone to inac-curacy (because small roots are lost during washing), and
ill suited to screening large genetic populations (Smit et al.,
2000; Trachsel et al., 2010).
This is an Open Access article distributed under the terms of the Creative Commons Attribution License (http://creativecommons.org/licenses/by/3.0/), which permits unrestricted reuse, distribution, and reproduction in any medium, provided the original work is properly cited.
© The Author 2014. Published by Oxford University Press on behalf of the Society for Experimental Biology.
at University of Nottingham on November 18, 2016
http://jxb.oxfordjournals.org/
2040 | Adu et al.
To overcome some of the limitations of phenotyping root systems in the field, researchers have developed methods to phenotype the root systems of plants growing in artificial substrates under controlled conditions in the laboratory or glasshouse. Various translucent, artificial media have been
employed, including water (Drew and Saker, 1975; Tuberosa
et al., 2002), aeroponics (Waisel, 2002; Eshel and Grunzweig,
2013), gels (Bengough et al., 2004; Shi et al., 2013), and
trans-parent soils (Downie et al., 2012). The use of transparent
artificial substrates has many advantages. First, the homoge-neity of the media is controlled, and therefore it is possible to minimize the inherent variability of the root traits observed. Imaging is facilitated in clear media, and the application of automated algorithms for the extraction of root features is,
therefore, possible (French et al., 2009). The light spectrum
can be exploited to improve image quality and reduce the
effects of high light doses on root growth (Yazdanbakhsh
and Fisahn, 2009). Using dyes and fluorescence imaging, it is also possible to characterize functional traits, such as
apo-plastic pH (Bibikova et al., 1998). Biospeckle laser imaging, a
more recent technique, provides new opportunities to screen
for functional traits without the use of a dye (Ribeiro et al.,
2014). Finally, transparent substrates allow 3D descriptions
of RSAs using a range of techniques such as laser scanning (Fang et al., 2009), optical (Iyer-Pascuzzi et al., 2010; Clark
et al., 2011), or light sheet tomography (Yang et al., 2013).
Although these techniques facilitate nondestructive analy-ses of RSAs, root traits of plants grown in these substrates are not always well correlated with those of plants grown in
the field (Wojciechowski et al., 2009; Schmidt et al., 2012).
Another common technique is to observe roots growing at the interface between soil and a transparent barrier. This
includes observations from belowground rhizotrons (Bland
et al., 1990) or minirhizotrons inserted into the soil (Zeng
et al., 2008; Dupuy et al., 2010) and observations of plants
growing in rhizotubes or rhizoboxes (Nagel et al., 2012;
Dresbøll et al., 2013). However, these techniques provide only partial information about RSAs and can affect plant growth
by physical interactions (Wenzel et al., 2001).
Recently, radiation-based techniques, such as nuclear
mag-netic resonance imaging (Rascher et al., 2011) and neutron
and X-ray computed tomography (Oswald et al., 2008; Flavel
et al., 2012; Mairhofer et al., 2013), have become popular
because they allow noninvasive measurements of RSAs in soils. However, instrumentation costs are generally high and the acquisition of data is often too slow to enable dynamic measurements of root system development or the screening
of large genetic populations (Iyer-Pascuzzi et al., 2010; Smith
and De Smet, 2012; Fiorani and Schurr, 2013).
This paper describes a low-cost, high-resolution root phe-notyping platform that requires no sophisticated equipment and is adaptable to most laboratory and glasshouse environ-ments. It is based on a traditional pouch-and-wick system (Liao et al., 2001; Hund et al., 2009) in which roots are grown on the surface of germination paper and imaged in high reso-lution using flatbed scanners. Images were acquired without manual intervention, over extended periods, using multiple scanners controlled by customized software. The platform
was used to screen RSAs of up to 48 plants simultaneously and has the potential to be expanded. The platform was used to estimate the number of replicates required to detect differ-ences in traits contributing to RSAs between genotypes of Brassica rapa L. and to quantify genotypic, environmental, and temporal variation in these traits.
Materials and methods
Genetic materialThe variability of root architectural traits was studied in a diploid inbred line of B. rapa L. subsp. trilocularis cv. R-o-18 (Stephenson et al., 2010). Two parents (cv. IMB211 and cv. R500) and 14 recom-binant inbred lines (RILs) of the BraIRRI mapping population were used to study variations in root traits caused by genetic fac-tors. The BraIRRI population is an immortal mapping population consisting of 160 RILs derived from the cross between IMB211 and R500 (Iniguez-Luy et al., 2009). Genotype IMB211 is a highly inbred rapid cycling Chinese cabbage B. rapa subsp. pekinensis and R500 is a highly inbred annual yellow sarson B. rapa subsp. trilocu-laris (Iniguez-Luy et al., 2009; Xu et al., 2010).
Growth conditions
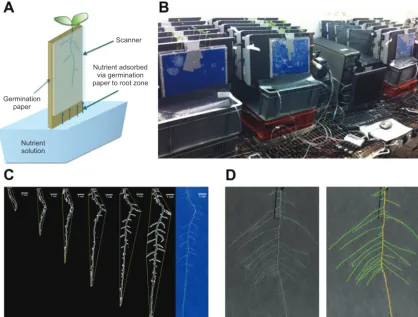
Plants were grown using a pouch-and-wick system (Liao et al., 2001; Hund et al., 2009). Seeds were sown on 12 × 12 cm germina-tion papers (Anchor Paper, Saint Paul, MN, USA) sprayed with deionized water and placed vertically in a Sanyo MIR153 incuba-tor at 20 °C. Three days after sowing (DAS), seedlings of similar size with radicles 2–3 cm in length were transferred to large sheets of germination paper (30 × 42 cm) attached to flatbed scanners using 30 × 20 cm clear-Perspex plates (Fig. 1a). The germination paper sur-rounding each radicle was cut and transferred with the seedling to minimize disturbance during this process. Two seedlings were placed on each large sheet of germination paper. Scanners were fixed in near-vertical positions 5 cm above 20 l of nutrient solution con-tained in opaque polyvinyl plastic tanks, each supplying six scan-ners (Fig. 1b). Approximately 10 cm of the germination paper was submerged in the nutrient solution.
Nutrient solution was prepared with deionized water and con-tained 2 mM Ca(NO3)2, 2 mM NH4NO3, 0.75 mM MgSO4, 0.5 mM
KOH, 0.25 mM KH2PO4, 0.1 mM FeNaEDTA, 30 mM H3BO3,
25 mM CaCl2, 10 mM MnSO4, 3 mM CuSO4, 1 mM ZnSO4, and
0.5 mM Na2MoO4 (Broadley et al., 2003). The nutrient solution
was adjusted to pH 6 at the start of the experiment using H2SO4.
Plants were grown under a 16/8 h day/night cycle. Temperature in the growth room was kept constant at 15 °C. Light intensity during the day was maintained at 100 μmol m–2 s–1 at plant height. Relative
humidity was approximately 60%. Seedlings were removed from scanners at 18 DAS. Roots were excised from the shoot base and freshweight (FW) of roots and shoots was recorded. Shoot and root samples were dried at 60 °C for 72 h and dry weight (DW) was deter-mined. The single genotype experiment on R-o-18 was performed in five independent runs, each run comprising eight scanners with two plants per scanner. Trait data was collected on 72 plants. The multi-ple-genotype experiment on the 16 BraIRRI lines was performed in two independent runs, each run comprising two consecutive assays of a subset of eight genotypes grown in four banks of six scanners with two plants per scanner. Trait data was collected on 190 plants.
Time-lapse imaging of roots
Images were taken daily from 3 to 18 DAS using flatbed scanners. Scanners were chosen for this purpose because their resolution is high compared to standard cameras. Thus, fine roots and root hairs have the potential to be resolved. In this study, 24 A4 CanoScan
at University of Nottingham on November 18, 2016
http://jxb.oxfordjournals.org/
5600F scanners (Canon UK, Reigate, UK) were assembled in four banks of six scanners (Fig. 1b). This allowed the root systems of 48 seedlings to be imaged simultaneously. The frequency of image acquisition, scanning resolution, and file format was controlled by three computers using in-house software (ArchiScan). ArchiScan was programmed in Python and employs the TWAIN module (http:// twainmodule.sourceforge.net/) for communicating between comput-ers and scanncomput-ers. The program is distributed under the GPL2 open source license and can be downloaded from the ArchiRoot website (http://www.archiroot.org.uk). ArchiScan is generic software and can be used with any scanner provided a TWAIN driver is available.
Image segmentation and extraction of root features
Features of a root system at specific timepoints were determined using ImageJ (http://rsbweb.nih.gov/ij/), using either in-house mac-ros that can be downloaded from the ArchiRoot website (Fig. 1c) or the SmartRoot plugin (Fig. 1d; http://www.uclouvain.be/en-smart-root). Image analysis was carried out on greyscale images obtained from the red channel of the colour images. Median and Gaussian filters were applied to remove noise resulting from, for example, con-densation on the surface of scanners or differences in the texture of the germination paper. Variations in pixel intensity over longer distances than the root diameter resulting from, for example, nonu-niform moisture content of the germination paper were removed by subtracting the mean background pixel intensity of neighbouring pixels from the pixel intensity of the original image. Macros imple-mented: (1) the moment-preserving threshold algorithm of (Tsai, 1985), which was used for segmentation of the restored image; (2)
an edge-tracing algorithm to define the boundary (perimeter) of root tissues; (3) an algorithm to remove objects external to the root system from the image; and (4) algorithms to estimate global traits of the root system (total root length, total root cross-sectional area, total root perimeter, convex hull of the root system) on 2D images (Fig. 1c). SmartRoot was used to produce a skeleton of intercon-nected individual roots that defines RSAs (Lobet et al., 2011). Throughout the text, root traits are referred to as ‘static’ if the meas-ure is obtained at a single timepoint, such as at the end of an experi-ment, or ‘dynamic’ if the measure integrates multiple timepoints during an experiment. Root traits are termed ‘global’ when derived from an entire root system or ‘local’ when the measurement refers only to a portion of the root system.
Statistical analysis
The experiment with a single genotype (B. rapa subsp. trilocularis cv. R-o-18) was used to calculate the number of replicates (R) that would be required to detect a significant difference between two populations with identical standard deviations in a trait using a two-sided 95% confidence interval (CI) t-test if the trait means differed by 50% (Supplementary Data Equation S1 available at JXB online; Eng, 2003).
[image:3.633.101.520.50.367.2]The sources of variation in static root traits in the single-gen-otype experiment were determined using a mixed-effects model with experimental run and scanner considered as random factors (Supplementary Data Equation S2). The sources of variation in static root traits in the multiple-genotype experiment were deter-mined using a mixed-effects model with experimental run, scanner, Fig. 1. (A) Schematic representation of the pouch-and-wick system used to grow plants in the phenotyping platform. Roots grew on the surface of germination paper held between a clear-Perspex plate and the glass window of a scanner. Scanners were fixed in near-vertical positions 5 cm above 20 l of nutrient solution contained in opaque polyvinyl plastic tanks each supplying six scanners. Approximately 10 cm of the germination paper was submerged in the nutrient solution. (B) The phenotyping platform comprising 24 scanners assembled in four banks of six scanners. (C) The features of a root system, including the convex hull, at successive timepoints obtained using customized ImageJ macros, including the root system at the last timepoint. (D) The features of a root system at a specific timepoint obtained using the SmartRoot plugin for ImageJ.
at University of Nottingham on November 18, 2016
http://jxb.oxfordjournals.org/
2042 | Adu et al.
and genotype considered as random factors (Supplementary Data Equation S3). The sources of variation in dynamic root traits were determined using mixed-effects models with genotype and DAS considered as random factors. Logistic growth functions were used to model the increase in total root length and primary root length with time (Supplementary Data Equation S4). The growth rate of a lateral root was expressed as the quotient of the lateral root length divided by the length of time after its emergence from the primary root. A quadratic function was used to model the growth rate of lateral roots (Supplementary Data Equation S6).
Statistical analyses of static root traits were performed using GenStat release 14.1 (VSN International, Oxford, UK). Statistical analyses of all mixed-effects models were performed using R soft-ware and the nlme library (Pinheiro and Bates, 2000; R Development Core Team, 2012; Pinheiro et al., 2013).
Results
A new platform for high-resolution quantification of root architectural development
Plants grew vigorously for up to 15 days in the pouch-and-wick system and showed no symptoms of mineral deficiencies when provided with an appropriate nutrient solution through the wick. Images of roots were acquired daily with no manual intervention. The custom-written ArchiScan software was used to control the acquisition of images by multiple scanners and computers. Using the customized macros, it was possible to measure global RSA traits from these images and detailed architectural parameters of root systems at the end of
experi-ments were extracted using SmartRoot (Lobet et al., 2011).
Total root length estimated using the custom-written macros was highly correlated with total root length estimated using
SmartRoot (R2=0.77, n=20; data not shown). However, the
macros generally underestimated total root length, probably because they did not detect extremely fine root features.
Sources of variation in static root traits of a single B. rapa genotype
The root system of the genotype studied in detail, B. rapa
L. subsp. trilocularis cv. R-o-18, consisted of a single primary
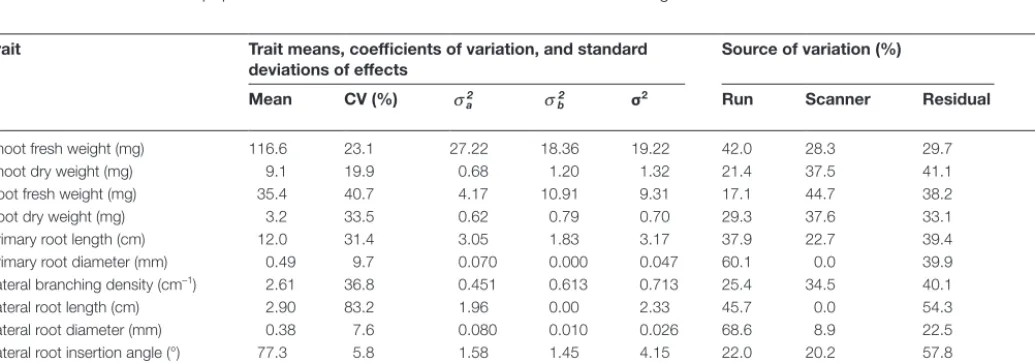
root and several first-order lateral roots which emerged from the primary root. The emergence of second-order laterals was rarely observed and these roots were therefore not included in any analyses. Coefficients of variation (CVs) for root traits ranged from 5.8 for lateral root insertion angle to 83.2 for lateral root length. Most of the variation in all the traits examined, except for lateral root insertion angle and lateral root length, could be attributed to vagaries in experimental conditions (i.e. run and
scanner). Using Supplementary Data Equation S1, it can be
cal-culated that between one and 43 replicates, depending upon the trait, would be required to detect a significant difference using a
two-sided 95% CI t-test if trait means differed by 50% (Table 1).
Genotypic variation in root traits
A significant effect of genotype (P<0.001) was observed for
all root traits measured on parents and RILs of the BraIRRI
population (Table 2). The parental genotypes exhibited
extreme values for many biomass and root length traits. The R500 genotype had the largest values for the major-ity of root and shoot traits assayed. However, although the IMB211 genotype had the smallest values for total lateral root length and total root length, it did not have the lowest values for all root and shoot traits, providing some evidence for transgressive segregation. Neither parental genotype had the most extreme values for lateral branching density, length or diameter of lateral roots, or lateral root insertion angle.
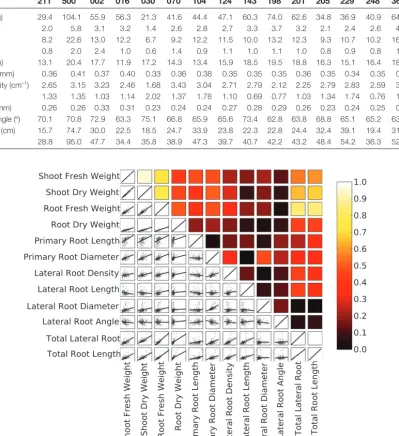
There were strong positive correlations among biomass
[image:4.633.53.571.552.733.2]traits among the 190 plants studied (Fig. 2). Total root length
Table 1. Sources of variation in shoot and root traits assayed at 18 DAS among 72 surviving seedlings of Brassica rapa L. subsp.
trilocularis cv. R-o-18 grown for 15 days in the phenotyping platform
The experiment was performed in five runs employing eight scanners per run and two plants per scanner. mean, mean trait value; CV, coefficient of variation (n=72 seedlings); σa2, estimated variance associated with the effect of the run; σb2 estimated variance associated with the effect of the scanner; σ2, estimated variance associated with the residual error; R, number of replicates required to detect a significant difference in a measured trait between two populations with identical standard deviations in the trait using a two-sided 95% confidence interval t-test.
Trait Trait means, coefficients of variation, and standard deviations of effects
Source of variation (%) R
Mean CV (%) σa2 σb2 σ2 Run Scanner Residual
Shoot fresh weight (mg) 116.6 23.1 27.22 18.36 19.22 42.0 28.3 29.7 3.3
Shoot dry weight (mg) 9.1 19.9 0.68 1.20 1.32 21.4 37.5 41.1 2.4
Root fresh weight (mg) 35.4 40.7 4.17 10.91 9.31 17.1 44.7 38.2 10.2
Root dry weight (mg) 3.2 33.5 0.62 0.79 0.70 29.3 37.6 33.1 6.9
Primary root length (cm) 12.0 31.4 3.05 1.83 3.17 37.9 22.7 39.4 6.1
Primary root diameter (mm) 0.49 9.7 0.070 0.000 0.047 60.1 0.0 39.9 0.6
Lateral branching density (cm–1) 2.61 36.8 0.451 0.613 0.713 25.4 34.5 40.1 8.3
Lateral root length (cm) 2.90 83.2 1.96 0.00 2.33 45.7 0.0 54.3 42.5
Lateral root diameter (mm) 0.38 7.6 0.080 0.010 0.026 68.6 8.9 22.5 0.4
Lateral root insertion angle (°) 77.3 5.8 1.58 1.45 4.15 22.0 20.2 57.8 0.2
Total lateral root length (cm) 101.3 40.3 29.7 27.6 29.9 34.1 31.7 34.3 10.0
Total root length (cm) 112.0 37.1 29.5 28.4 30.2 33.5 32.2 34.3 8.5
at University of Nottingham on November 18, 2016
http://jxb.oxfordjournals.org/
was strongly positively correlated with shoot and root bio-mass, total lateral root length, lateral root branching density on the primary root, and lateral root length. The diameter of the primary root was also correlated with shoot and root bio-mass and with the diameter of lateral roots. Little correlation was found between either primary root length or lateral root insertion angle and any other trait.
Little variation in the traits assayed was attributed directly to run or scanner in the multiple-genotype experiment. The effects of genotype, and the effects of interactions between
genotype×run, genotype×scanner, and genotype×run×scanner
accounted for most of the experimental variation (Table 3).
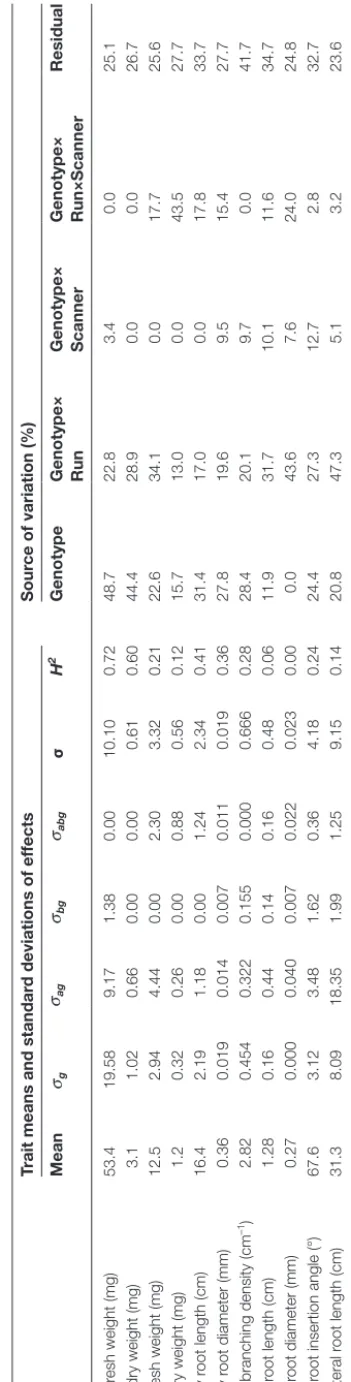
The effect of genotype alone accounted for more variation in shoot traits than in root traits. The effect of genotype alone accounted for >44% of the variation in shoot biomass, but only 15–23% of the variation in root biomass. Broad-sense heritability, estimated as the quotient of the estimated variance associated with the genotypic effect and the total variance for
the trait (σg2/σ2p), was largest for shoot biomass traits (>0.60),
[image:5.633.120.519.116.552.2]intermediate (0.25–0.60) for length and diameter of primary Table 2. Genotypic variation in shoot and root traits assayed at 18 DAS among the parents (IMB211, R500) and 14 recombinant inbred lines of the Brassica rapa BraIRRI mapping population grown for 15 days in the phenotyping platform
A significant effect of genotype was observed for all traits measured (P<0.001, n=190 plants). LSD=least significant difference.
IMB 211
R 500
IRRI 002
IRRI 016
IRRI 030
IRRI 070
IRRI 104
IRRI 124
IRRI 143
IRRI 198
IRRI 201
IRRI 205
IRRI 229
IRRI 248
IRRI 360
IRRI 380
LSD
Shoot fresh weight (mg) 29.4 104.1 55.9 56.3 21.3 41.6 44.4 47.1 60.3 74.0 62.6 34.8 36.9 40.9 64.8 75.3 9.63
Shoot dry weight (mg) 2.0 5.8 3.1 3.2 1.4 2.6 2.8 2.7 3.3 3.7 3.2 2.1 2.4 2.6 4.1 4.7 0.63
Root fresh weight (mg) 8.2 22.6 13.0 12.2 6.7 9.2 12.2 11.5 10.0 13.2 12.3 9.3 10.7 10.2 16.1 21.9 4.05
Root dry weight (mg) 0.8 2.0 2.4 1.0 0.6 1.4 0.9 1.1 1.0 1.1 1.0 0.8 0.9 0.8 1.4 1.9 0.8
Primary root length (cm) 13.1 20.4 17.7 11.9 17.2 14.3 13.4 15.9 18.5 19.5 18.8 16.3 15.1 16.4 18.2 17.9 2.04
Primary root diameter (mm) 0.36 0.41 0.37 0.40 0.33 0.36 0.38 0.35 0.35 0.35 0.36 0.35 0.34 0.35 0.38 0.38 0.003
Lateral branching density (cm–1) 2.65 3.15 3.23 2.46 1.68 3.43 3.04 2.71 2.79 2.12 2.25 2.79 2.83 2.59 3.07 3.81 0.540
Lateral root length (cm) 1.33 1.35 1.03 1.14 2.02 1.37 1.78 1.10 0.69 0.77 1.03 1.34 1.74 0.76 1.07 1.74 0.487
Lateral root diameter (mm) 0.26 0.26 0.33 0.31 0.23 0.24 0.24 0.27 0.28 0.29 0.26 0.23 0.24 0.25 0.31 0.27 0.036
Lateral root insertion angle (º) 70.1 70.8 72.9 63.3 75.1 66.8 65.9 65.6 73.4 62.8 63.8 68.8 65.1 65.2 63.3 71.0 4.12
Total lateral root length (cm) 15.7 74.7 30.0 22.5 18.5 24.7 33.9 23.8 22.3 22.8 24.4 32.4 39.1 19.4 31.8 57.7 13.01
Total root length (cm) 28.8 95.0 47.7 34.4 35.8 38.9 47.3 39.7 40.7 42.2 43.2 48.4 54.2 36.3 52.1 75.6 13.47
Fig. 2. Correlations between plant traits. The plots below the diagonal show linear regressions (red lines) of the data (black points) for different traits. The correlation coefficients for these linear regressions are indicated by the colour of the boxes above the diagonal. The scale of colour codes indicates the correlation coefficients between two traits.
at University of Nottingham on November 18, 2016
http://jxb.oxfordjournals.org/
2044 | Adu et al.
Table 3.
Sources of variation and broad-sense heritability in shoot and root traits assayed at 18 DAS among 190 sur
viving seedlings of the parents (IMB211, R500) and 14
recombinant inbred lines of the
Brassica rapa
BraIRRI mapping population grown for 15 days in the phenotyping platform
m=mean trait value;
σg 2, estimated variance associated with the ef
fect of genotype;
σag 2, estimated covariance associated with the ef
fect of genotype×experimental run;
σbg 2 , estimated
covariance associated with the ef
fect of genotype×scanner;
σab
g
2
, estimated covariance associated with the ef
fect of genotype×experimental run×scanner;
σbg
2
, estimated variance
associated with the r
esidual err
or
, H
2, br
oad-sense heritability
.
Trait
Trait means and standar
d deviations of ef
fects
Sour
ce of variation (%)
Mean σg σag σbg σab g σ H 2 Genotype
Genotype× Run Genotype× Scanner Genotype× Run×Scanner
Residual
Shoot fr
esh weight (mg)
53.4 19.58 9.17 1.38 0.00 10.10 0.72 48.7 22.8 3.4 0.0 25.1
Shoot dry weight (mg)
3.1 1.02 0.66 0.00 0.00 0.61 0.60 44.4 28.9 0.0 0.0 26.7 Root fr
esh weight (mg)
12.5 2.94 4.44 0.00 2.30 3.32 0.21 22.6 34.1 0.0 17.7 25.6
Root dry weight (mg)
1.2 0.32 0.26 0.00 0.88 0.56 0.12 15.7 13.0 0.0 43.5 27.7 Primary r
oot length (cm)
16.4 2.19 1.18 0.00 1.24 2.34 0.41 31.4 17.0 0.0 17.8 33.7 Primary r
oot diameter (mm)
0.36 0.019 0.014 0.007 0.011 0.019 0.36 27.8 19.6 9.5 15.4 27.7
Lateral branching density (cm
–1) 2.82 0.454 0.322 0.155 0.000 0.666 0.28 28.4 20.1 9.7 0.0 41.7 Lateral r
oot length (cm)
1.28 0.16 0.44 0.14 0.16 0.48 0.06 11.9 31.7 10.1 11.6 34.7 Lateral r
oot diameter (mm)
0.27 0.000 0.040 0.007 0.022 0.023 0.00 0.0 43.6 7.6 24.0 24.8 Lateral r
oot insertion angle (°)
67.6 3.12 3.48 1.62 0.36 4.18 0.24 24.4 27.3 12.7 2.8 32.7
Total lateral r
oot length (cm)
31.3 8.09 18.35 1.99 1.25 9.15 0.14 20.8 47.3 5.1 3.2 23.6 Total r
oot length (cm)
47.8 9.73 18.75 1.23 2.15 9.45 0.18 23.6 45.4 3.0 5.2 22.9
roots and lateral root branching density on the primary root, and smallest (<0.25) for root biomass traits, lateral root length, lateral root diameter, lateral root insertion angle, total lateral
root length, and total root length (Table 3).
The dynamics of root growth
Primary root length and total root length were measured daily
during the course of the experiment (Fig. 3). The increases in
primary root length and total root length with time followed a sigmoidal shape for all genotypes and the data showed no irreg-ularities. The model that fitted the combined data for all geno-types best was a logistic growth function. The most informative model included only a single, random-effect parameter (the
asymptote, Ø1, Supplementary Data Equation S4) describing
the effect of genotype on the growth in primary root length
or total root length. Both the inflection point (Ø2) and scale
parameter of the logistic growth function (Ø3) were constants
across all genotypes studied. Values for the inflection point and scale parameter of the logistic growth function describ-ing primary root length were 8.82 DAS and 0.211, respectively. Values for the inflection point and scale parameter of the logis-tic growth function describing total root length were 10.4 DAS and 0.310, respectively. Asymptotes for primary root length
and total root length differed between genotypes (Table 4).
The parental genotype IMB211 had an asymptote of 17.4 cm and the parental genotype R500 had an asymptote of 28.3 cm for primary root length. The parental genotype IMB211 had the smallest asymptote (37.3 cm) and the parental genotype R500 had the largest asymptote (126.6 cm) of all the genotypes assayed for total root length. These observations are consistent with the measurements of primary root length and total root
length assayed at 18 DAS (Table 2).
The relationship between the growth rate of first-order lat-eral roots and their day of emergence after transfer to the phenotyping platform followed a quadratic function for all
genotypes (Fig. 4). The lateral roots that emerged first (the
basal lateral roots) generally had faster elongation rates than those that emerged later. The maximum lateral root elonga-tion rate predicted by the model fitted to the data was 0.35 cm
d–1. The most informative model included only one,
random-effect parameter (bi1, Supplementary Data Equation S6)
describing the effect of genotype on the initial growth rate of first-order lateral roots. The maximum initial growth rate
(bi1 + β1) of first-order lateral roots ranged from 0.216 to
0.307 cm d–1, with IMB211 having a value of 0.255 cm d–1 and
R500 having a value of 0.290 cm d–1. Unexplained residual
errors in the model for lateral root elongation rate (Fig. 4)
were greater than those for the models for either primary root
length or total root length (Fig. 3).
Discussion
Screening for root traits that improve crop yield
The efficient acquisition of a particular mineral element requires a specific set of root traits, many of which have
been identified (Dunbabin et al., 2003; Lynch, 2007, 2013;
at University of Nottingham on November 18, 2016
http://jxb.oxfordjournals.org/
A
[image:7.633.49.293.100.534.2]B
Fig. 3. Measured (circles) and predicted (lines) values of primary root length (A) and total root length (B) of the two parents and five recombinant inbred lines of the Brassica rapa BraIRRI mapping population over the 15 d following transfer to the phenotyping platform. Predicted values were estimated using a nonlinear mixed-effects model (Supplementary Data
Equation S4). Error bars indicate standard error of the predicted means.
White et al., 2013a,b). However, breeding for such root traits, either directly through screening for the traits themselves or indirectly through the identification of molecular-markers
associated with the traits, requires observations on large populations of genotypes, which necessitates high-through-put, low-cost phenotyping platforms. Imaging is the central component of high-throughput phenotyping. Images contain detailed quantitative information on plant shape and mor-phologies. Images can be acquired rapidly and without man-ual intervention using, for example, motorized positioners and conveyors to move samples and/or image capture
equip-ment (Yazdanbakhsh and Fisahn, 2009; Hartmann et al.,
2011). Image data can be obtained at regular time intervals
for a large number of samples. Image analysis algorithms can then be used to extract biologically meaningful traits
auto-matically from image data (Armengaud et al., 2009; Lobet
et al., 2011). Unfortunately, the development of such systems
requires considerable expertise in engineering and computer programming and large monetary investments in infrastruc-ture. These prerequisites are often lacking in plant research laboratories. Root images are also noisier that shoot images and the image resolution obtained with conventional cameras can be a limitation to phenotyping.
The phenotyping platform developed for the experiments reported here can overcome some of these limitations. The platform requires no sophisticated equipment and is adapt-able to most laboratory and glasshouse environments. The utility of flatbed scanners for high-resolution imaging of
roots was recently demonstrated by Dresbøll et al. (2013)
in their study of the responses of tomato root growth to anoxia. The quality of the images obtained when roots were imaged against the uniform background of the germination paper using the scanners enabled efficient image analysis (Fig. 1). The ability to control multiple scanners automati-cally allowed the acquisition of images over extended periods without manual intervention and will enable the extension of phenotyping platform to the simultaneous screening of larger populations of genotypes.
Variation in root growth among B. rapa genotypes
Coefficients of variation for specific shoot and root traits
meas-ured in 72 individuals of R-o-18 varied considerably (Table 1).
The relationship between the CV for a trait and the number of replicates required to detect a significant difference follows a quadratic function. Since the CVs for many root traits were large, many replicates would be required to detect differences in these traits between genotypes. Since plants were grown on the surface of a germination paper with homogeneous
Table 4. Estimates of the asymptotes (Ø2, Supplementary Data Equation S4) for mixed-effects models describing temporal variation in total root length and primary root length, and the intercept (bil+b1, Supplementary Data Equation S6) for the mixed-effects model
describing the growth rate of first-order lateral roots among the parents (IMB211, R500) and 14 recombinant inbred lines of the Brassica rapa BraIRRI mapping population grown for 15 days in the phenotyping platform
IMB 211
R 500
IRRI 002
IRRI 016
IRRI 030
IRRI 070
IRRI 104
IRRI 124
IRRI 143
IRRI 198
IRRI 201
IRRI 205
IRRI 229
IRRI 248
IRRI 360
IRRI 380
Total root length 37.3 126.6 64.2 49.4 47.8 56.8 55.9 47.5 61.1 56.1 53.5 61.3 67.6 52.6 71.5 113.7
Primary root length 17.4 28.3 22.3 17.0 22.9 19.1 17.1 20.3 25.4 29.0 26.5 21.1 22.5 23.5 19.1 24.0
Lateral growth rate 0.255 0.290 0.255 0.273 0.307 0.285 0.326 0.262 0.216 0.234 0.263 0.296 0.295 0.233 0.281 0.297
at University of Nottingham on November 18, 2016
http://jxb.oxfordjournals.org/
[image:7.633.42.569.673.733.2]2046 | Adu et al.
distribution of water and mineral nutrients, most of the varia-bility observed in root traits is intrinsic to the processes of root development. Intrinsic noise, or developmental stochasticity, is particularly significant in plant roots. It has been shown, for example, that innate changes in lateral root growth rates can exceed by up to 5-fold those observed in response to nitrate
availability (Forde, 2009). It is essential therefore to develop
ways to characterize developmental stochasticity in order to minimize residual variations in root phenotyping experiments.
The phenotyping platform developed here was used to quantify variation in shoot and root morphological traits from
a selection of genotypes (Table 2). A significant effect of
geno-type was observed for all traits. It is usually observed that shoot biomass traits have larger broad-sense heritability that root
biomass traits (Arraouadi et al., 2012; Bouteillé et al., 2012),
and the results obtained with the pouch-and-wick system
con-firm these observations (Table 3). Broad-sense heritability of
root length typically ranges from 0.15 to 0.80 (Gahoonia and
Nielsen, 2004; Bouteillé et al., 2012). Although shoot biomass, primary root length, and lateral root branching density have large CVs, their heritability is high. Traits with large differences between genotypes and small variation within a genotype (i.e. high hereditability) require less replication to detect significant differences between genotypes than traits with either small dif-ferences between genotypes or low hereditability.
Many of the static traits described above show temporal variation. For example, primary root length and total root system length follow a sigmoidal growth function with time (Fig. 3). This has been observed in many crop species (Merrill
et al., 2002). It is also common to observe fastest growth
rates of lateral roots emerging a few days after sowing (Nacry
et al., 2005). This behaviour was best modelled on the
cur-rent data using a quadratic relationship between lateral root growth rate and day of emergence from the primary root
(Fig. 4). However, lateral root growth rate within a single plant was highly variable and the residual variances in mod-els were higher than in primary and total root length modmod-els. Although run was not a significant factor, there were large differences in the variance of the residual between two runs for the total root length models, and different models might be required in the future for the analysis of such data. There were significant effects of genotype on the dynamics of root
growth (Table 4 and Figs 3 and 4). Data for primary root
length and total root length indicate that all genotypes follow a similar growth pattern with time but differ in their absolute growth rate. Data for the elongation rate of lateral roots also indicate that all genotypes follow a similar pattern with time, but differ in their maximum growth rate.
The application of scanner-based high-resolution root phenotyping
Identifying chromosomal loci affecting a particular root trait (quantitative trait loci) requires evaluation of many hundreds
of genotypes with high replication (Qu et al., 2008; Sharma
et al., 2011; Shi et al., 2013). The phenotyping platform
described here can automatically image the root systems of
48 plants grown simultaneously (Fig. 1). It is, therefore, not
of a sufficient size to phenotype the root systems of a genetic mapping population within a short time period. However, since it has no moving parts, it is relatively simple to extend the platform, although achieving the required throughput might necessitate a reduction in the cost of the equipment. This could be achieved for example with a more economical imaging
tech-nology such as contact image sensors (Dannoura et al., 2012).
Real soil environments are also difficult to reproduce in laboratories and glasshouses. Roots grow in three dimensions and experience a range of physical conditions that
influ-ence their growth in various ways (Bengough et al., 2011).
Interactions with a range of biological organisms, such as bacteria and arbuscular mycorrhizal fungi, can also have a strong impact on the acquisition of water and mineral
ele-ments (Bucher, 2007). The ability to image root systems of
mature plants growing in soil is likely to improve the corre-lations between traits obtained in the phenotyping platform and measurements made in the field. The platform described here can be used to image the roots of plants growing in other
substrates, including soil (Dresbøll et al., 2013). Furthermore,
although the platform described here could only accom-modate young seedlings because of the size of the scanner window, root systems of larger plants might be accommo-dated by growing plants in larger pouches, which could be imaged in overlapping sectors and these images combined to reconstruct an image of the entire root system, as described
recently by Lobet and Draye (2013).
Root systems of plants grown in soil respond dynamically to changes in their local environment. For example, the devel-opment of RSAs alters in response to vagaries in the
avail-ability of water (Taylor and Ratliff, 1969; Rostamza et al.,
2013), the root distribution within the soil profile responds
to the presence of macropores and the depth at which a
[image:8.633.51.291.42.228.2]com-pacted subsoil is formed (Valentine et al., 2012; Acuña and
Fig. 4. Measured (circles) and predicted (lines) values of the elongation rates of lateral roots of the two parents and five recombinant inbred lines of the Brassica rapa BraIRRI mapping population as a function of the time of their emergence after transfer to the phenotyping platform. Predicted values were estimated using a nonlinear mixed-effects model
(Supplementary Data Equation S6). Error bars indicate standard error of
the predicted means.
at University of Nottingham on November 18, 2016
http://jxb.oxfordjournals.org/
Wade, 2013), lateral roots proliferate in patches of soil with
high availability of various essential mineral elements (Forde
and Walch-Liu, 2009; Hodge et al., 2009), and root systems develop to avoid exposure to toxic elements, such as cadmium
(Lux et al., 2011). The platform described here can be used
to investigate responses of the root systems to environmental variables and, if scaled to accommodate genetic mapping pop-ulations, to identify genetic factors affecting root responses to the environment. The ability to characterize dynamic responses to environmental variables will allow researchers to identify quantitative trait loci influencing the plasticity of the root system, which is required for marker-assisted selection of genotypes adapted to multiple soil types and
environmen-tal conditions (de Dorlodot et al., 2007; Hochholdinger and
Tuberosa, 2009; Hodge et al., 2009; Acuña and Wade, 2013). The application of scanner-based, high-resolution root phe-notyping of mature plants grown in soil could, therefore, facilitate the development of crop varieties that are better adapted to future environmental conditions.
Supplementary material
Supplementary data are available at JXB online.
Supplementary Data. Statistical models of root systems.
Acknowledgements
This work was supported by the Rural and Environment Science and Analytical Services Division (RESAS) of the Scottish Government through Work Package 3.3, ‘The soil, water and air interface and its response to climate and land use change’ (2011–2016). Funding for this study was pro-vided in part by the UK Biotechnology and Biological Sciences Research Council (BBSRC) Crop Improvement Research Club (grant BB/J019631/1) and a BBSRC Professorial Fellowship (to M.J.B.). M.O.A. was supported by the University of Nottingham Vice-Chancellor’s Scholarship for Research Excellence. Jim Anderson, Amy Gibson, Sophie Hiel, Ken Loades, Linda Ford, and Gill Banks provided invaluable help for laboratory work. The authors are grateful for advice from Jim McNichol and Christine Hackett on the statistical analyses.
References
Acuña TLB, Wade LJ. 2013. Use of genotype × environment interactions to understand rooting depth and the ability of wheat to penetrate hard soils. Annals of Botany 112, 359–368.
Armengaud P, Zambaux K, Hills A, Sulpice R, Pattison RJ, Blatt MR, Amtmann A. 2009. EZ-Rhizo: integrated software for the fast and accurate measurement of root system architecture. The Plant Journal 57, 945–956.
Arraouadi S, Badri M, Abdelly C, Huguet T, Aouani ME. 2012. QTL mapping of physiological traits associated with salt tolerance in Medicago truncatula recombinant inbred lines. Genomics 99, 118–125.
Bengough AG, Gordon DC, Al-Menaie H, Ellis RP, Allan D, Keith R, Thomas WTB, Forster BP. 2004. Gel observation chamber for rapid screening of root traits in cereal seedlings. Plant and Soil 262, 63–70.
Bengough AG, McKenzie BM, Hallett PD, Valentine TA. 2011. Root elongation, water stress, and mechanical impedance: a review of limiting stresses and beneficial root tip traits. Journal of Experimental Botany 62, 59–68.
Bibikova TN, Jacob T, Dahse I, Gilroy S. 1998. Localized changes in apoplastic and cytoplasmic pH are associated with root hair development in Arabidopsis thaliana. Development 125, 2925–2934.
Bland WL, Mesarch MA, Wolfe JE. 1990. A controlled-temperature rhizotron. Crop Science 30, 1142–1145.
Bouteillé M, Rolland G, Balsera C, Loudet O, Muller B. 2012. Disentangling the intertwined genetic bases of root and shoot growth in
Arabidopsis. PLoS One 7, e32319.
Box JE, Ramsuer EL. 1993. Minirhizotron wheat root data: comparisons to soil core root data. Agronomy Journal 85, 1058–1060.
Broadley MR, Bowen HC, Cotterill HL, Hammond JP, Meacham MC, Mead A, White PJ. 2003. Variation in the shoot calcium content of angiosperms. Journal of Experimental Botany 54, 1431–1446.
Bucher M. 2007. Functional biology of plant phosphate uptake at root and mycorrhiza interfaces. New Phytologist 173, 11–26.
Clark RT, MacCurdy RB, Jung JK, Shaff JE, McCouch SR, Aneshansley DJ, Kochian LV. 2011. Three-dimensional root
phenotyping with a novel imaging and software platform. Plant Physiology
156, 455–465.
Dannoura M, Kominami Y, Makita N, Hiroyuki, O. 2012. Flat optical scanner method and root dynamics. In: Mancuso S, ed, Measuring roots: an updated approach. New York: Springer, pp 127–133.
de Dorlodot S, Forster B, Pagès L, Price A, Tuberosa R, Draye X. 2007. Root system architecture: opportunities and constraints for genetic improvement of crops. Trends in Plant Science 12, 474–481.
Downie H, Holden N, Otten W, Spiers AJ, Valentine TA, Dupuy LX. 2012. Transparent soil for imaging the rhizosphere. PLoS One 7 e44276. Dresbøll DB, Thorup-Kristensen K, McKenzie BM, Dupuy L, Bengough AG. 2013. Timelapse scanning reveals spatial variation in tomato (Solanum lycopersicum L.) root elongation rates during partial waterlogging. Plant and Soil 369, 467–477.
Drew MC, Saker LR. 1975. Nutrient supply and the growth of the seminal root system in barley: II. Localized, compensatory increases in lateral root growth and rates of nitrate uptake when nitrate supply is restricted to only part of the root system. Journal of Experimental Botany 26, 79–90. Dunbabin V, Diggle A, Rengel Z. 2003. Is there an optimal root architecture for nitrate capture in leaching environments? Plant, Cell and Environment 26, 835–844.
Dupuy L, Vignes M, McKenzie BM, White PJ. 2010. The dynamics of root meristem distribution in the soil. Plant, Cell and Environment 33, 358–369.
Eng J. 2003. Sample size estimation: how many individuals should be studied? Radiology 227, 309–313.
Eshel A, Grunzweig JM. 2013. Root-shoot allometry of tropical forest trees determined in a large-scale aeroponic system. Annals of Botany 112, 291–296.
Fang S, Yan X, Liao H. 2009. 3D reconstruction and dynamic modeling of root architecture in situ and its application to crop phosphorus research.
The Plant Journal 60, 1096–1108.
Fiorani F, Schurr U. 2013. Future scenarios for plant phenotyping. Annual Review of Plant Biology 64, 267–291.
Flavel RJ, Guppy CN, Tighe M, Watt M, McNeill A, Young IM. 2012. Non-destructive quantification of cereal roots in soil using high-resolution X-ray tomography. Journal of Experimental Botany 63, 2503–2511.
Forde BG. 2009. Is it good noise? The role of developmental instability in the shaping of a root system. Journal of Experimental Botany 60, 3989–4002.
Forde BG, Walch-Liu P. 2009. Nitrate and glutamate as environmental cues for behavioural responses in plant roots. Plant, Cell and Environment
32, 682–693.
French A, Ubeda-Tomas S, Holman TJ, Bennett MJ, Pridmore T. 2009. High-throughput quantification of root growth using a novel image-analysis tool. Plant Physiology 150, 1784–1795.
Gahoonia TS, Nielsen NE. 2004. Root traits as tools for creating phosphorus efficient crop varieties. Plant and Soil 260, 47–57. Hartmann A, Czauderna T, Hoffmann R, Stein N, Schreiber F. 2011. HTPheno: an image analysis pipeline for high-throughput plant phenotyping. BMC Bioinformatics 12, 148.
Hochholdinger F, Tuberosa R. 2009. Genetic and genomic dissection of maize root development and architecture. Current Opinion in Plant Biology
12, 172–177.
at University of Nottingham on November 18, 2016
http://jxb.oxfordjournals.org/
2048 | Adu et al.
Hodge A, Berta G, Doussan C, Merchan F, Crespi M. 2009. Plant root growth, architecture and function. Plant and Soil 321, 153–187.
Hund A, Trachsel S, Stamp P. 2009. Growth of axile and lateral roots of maize: I development of a phenotying platform. Plant and Soil 325, 335–349. Iniguez-Luy FL, Lukens L, Farnham MW, Amasino RM, Osborn TC. 2009. Development of public immortal mapping populations, molecular markers and linkage maps for rapid cycling Brassica rapa and B. oleracea.
Theoretical and Applied Genetics 120, 31–43.
Iyer-Pascuzzi AS, Symonova O, Mileyko Y, Hao YL, Belcher H, Harer J, Weitz JS, Benfey PN. 2010. Imaging and analysis platform for automatic phenotyping and trait ranking of plant root systems. Plant Physiology 152, 1148–1157.
Liao H, Rubio G, Yan XL, Cao AQ, Brown KM, Lynch JP. 2001. Effect of phosphorus availability on basal root shallowness in common bean.
Plant and Soil 232, 69–79.
Lobet G, Draye X. 2013. Novel scanning procedure enabling the vectorization of entire rhizotron-grown root systems. Plant Methods 9, 1. Lobet G, Pagès L, Draye X. 2011. A novel image-analysis toolbox enabling quantitative analysis of root system architecture. Plant Physiology
157, 29–39.
Lux A, Martinka M, Vaculík M, White PJ. 2011. Root responses to cadmium in the rhizosphere: a review. Journal of Experimental Botany 62, 21–37.
Lynch JP. 2007. Roots of the Second Green Revolution. Australian Journal of Botany 55, 493–512.
Lynch JP. 2013. Steep, cheap and deep: an ideotype to optimize water and N acquisition by maize root systems. Annals of Botany 112, 347–357.
Mairhofer S, Zappala S, Tracy S, Sturrock C, Bennett M, Mooney S, Pridmore T. 2013. Recovering complete plant root system architectures from soil via X-ray μ-computed tomography. Plant Methods 9, 1–7. Merrill SD, Tanaka DL, Hanson JD. 2002. Root length growth of eight crop species in haplustoll soils. Soil Science Society of America Journal
66, 913–923.
Nacry P, Canivenc G, Muller B, Azmi A, Van Onckelen H, Rossignol M, Doumas P. 2005. A role for auxin redistribution in the responses of the root system architecture to phosphate starvation in arabidopsis. Plant Physiology 138, 2061–2074.
Nagel KA, Putz A, Gilmer F, et al. 2012. GROWSCREEN-Rhizo is a novel phenotyping robot enabling simultaneous measurements of root and shoot growth for plants grown in soil-filled rhizotrons. Functional Plant Biology 39, 891–904.
Oliveira RGM, Noordwijk M, Gaze SR, Brouwer G, Bona S, Mosca G, Hairiah K. 2000. Auger sampling, ingrowth cores and pinboard methods. In: Smit A, Bengough AG, Engels C, Noordwijk M, Pellerin S, Geijn S, eds, Root methods: a handbook. Berlin: Springer, pp 175–210. Oswald SE, Menon M, Carminati A, Vontobel P, Lehmann E, Schulin R. 2008. Quantitative imaging of infiltration, root growth, and root water uptake via neutron radiography. Vadose Zone Journal 7, 1035–1047. Pinheiro JC, Bates DM. 2000. Mixed-effects models in S and S-PLUS . New York: Springer-Verlag.
Pinheiro J, Bates D, DebRoy S, Sarkar D, R Development Core Team. 2013. nlme: linear and nonlinear mixed effects models. R package version 3.1–113. Vienna, Austria: R Development Core Team.
Qu YY, Mu P, Zhang HL, Chen CY, Gao YM, Tian YX, Wen F, Li ZC. 2008. Mapping QTLs of root morphological traits at different growth stages in rice. Genetica 133, 187–200.
Rascher U, Blossfeld S, Fiorani F, et al. 2011. Non-invasive approaches for phenotyping of enhanced performance traits in bean.
Functional Plant Biology 38, 968–983.
R Development Core Team. 2012. R: a language and environment for statistical computing . Vienna, Austria: R Foundation for Statistical Computing.
Ribeiro KM, Barreto B, Pasqual M, White PJ, Braga RA, Dupuy LX. 2014. Continuous, high-resolution biospeckle imaging reveals a discrete zone of activity at the root apex that responds to contact with obstacles.
Annals of Botany, 113, 555–563.
Rostamza M, Richards RA, Watt M. 2013. Response of millet and sorghum to a varying water supply around the primary and nodal roots.
Annals of Botany 112, 439–446.
Schmidt S, Bengough AG, Gregory PJ, Grinev DV, Otten W. 2012. Estimating root–soil contact from 3D X-ray microtomographs. European Journal of Soil Science 63, 776–786.
Sharma S, Xu S, Ehdaie B, Hoops A, Close T, Lukaszewski A, Waines JG. 2011. Dissection of QTL effects for root traits using a chromosome arm-specific mapping population in bread wheat. Theoretical and Applied Genetics 122, 759–769.
Shi L, Shi T, Broadley MR, White PJ, Long Y, Meng J, Xu F, Hammond JP. 2013. High-throughput root phenotyping screens identify genetic loci associated with root architectural traits in Brassica napus under contrasting phosphate availabilities. Annals of Botany 112, 381–389. Smit AL, Bengough AG, Engels C, van Noordwijk M, Pellerin S, van de Geijn SC. 2000. Root methods: a handbook. Berlin: Springer-Verlag.
Smith S, De Smet I. 2012. Root system architecture: insights from
Arabidopsis and cereal crops. Philosophical Transactions of the Royal Society B 367, 1441–1452.
Stephenson P, Baker D, Girin T, Perez A, Amoah S, King GJ, Ostergaard L. 2010. A rich TILLING resource for studying gene function in Brassica rapa. BMC Plant Biology 10, 62.
Taylor HM, Ratliff LF. 1969. Root elongation rates of cotton and peanuts as a function of soil strength and soil water content. Soil Science 108, 113–119.
Trachsel S, Kaeppler SM, Brown KM, Lynch JP. 2010. Shovelomics: high throughput phenotyping of maize (Zea mays L.) root architecture in the field. Plant and Soil 341, 75–87.
Tsai WH. 1985. Moment-preserving thresholding—a new approach.
Computer Vision Graphics and Image Processing 29, 377–393. Tuberosa R, Sanguineti MC, Landi P, Giuliani MM, Salvi S, Conti S. 2002. Identification of QTLs for root characteristics in maize grown in hydroponics and analysis of their overlap with QTLs for grain yield in the field at two water regimes. Plant Molecular Biology 48, 697–712. Valentine TA, Hallett PD, Binnie K, Young MW, Squire GR, Hawes C, Bengough AG. 2012. Soil strength and macropore volume limit root elongation rates in many UK agricultural soils. Annals of Botany 110, 259–270. Vepraskas MJ, Hoyt GD. 1988. Comparison of the trench-profile and core methods for evaluating root distributions in tillage studies. Agronomy Journal 80, 166–172.
Waisel Y. 2002. Aeroponics: a tool for root research under minimal environmental restrictions. In: Waisel Y, Eshel A, Kafkafi U, eds, Plant roots: the hidden half. New York: Marcel Dekker, pp 323–331.
Walter A, Scharr H, Gilmer F, et al. 2007. Dynamics of seedling growth acclimation towards altered light conditions can be quantified via GROWSCREEN: a setup and procedure designed for rapid optical phenotyping of different plant species. New Phytologist 174, 447–455. Wenzel W, Wieshammer G, Fitz W, Puschenreiter M. 2001. Novel rhizobox design to assess rhizosphere characteristics at high spatial resolution. Plant and Soil 237, 37–45.
White PJ, George TS, Dupuy LX, Karley AJ, Valentine TA, Wiesel L, Wishart J. 2013a. Root traits for infertile soils. Frontiers in Plant Science
4, 193.
White PJ, George TS, Gregory PJ, Bengough AG, Hallett PD, McKenzie BM. 2013b. Matching roots to their environment. Annals of Botany 112, 207–222.
Wojciechowski T, Gooding MJ, Ramsay L, Gregory PJ. 2009. The effects of dwarfing genes on seedling root growth of wheat. Journal of Experimental Botany 60, 2565–2573.
Xu XD, Xie QG, McClung CR. 2010. Robust circadian rhythms of gene expression in Brassica rapa tissue culture. Plant Physiology 153, 841–850. Yang Z, Downie H, Rozbicki E, Dupuy LX, MacDonald MP. 2013. Light sheet tomography (LST) for in situ imaging of plant roots. Optics Express 21, 16239–16247.
Yazdanbakhsh N, Fisahn J. 2009. High throughput phenotyping of root growth dynamics, lateral root formation, root architecture and root hair development enabled by PlaRoM. Functional Plant Biology 36, 938–946. Zeng G, Birchfield ST, Wells CE. 2008. Automatic discrimination of fine roots in minirhizotron images. New Phytologist 177, 549–557.
Zhu JM, Ingram PA, Benfey PN, Elich T. 2011. From lab to field, new approaches to phenotyping root system architecture. Current Opinion in Plant Biology 14, 310–317.
at University of Nottingham on November 18, 2016
http://jxb.oxfordjournals.org/