J. Biomedica doi: 10.4236/jb
Published On
An ana
using t
Chris C. St
1Bioprocess R 2Department o 3Department o
Email: erik.bo Received 6 Fe
ABSTRAC
There is con suring nucle tions. The m thod is the r analyzed wit (Ct) method. performed h of initial con a concentrat resultant Ct dard and no riability/relia supports th replicates, th tically distin ten orders o tion. As exp grow as the demonstrate confound qu tion at low t that a miscl 3000 initial c tion region thermal wea vide data th detection str and plate fi classification becomes unr Keywords:M Molecule Co Replicates an
1. INTRO
Real time Po
al Science an bise.2010.3506
nline May 201
alysis of
the C
t
m
towers1, Fre
R&D Division D of Biomedical E of Biomedical In oczko@vanderb
ebruary 2010; re
CT
nsiderable in eic acids from most common real-time poly
th the crossin . Utilizing a m hundreds of re nditions whose tion range of value distribu ovel statistica ability of the e following he mean and/o nguishable an of magnitude ected, the var
number of in e that these v uantitative cla template conc lassification t copies of temp
correlates w ar of the TAQ hat indicate rategy based lling statistic n transition w reliable.
Misclassificati ounting; Rank nd Reliability
ODUCTION
olymerase Ch
nd Engineerin 64 Published On
0 in SciRes.h
f quanti
method
ederick R. H
Dow AgroScien Engineering Van
nformatics Van bilt.edu
evised 1 March
nterest in qua m single cells
nly employed ymerase chain ng point or cr multiwell plate eplicate react e initial numb
ten orders of utions are an al techniques
e PCR proce conclusions. or median Ct d can be ran in initial tem riances in the nitial copies d variances are assification of
centrations. T transition is plate DNA an with independ Q polymerase that an alter on the theor cs is accurate where the re
ion Transition Ordering Run
N
hain Reaction
ng, 2010, 3, 45 nline May 2010
http://www.scir
itative P
Haselton2, Er
nces LLC Indian nderbilt Univer nderbilt Univers
h 2010; accepted
antitatively m to small pop d laboratory
n reaction (PC rossing thresh e reader we h tions each at a ber of copies s f magnitude.
alyzed with s to assess the ess. Our anal
Given suffic values are sta nk ordered ac mplate concen e Ct distribut declines to 1.
large enough f the initial co The data indi centered aro nd that the tra dent data on enzyme. We p rnative endp ry of well mix
e below the m eal time met
n; Single nning Title; P
(PCR) is wi
59-469 0 (http://www.S
rp.org/journal/j
PCR re
rik M. Boczk
napolis, Indiana rsity Nashville, sity Medical Ce
d 2 March 2010
mea- pula- me-CR) hold have a set span The stan-e va-lysis cient atis-cross ntra-tions We h to ndi-icate ound ansi-the pro-point xing mis- thod PCR; dely use cal mo [4-6 pro to u to s pro fact per mu a m I eme cro amp con dan clo amp kno that the cate cos to u pen
T in t num the low 1 init tud 2 betw 3 init SciRP.org/journa /jbise
eliability
ko3* a, USA; Nashville, USA enter Nashville, 0.ed for quantita and research dified foods, v 6]. In a real tim ocess is record
use the amplif solve the inve oxy for the am
tory solution red by the am
ltivariate natu model that acco
In its stead, th erged [12]. T ssing thresho plification cu nditions diverg nce with this
se to the dete plification err own result fro
t averaging ov number of re es appears typ st, time, effort
understand th ndence on initi The goal of th the distributio mber of identi
initial templ wing:
1) Are measu tial template c de?
2) How many ween differen 3) How does tial template c
al/jbise/).
y throu
A;
, Nashville, US
ative analysis areas includin vaccine effica me PCR react ded. The goal o
fication time s rse problem o mount of initia of this invers mplification o
ure of the enzy ounts for the v he ad-hoc cros The heuristic b ld is predicat urves from id
ge dramatical observation a ection thresho ror. But varia om the statist ver replicates eplicates. In p
pical. Since t t, and accurac he requiremen
ial template co his study was on of Ct valu
cally prepared late concentra
ures of centra concentration
y replicates ar nt initial templ the number o concentration?
gh repl
A.
[1-3] in a va ng the study o acy, and in sys
tion the DNA of a quantitati series data, of determining al template,
se problem ha f error, diluti yme system an variability [1,7 ssing point, C
behind the sel ted on the ob
dentically pre lly with iterati a threshold va ld to limit va ability remains
tics of Subsec reduces varian practice, from there is a bala cy it is of pra nt for replicate
oncentration. to examine t ues generated
d replicates as ation to determ
al tendency in over 10 orde
re required to late concentra of replicates d ?
JBiSE
licates
ariety of clini-of genetically stems biology amplification ive analysis is
g a reasonable
0 . A satis-as been ham-ion error, the nd the lack of 7-11].
Ct, method has
lection of the servation that epared initial ion. In accor-alue is chosen ariability from s. It is a well ction 4.8 [13] nce in ratio to m 1 to 5 repli-ance between actical interest es and its
de-the variability from a large s a function of mine the
fol-nformative of ers of
magni-o discriminate ations? depend on the
460 C. C. Stowers et al. / J. Biomedical Science and Engineering 3 (2010) 459-469
Copyright © 2010 SciRes. JBiSE
Using a multiwell plate format we measured hundreds of replicates to produce Ct value distributions. Using
standard and novel statistical techniques we analyze the
Ct value distributions and demonstrate that the sample
mean and/or median Ct values are statistically
signifi-cantly distinguishable over ten orders of magnitude. Furthermore, we show that the sample mean Ct values
are reliably ordered according to the initial concentration of template. In other words, if x and y are initial template
concentrations with x < y and µx and µy are the
corres-ponding sample mean Ct values then µx > µy. The order
reverses because less initial template requires more cycles of PCR to amplify. We utilize ordering as a con-venient and natural device to quantify the role of repli-cates on reliability. We ask and answer the following question: Given an unlabeled dilution series how many replicates are required to reliably order the tubes? We find that the answer depends on the range of initial tem-plate.
A focus of this work was to cover as broad a range of initial conditions as possible with the same experimental format. We observed that the mean and/or median Ct
values had the smallest variance above 104 initial copies.
Most published standard curves focus on this range [2]. Few studies have analyzed issues of variability and ro-bustness below this range. We show that below 104
ini-tial copies the probability of misclassification of the ini-tial template concentration given a Ctvalue grows
ra-pidly and saturates near a half. The dispersion in the Ct
value distributions and the rise in misclassification cor-relate with an independent measure of the thermal wear of the TAQ polymerase enzyme.
Driven by the observed broadening of the Ct value
distributions below a thousand initial copies, and in-spired by elegant methods that sidestep the issues created by the dynamics of exponential growth [14-18], we examined a format for single molecule detection uti-lizing an endpoint analysis and the statistical properties of well mixing and plate filling. We present data that such an assay is accurate where the real time method becomes unreliable.
2. MATERIALS AND METHODS
2.1. PCR
Rt-PCR results were generated using linearized double stranded EC3 plasmid DNA containing the ybdO gene. The plasmid was linearized by digestion with the restric-tion enzyme BamH1 prior to PCR. The following primer sequences were used.
1) Forward: 5’-AAT TAT TCT AAA ACC AGC GTG TC-3’
2) Reverse: 5’-TTT GGG ATT GAA TCA CTG TTT C-3’
The PCR supermix was prepared as described in [19], with the exception that we used Qiagen HotStarTaq Cat
# 203203, Roche dNTPs Cat# 13583000, DMSO Sigma # D8418 at 2%, and Sybr Green (Sigma # 86205) at 5-times the recommended concentration. Primers were used at a concentration of 1 µM. All samples were run
on the 384 well plate platform using an Applied Biosys-tems 7900HT thermocycler and the SDS 2.3 software. The Ct value threshold was set at 5.0 RFU (Relative
Fluorescence Units) for all samples. The DNA concen-trations of concentrated stocks were measured using a Nano-Drop 100 spectrophotometer prior to use. Subse-quent dilutions were performed using sterile, nuclease free water from Ambion # AM9937. The following thermo-cycling program was used.
1) 2 min at 50°C Initial Warmup Phase; 2) 15 min at 95°C Initial TAQ Activation Step; 3) 1 min at 95°C DNA Denaturation;
4) 1 min at 50°C Primer Annealing; 5) 1 min at 72°C DNA Extension;
6) 0.25 min at 80°C Fluorescence Measurement; 7) Repeat Steps 3-6 forty times.
2.2. Preparation of Identical Replicates
To ensure uniformity in the face of pipetting error the PCR supermix was prepared in well-mixed batches in a 14-mL conical tube. Each sample consisted of 184 rep-licates and 8 negative controls, requiring exactly half of a 384 well plate. All of the components except for DNA were loaded into a 14 mL conical tube in the following order: 800 µL PCR buffer, 5.6 mL of nuclease free water,
160 µL DMSO, 320 µL MgCl2 (Qiagen Cat #
124113012), 160 µL of a primer mix (a 1:1 mix of the
forward and reverse primer stored at a concentration of 50 M each), 160 µL Sybr Green (100X stored in DMSO),
160 µL of dNTPs, and lastly 80 µL of Taq polymerase.
We have noticed that the order at which these are added affects the reproducibility of the assay. The mixture was vortexed at high speed for 1 minute. 335 µL of supermix
was then removed to be used as a negative control and placed into a 1 mL eppendorf tube and 25 µL of water
was added. This mixture was then briefly vortexed to ensure well mixing. The remaining 7.105 mL of super-mix was then split equally four ways into 2 mL cryostat tubes, and 134 µL of water plus the amount of desired
DNA was added to each cryostat tube. Each tube was then briefly vortexed. For each reaction contained within a single well of the plate, 10 µL of the respective
reac-tion mix was loaded into a well of the 384 well plates.
2.3. TAQ Polymerase Pre-Wear Assay
C. C. Stowers et al. / J. Biomedical Science and Engineering 3 (2010) 459-4 461
Copyright © 2010 SciRes. JBiSE
added to the preworn enzyme with subsequent resump-tion of cycling. An efficiency was calculated by averag-ing the derivative over the resultant amplification curve.
2.4. Statistical Analysis of Ct Distributions
The sample mean Ct values for each initial template con-
centration were compared pairwise using a permutation test that is asymptotically valid and robust in situations where the distributions are not necessarily normal and/or the ratio of the variances is unknown, indicating that a t-test is not supported [20,21]. The test statistic T [20], measures the difference in mean rank of the samples within their union, scaled by a consistent estimator of their variance. Because the Ct value distributions may be
skewed by outliers, we also considered the median as a measure of central tendency. The median Ctvalues were
compared pair-wise using a bootstrap test that has been shown to outperform all reasonable alternative methods [22].
Given a linear regression, ymxb, of the mean/
median Ct values against x = log(n), the log of the
num-ber of initial copies of template, a relative error was cal-culated from the quantiles of the Ct value distributions as
follows. Allow x h
Q and x l
Q to be high and low
quan-tile values chosen from the Ct value distribution
gener-ated by initial log template x. Since the Ct value
gener-ally increases with decreasing amount of initial template the slope m of the regression line(s) is negative. Thus,
the difference in the predicted amount of initial template DNA from the distributions divided by the input amount is given as:
x
m b Q m b
Qlx hx
n n
10 10 10( ) ( )
(1)
Let U represent the universe of possible Ct values, and
let T stand for the collection of possible initial template
concentrations. The initial template concentrations are thought of as the class labels. We consider the probabil-ity of misclassifying an observed Ctvalue given a known
class label. Suppose that we draw a Ctvalue from a
giv-en class, how likely is it to find that value in any of the other classes? The mean misclassification probability is estimated from the Ct value distributions corresponding
to different initial template concentrations according to the following formula.
U i
x \ T | i P x | i P x
P( ) ( ) ( ) (2)
where P(i|x) is the conditional probability of finding the Ct value i, given the initial template concentration x,
and the P(i|T\x) is the conditional probability of observing that same value given any initial template concentration other than x. The later conditional prob-ability is interpreted as the probprob-ability of misclassi-
fication. The conditional probabilities are estimated from the measured Ct value frequency distributions.
2.5. Plate Filling with Microbeads
Experiments were performed using 20µm latex beads
from Beckman Coulter (#PN6602798) using flat bottom 96 well plates from Becton Dickinson Labware. 96 well plates were used in place of 384 well plates for ease of microscopic analysis. Various dilutions of beads were prepared using a Beckman Multisizer Coulter Counter 2. 25 µL of each dilution was loaded into each well of the
96 well plate. The number of beads in each well was counted with a Nikon TE-2000 microscope.
2.6. Plate Filling Simulations
The statistics of the plate filling stochastic process were modeled using Monte-Carlo simulation. For instance, the expected number of empty wells in a 96 well plate was estimated by simulation using the following function:
Table[Mean[ Table[Length[
Complement[Range[96],
RandomInteger[Range[96], m]]], {10000}]], {m, 1, 600}]
Here m is the number of molecules being plated from a well mixed solution. The mean is estimated from 10,000 realizations. The standard deviation is computed by replacing the function Mean by Standard Deviation. A graph of these functions is shown in Figure 9. All
simulations and analysis were carried out in Mathemati-ca 6.03 (Wolfram Research), and the notebooks are available upon request.
3. RESULTS
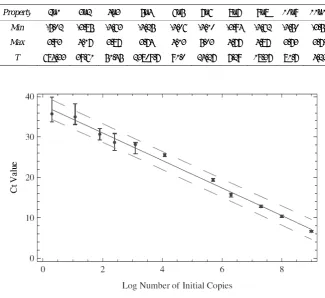
The Ct value data are summarized in Figure 1. The
fig-ure shows that above 104 copies the data are distributed
about the median with smaller variance than those below. Outliers exist across all the data, mostly trending upward of the median, indicative of reactions lagging behind the pack. The data show the distributions as collected across ten orders of magnitude in initial template.
3.1. Mean and Median Ct values
While the Ct value distributions below 104 copies of
ini-tial template DNA are broad and noisy, the sample means and medians form a monotone increasing series when stratified according to initial template. These data are shown in Table 1. The means and medians are very
nearly equal in all cases and the data distributions appear unimodal.
At initial template concentrations larger than 104
462
Copyright ©
F o r d
to identify d no hypothesi template con not within a another. Wh count the me a level of sig ception of th cally differen result of the in Table 2.
The Ctva
because we riances, stan
[image:4.595.107.493.101.495.2]
© 2010 Sci
Table 1. Samp Observe that th
Distribution N
Log Copies T
Replicates
Mean Ct Valu
Median Ct Va
Figure 1. Summ of DNA amplif run at each initi dots. Outliers ar
istinguishable is test appears ncentrations it a fraction of hen all of the eans and medi gnificance gre he smallest tw
nt at the 3/10 significance t
alue distributi do not a pri dard hypothe
C. C. Stowers
Res.
ple mean and m he sample mean
Number
Template
ue
alue
mary of the Ct fied. As describ
ial condition. T re defined as po
e mean and m s necessary. H
is not clear th f a standard
data points a ians are statist eater than 1/20
wo medians t 000 level of test for the m
ions may no ori know the sis tests to co
s et al. / J. Bio
median Ct values ns and medians 1 2 9.0 8.0 184 182 6.6 10.6 6.6 10.4
value data, stra bed in the mater The box covers t oints beyond 3/
median values However at lo hat the means deviation of are taken into tically differen 0000 with the that were stat significance. means is displa
t be normal e ratio of the ompare means
omedical Scien
s. The correspon form an ordere
3 4 7.3 6.3 183 183 6 12.8 15.6 4 12.8 15.7
atified as a func rials and metho two quartiles ab /2 the discrete in
and ower s are one o
ac-nt at e
ex- tisti-The ayed
and va-s are
not bee hav con dist dec upp fou var exp trib larg ima crim
nce and Engin
nding distributi ed sequence stra
5 6 5.7 4.1 184 183 6 19.5 25.5 7 19.3 25.5
ction of the log ods section, a m
bout the median nterquantile ran
t justified. S en proposed f ve shown to ntains the T-tributions. Th clining as tem per boundary urth and fifth riance estimat plains the larg butions contai ger variances ately 184 rep mination over
neering 3 (201
ions are shown atified by initia
7 8 9
3.1 2.1 1.9 184 179 730 27.6 28.8 30. 28.1 28.7 30.
g of the initial n minimum of 175 n with outliers nge from the ed
Several non-p for this comm
have power. -statistic com he values of th mplate decreas of the null distributions tor takes its ge T value. Al in some over s. The data in
licates the C
r nine orders
10) 459-469
in Figure 1. al template.
10 11 9 1.1 0.3
0 175 178 7 35.5 36.4 7 35.0 35.7
number of copie 5 replicates wer shown as the re dge of the box.
parametric m mon situation The last row mparing temp he T-statistic ses and come distribution. s are non-ove
minimum va ll of the other rlap and henc ndicate that
Ct method can
of magnitude
JBiSE
es re ed
methods have n [20,21] and w of Table 2
plate-adjacent are generally closer to the Because the erlapping the alue and this r pairs of dis-ce have much with approx-n provide dis-e. One goal of
E
e d
2
t y e e e s -h
Copyright
our work, to analysis of h make the sam
3.2. Standa
A linear reg initial copies The regressi over the entir contrast, Fig
described by contains at l also be seen gression line In an inde and supermi experiences
C. C. Sto
© 2010 Sci
o be describe how few repl me claim.
ard Curves
gression of th s of DNA tem ion line captu
re range of in
gure 1 gives th
y a function t least two sigm n in the oscilla in Figure 2.
ependent expe x, we examin as a function
[image:5.595.132.458.377.675.2]Table 2. applied p treme val with the T Table 1. applied to side of th thesis is re
Property Min Max T
Figure 2. sion line i on the ind tributions.
owers et al. /
Res.
ed below, is licates are req
he mean Ct v
mplate is sho ures the data nitial template
he impression that is initially moid like tran ation of the d
eriment with t ned the wear n of thermocy
Results of test airwise to Ct v lues of the dist
T-statistic for a In each test, th o the pooled da he range indicat ejected with co
y 2v1 3v
-5.02 -3
3.93 4.
684.33 39
Linear regress is shown in red dividual data po
.
/ J. Biomedic
to provide so quired to relia
alues against own in Figur
a reasonably w concentration n that the data
y linear and t nsitions. This data about the
the same enzy that the enzy ycling alone.
ting the null hy value distributio ribution of the adjacent distrib he null distribut ata as described ting that the p-v
nfidence. v2 4v3
.85 -4.63
.17 3.87
9.61 51.45 2
sion of the mea d along with a 9 oints reflect on
cal Science a
ome ably
log
re 2.
well n. In a are then can e
re-yme yme The
mid of a wea whe ind tran gre
G mea from equ and in F
pro sha as tran
ypothesis of sto ons adjacent in
T-statistic und
butions. The dis tion was simul d in [20]. In eac
value is less th
5v4 6v5
-4.25 -4.06
3.74 4.13
23809.7 91.0
an Ct values wi 95% confidence ne standard dev
and Engineer
ddle of the tra approximately ar transition c ere the distrib dependent obse
nsition point ssion. The dat Given a regre
asure of the m the spread uation for n, a
d third quartile
Figure 5. The
oximately 20% arply below. T the red line, nsition region,
ochastic equalit n initial templat der the null hyp stributions, e.g. lated using 20,0 ch test the calc han 1/20000. In
7v6 8v7
-4.10 -3.94
5.03 4.77
24.27 7.29
th log initial co e interval in da
iation compute
ring 3 (2010)
ansition region y 25. As seen corresponds to butions begin t ervation, we s and consider ta are summar ssion model o relative error
in the Ct val
as described in es were used e data show th % above 104
The piecewise produces a l , and agrees e
ty. A hypothes te concentration pothesis are sh . “2v1”, are lab 000 random pe
ulated T-statist
n each case the
9v8 10v9
-4.62 -4.50
4.87 3.73
18.37 81.7
opy number. Th shed line. The ed from the Ct v
) 459-4
n corresponds n in Figure 1
o the region ne to broaden. B split the data red a piecew rized in Figur
of the data w r of the inver
lue distributio n Subsection to produce th hat the relativ
4 initial copi
e linear regre larger relative
lsewhere.
is test was n. The ex-hown along
beled as in ermutations tic fell
out-null
hypo-9 11v10
0 -3.57
3.74
4.22
he regres-error bars value
463
JBiSE
s to a Ct value 1, the thermal
ear 104 copies
ecause of this in two at this ise linear
re-re 4.
e computed a rsion process, ons, using the 2.4. The first he data shown ve error is ap-es, and rises ession, shown e error in the 3
E
e l s s s
464
Copyright ©
3.3. Miscla
The graph o shown in Fi
that the broa the inverse p centration fr attempt to su
Ct value dist
initial templ value we con in the equatio The constr
[image:6.595.139.460.83.293.2] [image:6.595.136.462.345.544.2]
© 2010 Sci
Figure compute Error ba
Figure to the tr ssification
f the relative
gure 5 is an
adening of the problem of ass rom a measur ummarize the tributions on t ate concentra nsidered stati on for P(x) de
ruction of a s
C. C. Stowers
Res.
3. TAQ effici ed as the avera ars represent a s
4. Piecewise lin rends observed
error of the attempt to qu e Ct value dis
signing an init red Ct value.
impact of th the process of ation based o istics such as escribed in Sub standard curve
s et al. / J. Bio
iency as a fun age derivative o standard deviati
near regression in Figures 1 an
linear regress uantify the ef stributions has tial template c In an alterna he variance of f categorizing on a measured
that summar bsection 2.4. e, as describe
omedical Scien
nction of therm of relative fluor ion over three i
n of the mean C
nd 3.
sion, ffect s on con-ative f the g the d Ct
rized
ed in
the con ano rep plat ure like clas the valu qua data
nce and Engin
mo-cycling pre-escence over th independent exp
Ct values. The d
previous sec ncentration to other. Consid resenting a c te concentrati d Ct value co
ely is it to m ss label? The distributions ue will be mi antifies this n a set, are show
neering 3 (201
wear. An effic he amplification periments.
data were split a
ction, is one o a measured der each dist lass. The cla ion. The heuri
oming from misassociate t larger the ov , the more lik isclassified. T notion. The re wn in Figure 6
10) 459-469
ciency is n curves.
according
way to assig d Ct value. N
tribution of ss label is th istic is this: G one of these this value wit verlap between
kely it is that The formula f esults, condit
6.
JBiSE
gn a template Now consider
Ct values as
he initial tem-Given a meas-classes, how th the wrong n the meat of t an unknown for P(x) given
tioned on our
E
e r s -w
Copyright
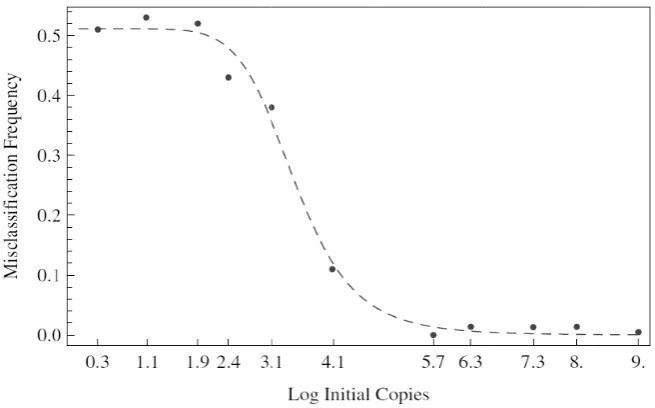
The analys results show probability o Over a narro concentration quently, at lo less saturate
C. C. Sto
[image:7.595.135.460.86.290.2] [image:7.595.133.461.374.578.2]© 2010 Sci
Figure and the ues cor whose l given in
Figure Subsect Hill's fu proxima
sis indicates, a wn in Figure
of misclassific ow range span n the probabi ower concentr es at the val
owers et al. /
Res.
5. Relative err e standard curve rresponding to limits were cal n Subsection 2.
6. Misclassifica tion 2.4 and con unction is show ately 2950 copi
as is clearly c
1, that abov
cation are sma nning the nex ility rises to rations, the pr lue of one h
/ J. Biomedic
ror of the PCR es shown in Fig the first and t culated using th 4.
ation frequency nditioned upon wn as the dash es of initial tem
orrelated with ve 105 copies
all, less than xt two decade one half. Su robability mor half and equ
cal Science a
process as calc gures 2 and 4, B third quartile w
he regression li
y calculated acc the Ct value dis hed line. The m mplate DNA.
h the the 0.1. es of
ubse-re or uates
clas the clas Hil that cur can
and Engineer
culated from th Blue and Red r were used to ca
ine(s), accordin
cording to the d stributions show midpoint of the
ssification to flip is interpr ss or out, in l’s function, s t the midpoin rs at 103.47≈ 2
n be seen in F
ring 3 (2010)
he Ct value dist respectively. Th alculate a ∆DN ng to the defini
definition of P(x
wn in Figure 1. e transition occ
coin flipping reted as the ch
a one versus shown as the nt of the misc 2950 initial co
Figure 2, the
) 459-4
tributions he Ct val-NA value
ition of n
x) given in
. A best fit curs at
ap-g. The two sid hance of bein
all sense. Fr dotted curve, classification opies of templ
ordered pair
465
JBiSE
ded nature of ng in the right rom a best-fit it is deduced transition oc-late DNA. As (3.47,25) lies 5
E
466
Copyright ©
close to the stripe, indica error, misclas
3.4. Rank O
In the first s sample mean data are stat This was the plate concen stand how few
In this sec Suppose that in a set of tub a correctly ca taining the scrambled as that the amou series. The q PCR runs are
Ct values cor
given level o is one level o closely relate
Conditione Monte-Carlo we draw k r
their sample
k-replicates. T
numerical va class labels, x
fraction of po sample mean of k. The resu
© 2010 Sci
regression li ating the con ssification and
Ordering wi
section we sum n and median C
tistically disti case using al ntration. Doub w data are req ction we imag
an investigato bes, with no er alibrated pipett dilution serie s to order, but unt of DNA w question is to e required such rrectly order, a of confidence?
of quantitation ed pre-requisite ed on our data simulation. F replicates unif
mean . Th The resulting s alues and if thi
x, we score thi
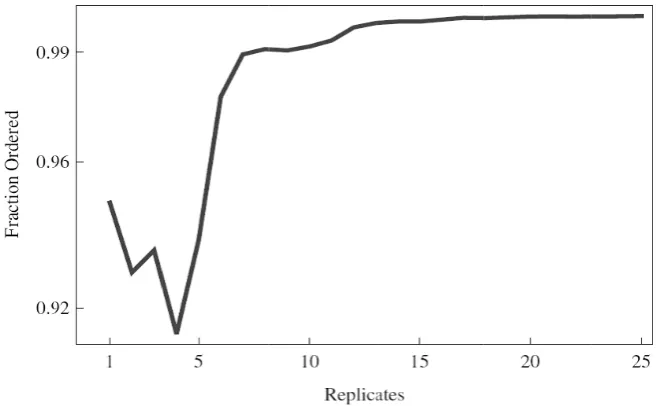
[image:8.595.134.465.484.687.2]ositive draws t ns, from a tota ults are shown
Figure 7. rank order
C. C. Stowers
Res.
ine and well cordance betw d pre-wear dat
ith Replicate
mmarized the
Ct values comp
inguishable an ll 184 replicat
tless it is of quired to make gine the follo or has produce rror other than
teman. Howev es are unlabe t not contents. within the tubes determine ho h that the resul and hence labe
We imagine n removed from
e.
we can answe From each Ct
formly at rand his mimics an set are sorted is order agrees is trial positive that resulted in l of 20,000 dr in Figures 7a
Reliability of r ring the initial t
s et al. / J. Bio
within the e ween the rela ta.
es
findings that mputed from all nd rank orde tes per initial t interest to un e this same clai owing experim ed a serial dilu n that coming f ver, the tubes c eled and bec
It is unequiv s form a mono ow many repli ltant sample m el, the tubes wi
that rank orde m inversion, b
er this question value distribu dom and com n experiment w d according to t
s with that of t e. We compute n correctly ord raws at each v and8.
replicates given template concen omedical Scien error ative t the l the ered. tem- nder-im. ment. ution from con-ome vocal otone icate mean ith a ering but a n by ution mpute with their their e the dered value F ord cop our acc whe ind 90% ure wit vio 3.5
In t vari 100 dard by mo sep con and we reve S mix mu the tion the tive as t F
n the task of ran ntrations with x
nce and Engin
Figure 7 show
der the highes pies with grea r data. The use curacy. The in en all the da dicate that 35 o
% accuracy ov
e 8 shows tha
th smaller init r of the sampl
5. End Point
the previous s iance that sho 0 initial copies d curves or cl error. As an a lecule detectio arated the ana nsider the proc d experiment a show that the eals the pattern Suppose, as b xed, aliquots
ltiwell plate a total number n limitation of expected num e statistic that the total numb
Figure 9 sho
nk ordering a dil x ≥ 104.
neering 3 (201
ws that indiv st concentratio
ater than 90% e of 8 or more nset to Figure
ata are consid or more replic ver the entire t the larger va tial template i
le over the ent
Detection
sections we h ows that below s of template D lassification vi alternative we on utilizing an alysis into two cess of plate fi
are in good ag e process of am
n of plate fillin before, that w
of a DNA so and perform 4
of wells that f the machine. mber of unamp
t has the prop ber of molecul ows the exce
lution series. Th
10) 459-469
idual data po ons from 104
% accuracy co e replicates gu
e 8 shows the
dered together cates are requi e concentratio ariance of the is responsible
tire range.
have detailed a w 104 and ce
DNA, quantita ia a Ct value i
describe a for endpoint anal o parts. In the
filling. We sho greement. In th mplification by ng.
we pipette id olution into th 40 cycles of PC amplified abo . Our data dem plified wells i perty that its e
les of DNA de llent congrue
he results for
JBiSE
oints can rank to 109 initial
onditioned on uarantees 99% e performance r. These data ired to exceed on range.
Fig-e distributions for the
beha-an beha-analysis of ertainly below ation via stan-is confounded rmat for single lysis. We have e first part we ow that theory he second part y PCR simply
Copyright
theory and e solutions of methods. Uti DNA from th ical bead cou endpoint ana pendent expe for PCR wer
C. C. Sto
© 2010 Sci
Figure results results
Figure pected buted a from th dotted
experiment for 20 micron la ilizing PCR to hose that are n unting. Figure
alysis. Each d eriment. The re determined
owers et al. /
Res.
8. Reliability for rank orderi over the entire
e 9. Agreement number of em among the well heory is shown green line. Exp
r filling of 96 atex beads as o discriminate
not, is more c
e 10 describes
data point rep concentration d through dilu
/ J. Biomedic
of replicates g ing the initial t
range of initial
t between exper mpty wells is sh ls of a 96-well p n as the solid b perimental data
6-well plates w described in e wells filled w complex than
s the results o presents an in ns of DNA pl ution as descri
cal Science a
iven the task o template distrib template DNA
rimental and th hown as a funct plate. The expe lue line, while
are shown in re
with n the with opt-of an
nde-lated
ibed
in m are rem the
4. C
Wit var
and Engineer
of rank ordering butions with x A, see Table 1.
heoretical plate tion of the tota
cted number of one standard d ed.
methods. Wh uniformly sc markably well plate filling c
CONCLUS
th a sensitive riability of re
ring 3 (2010)
g a dilution ser < 104. Inset sh
filling statistic l number of be f unfilled wells deviation is sho
hen these put caled by a fa with the theo curve.
SIONS
PCR plate rea al time PCR
) 459-4
ries. The hows the
cs. The ex-eads distri-calculated own as the
ative DNA c actor of 2.4 th ory over the en
ader we have process. We
467
JBiSE
concentrations he data agree ntire length of
examined the e have shown 7
E
s e f
468
Copyright ©
that using le template con are statistica ponding with have shown gressed over
The Ctva
copies of in independent tion. Indepen enzyme expe in the corresp
Given a st used to quan values on th concentration over the hig ing near 20%
fication analy to high. The perhaps mor ror analysis
fication ana approach to ing a standar template con cation into o We are curre A question tribution data of replicates riance of th
[image:10.595.140.458.81.297.2]
© 2010 Sci
Figure cules sp theory in
ess than a few ncentration en lly distinguish h the initial a
that the me ten orders of alue distributi itial template
statistical tec ndent data on eriences a tran ponding regio tandard curve, ntify the impa he process of n. The relative
hest initial te %. Both the re
ysis capture th misclassificat e intuitive to perhaps mor lysis suggest solving the in rd curve to co ncentration we ne of a discre ently exploring n central to th a concerns th
stems from t e distribution
C. C. Stowers
Res.
10. The numbe pread over a 38 n blue. The red
w hundred rep nsures that the
hable and ran amount of tem ean/median va
magnitude. ions appear DNA and th chniques conf
n TAQ-wear nsition of decr on.
, the Ctvalue d
act of the var predicting th e error varies emplate conce elative error a he transition f tion frequency
interpret whi re quantitative ts an alterna nverse proble onvert a Ct va
e consider pro ete number of
g this idea. he analysis of he role of repl the statistical n of sample m
s et al. / J. Bio
er of unamplifi 84 well plate. T d dots represent
plicates per in e mean Ct va
nk ordered cor mplate DNA. alues can be
noisy below he results of firm this obse indicate that reasing efficie
distributions w riability of th he initial temp
from 7% to 5 entrations ave and the miscla from low varia y is smoother le the relative e. The miscla ative clasifica
m. Instead of alue into an in babilistic clas f template clas
f the Ct value
licates. The v fact that the means is sma
omedical Scien
ied wells as a f The expected nu
experimental P
nitial alues
rres-We e
re-104 two erva-t erva-the ency were he Ct
plate 50% erag-assi- ance and e er-assi- ation f us-nitial ssifi- sses. dis-value va-aller than can cate cibi nien Ran num init data 35 reg dish lica sca trat met wel T dem tion tim DN How hun qua alte cou ana W lecu hav tha
nce and Engin
function of the umber of empt PCR endpoint d
n the variance n the data dist es are require ility? Rank or nt and meanin nk ordering si mber of replic tial template. a points provi or more repli ion for the sam heartening res ates are requir rce. For samp tions it may b
thod using th lls than to con These data, an monstrated tha n with statistic me PCR capab NA samples ra wever the dat ndreds of initi antitation. We ernative meth unting. In this alysis shows si We have des
ule counting ve demonstrat t the expecte
neering 3 (201
number of DN ty wells calcula data.
e of the data d tributions tea d in practice f rdering of the ngful device f imulations wit cates required Below the tr ide better than icates are sugg
me degree of sult for the fo red precisely ples with sma e more accura he expected n nsider replicat
nd the work at the use of cal replicates ble of quanti anging from u ta presented a
al copies real e and other gr hods for singl s regard, a p ignificant prom cribed a deco into plate fill ted through s ed number of
10) 459-469
NA mole-ated from
distributions. ach about how
for resolution e sample mean
for exploring th our data su d depends on ransition regi n 90% rank ac gested below rank accuracy ollowing reaso where the sa all initial temp
ate to conside number of (u es.
of other grou the Ct metho
renders the p itative analys upwards of 1 above show th
time PCR is roups have be le molecule d process involv
mise. omposition o
ing and ampl simulation an f (un)amplifie
JBiSE
What lessons w many repli-n arepli-nd reprodu-ns is a conve-this question. uggest that the the range of on individual ccuracy, while the transition y. But this is a on: More rep-ample may be plate concen-er an endpoint un) amplified
ups [24] have d in conjunc-process of real sis for initial 04 molecules.
hat for tens to unreliable for een exploring detection and ving endpoint
of single mo-lification. We d experiment ed wells is a
C. C. Stowers et al. / J. Biomedical Science and Engineering 3 (2010) 459-4 469
Copyright © 2010 SciRes. JBiSE
robust statistic on which to base an inverse problem or a rigorous hypothesis test to count small numbers of single molecules. The observed linear scaling between expected and perceived DNA concentration indicates that amplification by PCR is directly related to plate
filling.
It remains an open problem to determine the condi-tional probability with which PCR can amplify above threshold in 40 cycles from a single strand of DNA. While it is currently impossible to enumerate individ-ual molecules or particles smaller than a nanometer, it is straightforward to count macroscopic objects such as latex beads or single yeast cells with a Coulter counter. Haploid yeast cells provide a convenient and verifiable means to deliver single copies of Bacillus subtilis genes such as ybdO into the wells of a multi- well PCR plate.
In this way, we are currently exploring the relation-ship between amplification and DNA copy number.
5. ACKNOWLEDGEMENTS
This work was partially supported through NSF-DMS 0443855, NSF ECS 0601528, NIH EB009235, and the short-lived W. M. Keck Foun-dation Grant#062014.
REFERENCES
[1] Freeman, W., Walker, S. and Vrana, K. (1999) Quantita-tive rt-PCR: Pitfalls and potential. Biotechniques, 26, 124-125.
[2] Larionov, A., Krause, A. and Miller, W. (2005) A stan-dard curve based method for relative real time PCR data processing. BMC Bioinformatics, 6, 62.
[3] Yuan, J., Reed, A., Chen, F. and Stewart, C. (2006) Sta-tistical analysis of real-time PCR data. BMC Bioinfor-matics, 7, 85.
[4] Abramov, D., Trofimov, D. and Rebrikov, D. (2006) Accuracy of a real-time polymerase chain-reaction assay for quantitative estimation of genetically modified food sources in food products. Applied Biochemistry and Mi-crobiology, 42, 485-488.
[5] Diehl, F., Li, M., Dressman, D., Yiping, H., Shen, D., Szabo, S., Diaz, L., Goodman, S., David, K., Juhl, H., Kinzler, K. and Vogelstein, B. (2005) Detection and quantification of mutations in the plasma of patients with colorectal tumors. Proceedings of the National Academy of Sciences, 102, 16368-16373.
[6] Roussel, Y., Harris, A., Lee, M. and Wilks, M. (2007) Novel methods of quantitative real-time PCR data analy-sis in murine HelicobaCter pylori vaccine model. Vac-cine, 25, 2919-2929.
[7] Jagers, P. and Klebaner, K. (2003) Random variation and concentration effects in PCR. Journal of Theoretical Bi-ology, 224, 299-304.
[8] Lalam, N., Jacob, C. and Jagers, P. (2004) Modeling the PCR amplification process by a size-dependent
branch-ing process and estimation of the efficiency. Advanced Applied Probability, 36, 602-615.
[9] Liu, W. and Saint, D. (2002) A new quantitative method of real time reverse transcription polymerase chain tion assay based on simulation of polymerase chain reac-tion kinetics. Analytical Biochemistry, 302, 52-59. [10] Nedelman, J., Haegerty, P. and Lawrence, C. (1992)
Quantitative PCR: Procedures and precision. Bulletin of Mathematical Biology, 54, 477-502.
[11] Vaerman, J., Saussoy, P. and Inargiola, I. (2004) Evalua-tion of real-time PCR data. Journal of Biological Regu-lators and Homeostatic Agents. 18, 212-214.
[12] Pfaffl, M. (2001) A new mathematical model for relative quantification in real-time PCR. Nucleic Acid Research, 29, e00.
[13] DeGroot, M.H. (1986) Probability and statistics. 2nd Edition, Addison Wesley Reading MA,Massachusetts. [14] Cady, N., Stelick, S., Kunnavakkam, M., Lui, Y. and
Batt, C. (2004) A microchip-based DNA purification and real-time PCR biosensor for bacterial detection. Pro-ceedings of IEEE Sensors,Vienna, 1191-1194.
[15] Matsubara, Y., Kerman, K., Kobayashi, M., Yamamura, S., Morita, Y. and Tamiya, E. (2004) Microchamber assay based DNA quantification and specific sequence detection from a single copy via PCR in nanoliter vo-lumes. Journal of Biosensors and Electronics, 20, 1482-1490.
[16] Mitra, R. and Church, G. (1999) In situ localized amplification and contact replication of many individual DNA molecules. Nucleic Acids Research, 27, e34. [17] Samatov, T., Chetverina, H. and Chetverin, A. (2006)
Real-time monitoring of DNA colonies growing in a po-lyacrylamide gel. Analytical Biochemistry, 356, 300-302. [18] Williams, R., Peisajovish, S., Miller, O., Magdassi, S.,
Tawfik, D. and Griths, A. (2006) Amplification of com-plex gene libraries by emulsion PCR. Nature Methods, 3, 545-550.
[19] Karsai, A., Muller, S., Platz, S. and Hauser, T. (2002) Evaluation of a home-made SYBR Green 1 reaction mixture for real-time PCR quantification of gene expres-sion. Biotechniques-Short Technical Reports, 32, 790- 796.
[20] Neubert, K. and Brunner, E. (2007) A studentized per-mutation test for the non-parametric Behrens-Fisher problem. Computational Statistics & Data Analysis, 51, 5192-5204.
[21] Reiczigel, J., Zakarias, I. and Rozsa, L. (2005) A boot-strap test of stochastic equality of two populations.
American Statistical Association, 59, 156-161.
[22] Wilcox, R.R. (2006) Comparing medians. Computational Statistics & Data Analysis, 51, 1934-1943.
[23] Stowers, C. and Boczko, E.M. (2008) Platescale: The birthday problem applied to single molecule PCR. Bio-comp’08, Las Vegas. http://www.ucmss.com/cr/main/
papersNew/papersAll/BIC9135.pdf