Study on Direct Flame Solid Oxide Fuel Cell Using Flat Burner and Ethylene Flame
M. M. Hossaina, J. Myungb, R. Lana, M. Cassidyb, I. Burnsa, S.W. Taoa and J. T. S. Irvineb
a
Department of Chemical and Process Engineering University of Strathclyde, G1 1XJ, Glasgow, UK
b
School of Chemistry, University of St. Andrews, Fife KY16 9ST, St. Andrews, UK
This paper presents an experimental investigation of direct flame solid oxide fuel cell (SOFC) by using a flat-flame burner and fuel-rich ethylene/air premixed flames. A direct flame fuel cell (DFFC) setup is designed and implemented to measure electrochemical characteristics of electrolyte supported (i.e., single cell consisting of Ce0.9Ni0.1O2-δ anode/GDC electrolyte/LSCF-GDC cathode) fuel
cell. The fuel cell temperature and cell performance were investigated by operating various fuel/air equivalence ratios and varying distance between burner surface and the fuel cell. A maximum power density of 41 mW/cm2 and current density of 121 mA/cm2 were achieved. Experimental results suggest that the fuel cell performance was greatly influenced by the flame operating conditions and cell position in the flame. The uniformity of the flame temperature and the fuel cell stability were also investigated and calculations of equilibrium gas species composition were performed.
Introduction
Solid-oxide fuel cells (SOFCs) have received significant attention due to their high efficiency, flexible fuel selection and low emissions in exhaust gases, and relatively low cost. The SOFCs are electrochemical devices to converting chemical energy into electricity at high efficiency (1-3). Unlike lower temperature fuel cells, any carbon monoxide (CO) formed is transformed to carbon dioxide (CO2) at the high operating
temperature, and so hydrocarbon fuels can be used directly through internal reforming or even direct oxidation. For instance, various gases (such as methane, propane, ethane and butane), liquid (ethanol, butanol and kerosene) and solid (paraffin wax and wood) fuels (4-6) are widely used in SOFCs for electrochemical power generation. Conventional SOFCs are also excellent devices for efficient power generation. However, they are facing various challenges to overcome high cost, durability problems related to materials degradation.
rapid start-up and shut-down, requires no external heater, and is suitable for portable applications. The performance of the DFFC is still relatively poor, which hinders its practical applications.
Several studies have been carried out to investigate micro-stack DFFCs of liquefied petroleum gas (LPG) flame (9), multi-element diffusion flame burners (3), thermal shock resistance and failure probability of electrolyte supported DFFC (10), carbon deposition of coking-free direct-methanol flame fuel cell (11) and clustered diffusion micro-flames DFFC (12). Modeling and simulation techniques were also studied to identify and reduce the efficiency losses and improving the DFFC performance (13). Despite various studies in DFFCs, a range of technical challenges still remain to be resolved. In particular, suitable operating conditions (e.g., fuel flow rate, gas velocity, fuel/air mixing ratio, uniform temperature distribution and gas species composition), operational stability (e.g., time dependence temperature and voltage), cell positioning, safety operations, selection of electrode materials and optimum cell performance. Therefore, more investigations of the DFFC will be required to meet these challenges and also design a DFFC system for practical applications and optimizing the fuel cell performance.
In this study, a systematic experimental investigation of the DFFC operating conditions and the fuel cell performance operated on fuel-rich ethylene/air flames was carried out with a flat-flame burner together with stainless steel stabilization plate in order to maintain homogenous gas velocity over the burner surface and stability of the flame. The homogenous gas velocity and the stability of the flame are the key advantages of this DFFC setup compared to Bunsen-type burner (4,6,14). The Bunsen-type burners typically provide cone-shaped flame, therefore the flame temperature and gas composition across the DFFCs are not uniform. The homogenous gas outflow and the flame stability are significant aspects for the DFFC performance and provide a robust test-bed for laboratory investigation of direct flame fuel cells. In addition, the reliability of the DFFC depends on the flame structure, particularly in uniform flame temperature distribution, where non-uniform temperature distribution could increase the probability of cell failure due to thermal stress (3). In the remainder of this paper we describe experiments performed to study the influence of different operating conditions such as fuel/air equivalence ratio, distance between the burner surface and fuel cell, flame temperature and gas composition on the DFFC performance and discuss the results obtained.
Experimental
Fuel Cell Configuration
The electrolyte supported single cell consisting of Ce0.9Ni0.1O2-δ anode/GDC
electrolyte/La0.6Sr0.4Co0.2Fe0.8 (LSCF)-GDC cathode was employed to measure their electrochemical activity via a direct frame of ethylene gas. The GDC powder was pressed into pellets and fired in air at 1500oC for 12 hours to obtain a dense support. The Ce0.9Ni0.1O2-δwas synthesized as a following method; Ce(NO3)3•6H2O (99.9%,
Sigma-Aldrich Co. LLC, UK) and Ni(NO3)2•6H2O (99%, Alfa Aesar, USA) nitrate precursors
The screen printing inks of anode and cathode were prepared by using planetary ball
milling in α-terpineol with 10 wt% of Hypermer KD1 dispersant (Uniqema). After this step, it added an ink vehicle consisting of 15 wt% PVB (polyvinyl butyral, Butvar, Sigma-Aldrich) in α-terpineol. This mixture was mixed by planetary ball milling again. The anode ink was screen-printed onto a dense GDC support (300 µm) with thickness of 50 µm and fired at 1300oC for 3 hours. LSCF-GDC cathodes were prepared with above method and fired at 1000oC for 2 hours. In these button cells, both anode and cathode had a surface area of 1 cm2. It should be noted that reduction process is not required before the cell testing because it is an oxide anode. It is one of the advantages of this fuel cell compared to NiO cermet anode fuel cells.
Experimental Setup
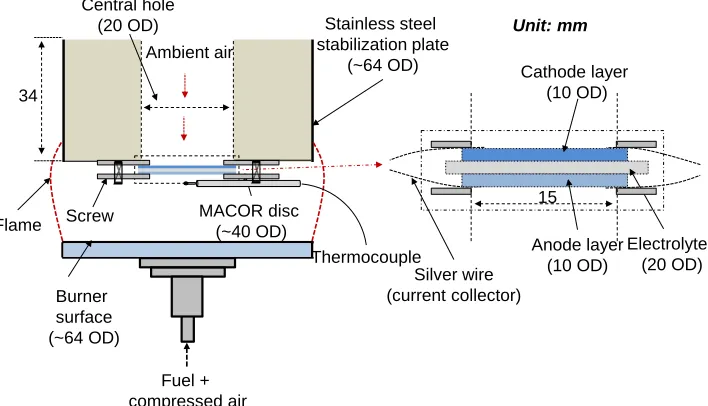
[image:3.612.131.485.440.643.2]A flat-flame burner (64 mm outer diameter) along with stainless steel stabilization plate (64 mm outer diameter and 34 mm length) was used in study. This burner consists of a brass plate drilled with capillary holes. The advantages of using this burner are firstly, it provides homogenous gas outflow velocity over the whole surface area of the burner and secondly uniform temperature distribution in radial directions. Temperature and gas species concentrations vary only in the axial direction (5). The burner was mounted to a height-adjusted stage with sub-mm resolution that allowed conducting experiments with variable distances (d) between the burner surface and the SOFC. A circulating cooling water system was used to cool the burner. The burner is larger than the SOFC in order to provide homogenous temperature and gas concentrations over the complete surface area of the SOFC. The stainless steel stabilization plate was placed above the burner surface and is used to stabilize the flame, as well as to mount the fuel cell. A central hole of 20 mm diameter was created in the stabilization plate for flowing ambient air to cathode surface. Figure 1 shows the schematic of the DFFC setup.
Figure 1. Schematic of experimental setup for DFFC.
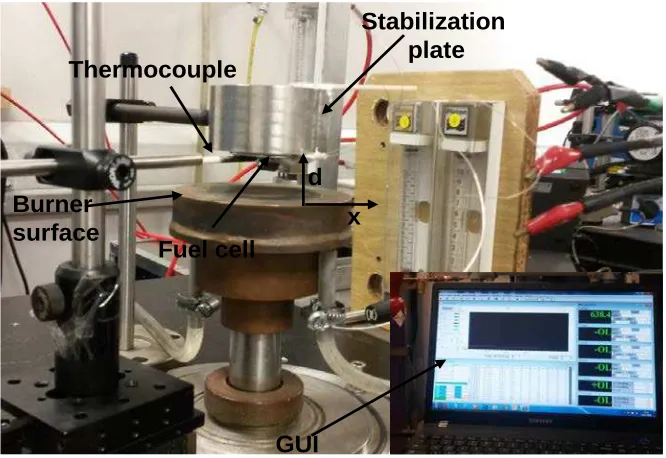
The physical implementation of the DFFC setup is shown in Fig. 2. Two MACOR ceramic washers (central hole of 15 mm, 40 mm outer diameter and 1 mm thickness) were used as holder for the SOFC. This setup provides completely gas-sealed and avoids diffuse of anode gas into the cathode surface. The fuel cell together with the ceramic
MACOR disc (~40 OD)
Stainless steel stabilization plate
(~64 OD) Central hole
(20 OD)
Screw
Burner surface (~64 OD)
Fuel + compressed air
Thermocouple Flame
34
Ambient air
Cathode layer (10 OD)
Anode layer (10 OD)
Electrolyte (20 OD) Silver wire
(current collector) 15
washers were attached to the steel plate using stainless steel screws in such a way that the anode surface was facing the flame and the cathode surface was exposed to ambient air. The fuel and air flow rates were regulated by rotameters. The DFFC was operated with fuel-rich (φ > 1.10) ethylene/air premixed flames under different operating conditions. Silver wires were used as current collectors to both sides of the fuel cells. Table I shows the experimental conditions for the DFFC operations.
Figure 2. Physical implementation of the DFFC setup.
TABLE I. Experimental Conditions for DFFC Operations*.
Equivalence Ratio (φ)
Air Flow Rate (l/min)
C2H4 Flow Rate
(l/min)
Total Flow Rate (l/min)
1.16 11.10 0.90
1.23 11.05 0.95
1.37 10.95 1.05 12.00
1.45 10.90 1.10
1.52 10.85 1.15
1.60 10.80 1.20
*All flow rates are defined at 1 bar and 25°C.
Cell Characterization
The temperature of the flame and the fuel cell were measured by a fine-wire R-type thermocouple with bead diameter 0.5 mm (Omega P13R-020-8) at different equivalence ratios and distances between the burner surface and the fuel cell. The thermocouple was located ~2 mm below the anode surface. A Nikon D3100 Digital SLR (single-lens reflex) camera was used to capture the flame images. The SI1287A Electrochemical Interface was used to characterize the current-voltage (I-V), open circuit voltage (OCV) and electrochemical impedance of the fuel cell under the different equivalence ratios. The adiabatic flame temperature and equilibrium gas species composition were calculated with the aid of Cantera thermodynamic simulation software package (15).
Stabilization plate
Burner surface
Thermocouple
GUI d
[image:4.612.126.488.437.532.2]Results and Discussion
Flame Temperature and Gas Composition
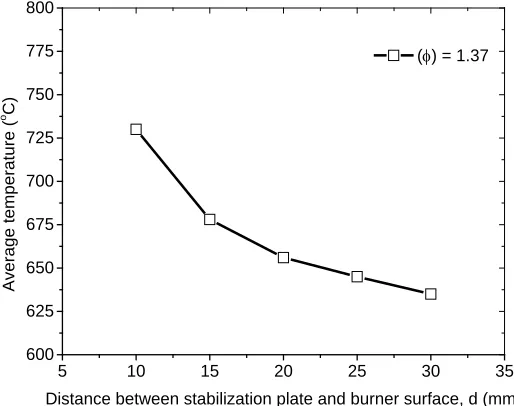
In order to investigate the suitable temperature range for the fuel cell, the flame temperature was measured at various equivalence ratios with fixed fuel flow rate (12 l/min) and at various distances between the burner surface and the stabilization plate. Figure 3 shows the temperature of ethylene/air flames for various distances between the burner surface and the plate with fixed φ = 1.37. It has been observed that the temperature of the flame is affected by the separation distance. The measured temperature was found to be within the range of 628 - 730°C for the distances of 10-30 mm between the burner and the stabilization plate. Such a temperature range is ideal for operating the DFFC at these conditions. It was also observed that the temperature decreased with increasing the distances. More soot was formed in the inner flame for larger separation between the burner and stabilization plate, as shown in Fig. 4, which is a further consequence of the lower temperature. The flame temperature for φ = 1.1 - 1.6 at d = 20 mm, is shown in Fig. 5. As can be seen that the temperature increased up to φ = 1.52 and decreased hereafter. The average temperature for φ = 1.52 is about 20°C higher than that for φ = 1.1 and φ = 1.6.
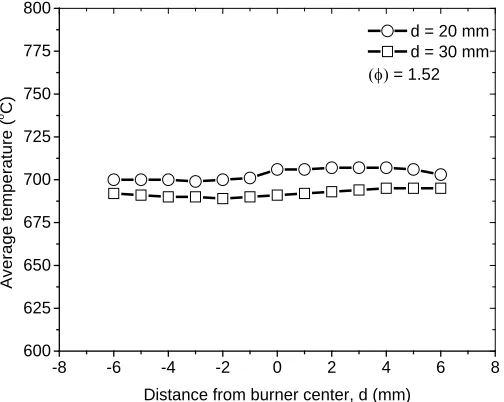
Figure 6 illustrates the temperature profiles of ethylene/air flames for various radical distances i.e., distances from the burner center at d = 20 mm and 30 mm, and φ = 1.52. Radially uniform temperature profiles were observed and standard deviation of 3.5 °C was found at d = 20 mm. The measurements demonstrate that the designed DFFC setup has the ability to provide uniform temperature profiles for the SOFC operation, which means that the DFFC setup can be subject to low thermal stress during operation (3). It is worth mentioning that there are some systematic errors involved in the thermocouple measurement due to the radiation heat loss of medium to the surroundings and the conduction heat loss of the thermocouple bead. Although a radiation correction has been performed, there is still some uncertainty in the absolute values, as is generally the case with thermocouple measurement of flame temperature.
5 10 15 20 25 30 35
600 625 650 675 700 725 750 775 800
(φ) = 1.37
A
verage t
em
perat
ure (
o C)
Distance between stabilization plate and burner surface, d (mm)
[image:5.612.170.427.499.702.2]Figure 4. Flame images captured at various distances between burner surface and stabilization plate for (a) φ = 1.16 and (b) φ = 1.52.
1.0 1.1 1.2 1.3 1.4 1.5 1.6 1.7 600
625 650 675 700 725 750 775 800
d = 20 mm
A
verage t
em
perat
ure (
°
C)
Equivalence ratio (φ)
Figure 5. Temperature of ethylene/air flames for different equivalence ratios at separation of 20 mm between the burner surface and the stabilization plate.
-8 -6 -4 -2 0 2 4 6 8
600 625 650 675 700 725 750 775 800
d = 20 mm d = 30 mm
(φ) = 1.52
A
verage t
em
perat
ure (
o C)
Distance from burner center, d (mm)
Figure 6. Radial temperature of ethylene/air flame at various radial distances from burner center (at d = 20 mm, d = 30 mm and φ =1.52).
d = 15 mm d = 20 mm d = 25 mm d = 30 mm
a
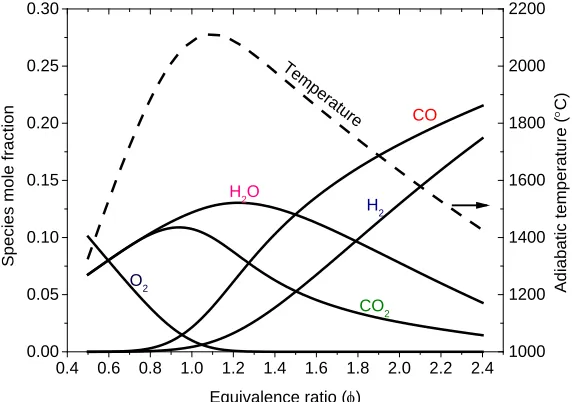
[image:6.612.144.470.55.207.2] [image:6.612.170.429.254.456.2] [image:6.612.173.425.497.698.2]Flame simulations and modeling were studied by Horiuchi and Kronemayer et al. (5,13,16) to calculate equilibrium gas compositions and adiabatic flame temperature of methane/air flames using Cantera thermodynamic simulation software (15). A similar approach was followed in this study to calculate the equilibrium gas compositions and adiabatic flame temperature of ethylene/air flames for φ = 0.5 – 2.4, and to identify the fuel species available for the SOFC in the combustion product mixture. Figure 7 shows the simulated results of equilibrium calculations of species concentration and adiabatic temperature for different equivalence ratios. As can be seen, the concentrations of both H2 and CO increase with increasing the equivalence ratios. It is believed that the H2 and
CO are the dominant chemical compounds at the SOFC anode surface to be converted into electricity. The fuel cell performance is closely linked to the increased concentration of these species with increasing the equivalence ratios (5) [refer to Figs. 9 and 10]. Higher H2 and CO concentration can be obtained by operating under fuel-rich conditions,
preferably at φ ≥ 1.5 for ethylene as shown in Figure 7. In contrast, the H2 and CO
concentrations are very low for the stoichiometric condition (φ = 1) and no H2 and CO
are present for lean conditions (φ <1). The adiabatic flame temperature gradually deceases towards the flame rich (φ> 1) and lean conditions and the highest temperature is observed roughly at the stoichiometric condition.
Results obtained from the simulations confirm that flame decreases with increasing the H2 and CO concentration in fuel-rich conditions. On the other hand, the flame
temperature is also a prominent parameter for the fuel cell performance and thus appropriate operating conditions must be chosen to achieve optimum fuel cell performance.
0.4 0.6 0.8 1.0 1.2 1.4 1.6 1.8 2.0 2.2 2.4 0.00
0.05 0.10 0.15 0.20 0.25 0.30
S
peci
es m
ol
e f
ract
ion
Equivalence ratio (φ)
Tem perat
ure
1000 1200 1400 1600 1800 2000 2200
A
di
abat
ic t
em
perat
ure (
°
C)
H2
O2
H2O
CO
CO2
Figure 7. Simulation results of ethylene/air gas species concentrations at equilibrium for φ = 0.5 -2.4.
Fuel Cell Performance
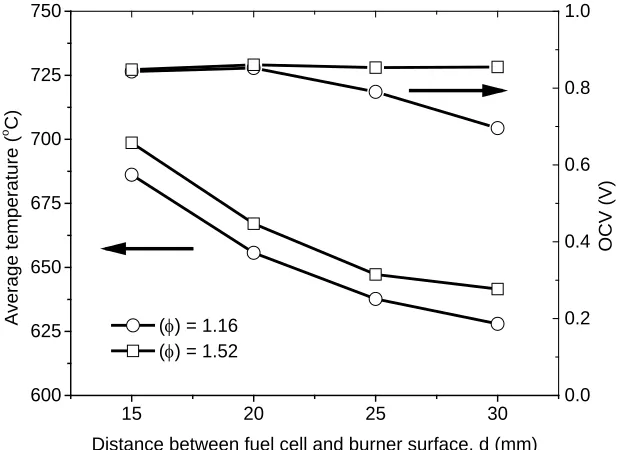
[image:7.612.169.455.400.601.2]highest cell temperature was observed for φ = 1.52 and d = 15 mm. The OCV is invariant with burner–fuel-cell separation for the richer flame, but the OCV decreases with increasing separation in the less rich flame. This is presumably due to the lower temperature and/or the lower CO and H2 mole fractions in the burnt gases of the φ = 1.16
flame. The results thus indicate that the positioning of the fuel cell with respect to the flame has a significant effect on the cell temperature and the performance.
15 20 25 30
600 625 650 675 700 725 750
(φ) = 1.16
(φ) = 1.52
A
verage t
em
perat
ure (
o C)
Distance between fuel cell and burner surface, d (mm) 0.0 0.2 0.4 0.6 0.8 1.0
O
C
V (
V)
Figure 8. Relationship between OCV and cell temperature at various distances between burner surface and fuel cell.
Figure 9 shows the polarization and power density curves of the fuel cell for φ = 1.16 and φ = 1.52 and d = 15 mm. As can be found, the performance of the DFFC is greatly dependent on temperature and equivalence ratio, where higher cell performance was achieved for the fuel-rich flames. The correlation between the maximum current, the power density and the equivalence ratio is shown in Fig. 10, for d = 15-30 mm. Higher power and current densities were obtained by increasing the equivalence ratio. As clearly seen, increasing the equivalence ratio causes an increase the species concentration of H2
and CO, thus increasing the fuel cell performance (16). The fuel cell achieved a maximum power density of 41 mW/cm2 and a maximum current density of 121 mA/cm2 with φ = 1.52 at cell temperature 700°C. The improved performance at φ = 1.52 is thought to be principally due to the increased CO and H2 mole fractions near the anode
surface, but the slightly increased anode temperature may also play a role by reducing the resistance of the DFFC.
[image:8.612.155.464.156.381.2]0 20 40 60 80 100 120 140 0.0 0.2 0.4 0.6 0.8 1.0 V ol tage (V )
Current density (mA/cm2)
0 10 20 30 40 50 (φ) = 1.52 (699 °C) (φ) = 1.16 (686 °C) d = 15 mm
P ow er densi ty (m W /cm 2 )
Figure 9. Polarization and power density curves for φ = 1.16 and φ = 1.52 and at d = 15 mm.
15 20 25 30
0 20 40 60 80 100 120
I (φ) = 1.16) I (φ) = 1.52)
M axi m um current densi ty (m A /cm 2 )
Distance between burner surface and fuel cell, d (mm) 0 10 20 30 40 50 60 P (φ) = 1.16) P (φ) = 1.52)
M axi m um pow er densi ty (m W /cm 2 )
Figure 10. Correlation between maximum current density and power density at d = 15-30 mm and φ = 1.16 and 1.52.
0 5 10 15 20 25 30 35 40
0.856 0.857 0.858 0.859 0.860
d = 30 mm (631°C) φ = 1.52
V
ol
tage (V
)
Time (min)
[image:9.612.179.444.52.252.2] [image:9.612.173.445.291.487.2] [image:9.612.132.453.502.716.2]Conclusions
This work presented an experimental investigation of a direct flame solid-oxide fuel cell (SOFC) by using flat-flame burner and fuel-rich ethylene/air premixed flames. The flame operating conditions such as equivalence ratio and distance between burner surface and fuel cell were shown to affect the temperature of the fuel cell and the gas composition at the anode, thus determining the DFFC performance. A maximum power density of 41 mW/cm2 was achieved by operating ethylene/air flame for the GDC-electrolyte supported cell. Experimental results obtained from this investigation clearly demonstrated that the DFFC setup employed was able to provide uniform temperature distribution and showed good stability for the SOFC operation. Flame simulation results also suggested that H2 and CO are the dominant gas species concentrations for the SOFC
anode surface and is likely to be connected to the cell performance. In near future different hydrocarbon fuels (e.g., methane and propane) and fuel cell configurations can be used for the further investigations over a range of operating conditions. Different measurement techniques and multi-SOFCs setup will also be considered.
Acknowledgements
The authors thank EPSRC SuperGen Hydrogen Fuel Cells Challenges Flame SOFC Project (Grant No EP/K021036/1) for funding. We are grateful to Mr. James Murphy for helping with the DFFC setup.
References
1. P. I. Cowin, C. T. G. Petit, R. Lan, J. T. S. Irvine and S. Tao, Adv. Energy Mater., 1, 314 (2011).
2. S. Sengodan, S. Choi, A. Jun, T. H. Shin, Y.-W. Ju, H. Y. Jeong, J. Shin, J. T. S. Irvine and G. Kim, Nat. Mater., 14, 205 (2015).
3. Y. Q. Wang, Y. X. Shi, X. K. Yu, N. S. Cai and S. Q. Li, J. Electrochem. Soc., 160, F1241 (2013).
4. M. Horiuchi, S. Suganuma and M. Watanabe J. Electrochem. Soc., 151, A1402 (2004).
5. H. Kronemayer, D. Barzan, M. Horiuchi, S. Suganuma, Y. Tokutake, C. Schulz and W. G. Bessler, J. Power Sources, 166, 120 (2007).
6. H. Kim, S. Park, J. M. Vohs and R. J. Gorte, J. Electrochem. Soc., 148, A693 (2001).
7. Y. Tian, Z. Lü, Y. Zhang, B. Wei, M. Liu, X. Huang and W. Su, Fuel Cells, 12, 4 (2012).
8. M. Kuhn and T. Napporn, Energies, 3, 57 (2010).
9. X. Zhu, B. Wei, Z. Lü, L. Yang, X. Huang, Y. Zhang and M. Liu, Int. J. Hydrogen Energy, 37, 8621 (2012).
10.Y. Wang, Y. Shi, X. Yu and N. Cai, J. Power Sources, 255, 377 (2014).
11.L. Sun, Y. Hao, C. Zhang, R. Ran and Z. Shao, Int. J. Hydrogen Energy, 35, 7971 (2010).
12.T. Hirasawa and S. Kato, J. Physics: Conf. Series, 557, 012120 (2014).
14.K. Wang, R. J. Milcarek, P. Zeng and J. Ahn, Int. J. Hydrogen Energy, 40, 4659 (2015).
15.D. G. Goodwin, Cantera, http://www.cantera.org, in (2005).