Cite this:Phys. Chem. Chem. Phys.,
2015,17, 9049
New insights into phase distribution, phase
composition and disorder in Y
2
(Zr,Sn)
2
O
7
ceramics
from NMR spectroscopy
†
Sharon E. Ashbrook,*aMartin R. Mitchell,aScott Sneddon,aRobert F. Moran,a Massey de los Reyes,bGregory R. Lumpkinb and Karl R. Whittlec
A combination of89Y and119Sn NMR spectroscopy and DFT calculations are used to investigate phase
evolution, local structure and disorder in Y2Zr2xSnxO7ceramics, where a phase change is predicted,
from pyrochlore to defect fluorite, with increasing Zr content. The ability of NMR to effectively probe materials that exhibit positional and compositional disorder provides insight into the atomic-scale structure in both ordered and disordered phases and, by exploiting the quantitative nature of the technique, we are able to determine detailed information on the composition of the phase(s) present and the average coordination number (and next-nearest neighbour environment) of the cations. In contrast to previous studies, a more complex picture of the phase variation with composition emerges, with single-phase pyrochlore found only for the Sn end member, and a single defect fluorite phase only forx= 0 to 0.6. A broad two-phase region is observed, fromx= 1.8 to 0.8, but the two phases present have very different composition, with a maximum of 13% Zr incorporated into the pyrochlore phase, whereas the composition of the defect fluorite phase varies throughout. Preferential ordering of the anion vacancies in the defect fluorite phase is observed, with Sn only ever found in a six-coordinate environment, while remaining vacancies are shown to be more likely to be associated with Zr than Y. Our findings are then discussed in the light of those from previous studies, many of which utilize diffraction-based approaches, where, in most cases, a single phase of fixed composition has been assumed for the refinement procedure. The significant and surprising differences encountered demonstrate the need for complementary approaches to be considered for a detailed and accurate picture of both the long- and short-range structure of a solid to be achieved.
Introduction
The crystal chemical flexibility of pyrochlore and fluorite-based oxide materials has resulted in a wide range of applications, including energy materials, waste encapsulation and catalysis.1–5 There is, therefore, considerable interest in understanding the structure–property relationships in these materials,i.e., investigating how phase evolution, cation/anion disorder and local structure vary with composition, and how this subsequently affects the physical
and chemical properties and, ultimately, the potential end applications, of such systems. Much of the previous work in this area has focussed on the use of diffraction-based techniques. While these have much to offer for more ordered systems, the detailed investigation of disordered materials using these methods is challenging, with information typically obtained only on an ‘‘average’’ structure. In contrast, spectroscopic methods are often more sensitive to the atomic-scale environment, providing a more detailed understanding of the local structure.
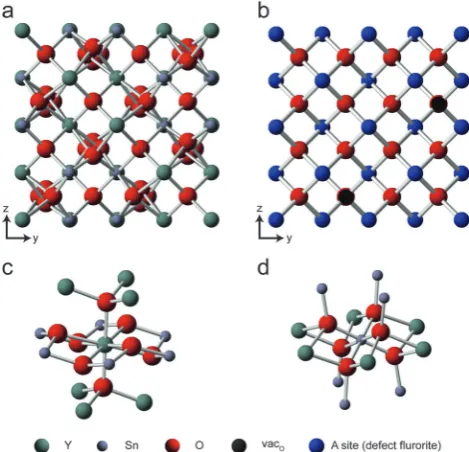
Pyrochlores have the general formula A2B2O7, adopting Fd3%msymmetry, and are an ordered superstructure of fluorite (AO2), with the ordered removal of 1/8 of the oxygen atoms, and
an ordered cation arrangement, as shown in Fig. 1(a).6,7 The
cation superstructure of pyrochlore is based upon ordering of A and B cations parallel to theh110idirection, separated with respect to the origin by (1/2, 1/2, 1/2). Using Wyckoff notation, for origin choice 2 and placing A at the origin, these are located on the 16c (0, 0, 0) and 16d (1/2, 1/2, 1/2), atomic positions, respectively. The A cation adopts a distorted cubic coordination
a
School of Chemistry, EaStCHEM and Centre of Magnetic Resonance, University of St Andrews, St Andrews, KY16 9ST, UK. E-mail: [email protected]
bInstiute of Materials Engineering, Australian Nuclear Science and Technology
Organisation, Lucas Heights, Sydney, NSW, Australia
cDepartment of Materials Science and Engineering, The University of Sheffield,
Mappin Street, Sheffield, S1 3JD, UK
†Electronic supplementary information (ESI) available: Further information on the DFT calculations, the analysis of the89Y MAS NMR spectra, the predicted spectral intensities using a binomial distribution and the analytical fitting of the 119Sn MAS NMR spectrum of Y2Zr0.2Sn1.8O7. See DOI: 10.1039/c4cp05827e
Received 12th December 2014, Accepted 27th February 2015
DOI: 10.1039/c4cp05827e
www.rsc.org/pccp
PAPER
Open Access Article. Published on 02 March 2015. Downloaded on 04/06/2015 17:05:03.
This article is licensed under a
Creative Commons Attribution 3.0 Unported Licence.
with oxygen (scalenohedron), while B is octahedrally coordinated, as shown in Fig. 1. There are three crystallographically-distinct anion sites in the pyrochlore lattice, two of these are the occupied 48f (x48f, 1/8, 1/8) and 8a (1/8, 1/8, 1/8), respectively. The third
potential oxygen site 8b (3/8, 3/8, 3/8) is normally vacant.8–10Thus, the structure of any ideal pyrochlore can be described by just two parameters,x48fand the unit cell parameter,a. The
substitu-tion of different casubstitu-tions can significantly affect the properties of a pyrochlore material, increasing its ionic conductivity, chemical durability or, in the context of waste encapsulation, changing its resistance to damage by radioactive decay. Many different substitu-tions (and coupled substitusubstitu-tions) are possible, providing materials with a wide range of variable properties. However, substitution can bring about a change of structure, as the pyrochlore structure is expected to be stable when the relative ratio of the cations,rA/rB, is
between 1.46 and 1.78.6,11,12 When the ratio falls below this, a defect fluorite structure (space groupFm%3m) is formed, exhibiting, as shown in Fig. 1(b), a random distribution both of cations and oxygen vacancies in the structure. This results in an average cation coordination number of 7. The possibility of this structural change with increasing substitution raises a number of pertinent ques-tions, including whether a true ‘‘solid solution’’ is formed or a two-phase field is present and, if the latter is the case, if the composi-tions of the two phases are identical or not. An understanding of the cation ordering (be it in the pyrochlore or defect fluorite phases) and the (average) coordination numbers is also desirable if the properties of materials are to be understood.
The insight into local structure afforded by Nuclear Magnetic Resonance (NMR) spectroscopy is ideal for investigating disordered
materials, and for providing complementary detail to the picture of the average structure obtained from diffraction. The chemical shift interaction is typically very sensitive to the coordination number, the nature of the next-nearest neighbour (NNN) environment and the local geometry.13,14Although a rich source
of information, the complex spectra that result (particularly when more than one crystallographically-distinct species is present) are difficult to interpret, and in recent years there has been increasing interest in the use of density functional theory (DFT) calculations alongside experimental work.15–17 The use of codes that exploit the inherent periodicity and translational symmetry of the solid state avoid the need to model a solid as a ‘‘cluster’’, breaking bonds and perturbing the local environment (and, consequently, varying the calculated NMR parameters).18,19 The combination of NMR experiments and DFT calculations was recently used to great effect to provide detailed information on cation ordering in the Y2(Ti,Sn)2O7
pyrochlore solid solution.20–23 The 89Y chemical shift and chemical shift anisotropy were both shown to be sufficiently sensitive to determine the number of Sn and/or Ti B site NNN, although, rather surprisingly, the corresponding 119Sn NMR
spectra did not enable this information to be extracted easily, with broader, overlapped lineshapes observed. From the relative amounts of each type of Y species it was possible to demonstrate that (i) there was no mixing of cations between A and B sites and (ii) that Sn and Ti were randomly distributed on the B site, with no evidence for any clustering or ordering.21,23
In this work, we use a combination of89Y and119Sn NMR spectroscopy and DFT calculations to investigate the phase evolution, local structure and disorder in Y2(Zr,Sn)2O7
cera-mics, where a phase change is predicted, from pyrochlore to defect fluorite, with increasing Zr content. The ability of NMR to effectively probe materials that lack long-range order enables us to demonstrate evidence for a much wider two-phase region than previously postulated, and by exploiting the quantitative nature of the technique we are able to determine the composi-tion of the phase(s) present and the average coordinacomposi-tion number (and NNN environment) of the cations. Our findings are then discussed in the light of those from previous work (much utilizing diffraction-based approaches), with the differ-ences encountered demonstrating the need for complementary approaches to be considered if a detailed and accurate picture of the long- and short-range structure of a disordered solid is to be achieved.
Experimental and computational
methods
Synthesis
Ceramic oxides with composition Y2Zr2xSnxO7(x= 0.0 to 2.0)
were synthesised by a conventional mixed metal-oxide process. Stoichiometric quantities of commercially available Y2O3, SnO2
and ZrO2 (Aldrich, 99.5%) were heated to 850 1C for 10 h
followed by ball milling, using ZrO2balls and cyclohexane as
the milling medium. After drying, the resultant powders were
Fig. 1 Structure of (a) Y2Sn2O7pyrochlore and (b) a typical defect fluorite
material. Green, small blue and red spheres denote Y (i.e., A site), Sn (i.e., B site) and O atoms, respectively. In (b), O vacancies are denoted by a black sphere, while the large blue sphere denotes the (single) cation site. Also shown are expansions of the nearest and next-nearest neighbour envir-onments for the (c) eight-coordinated A site and (d) six-coordinated B site in the pyrochlore phase.
Open Access Article. Published on 02 March 2015. Downloaded on 04/06/2015 17:05:03.
This article is licensed under a
[image:2.595.49.284.50.276.2]pressed into pellets using a uniaxial press. Samples were then heated to 1500 1C in air at a rate of 5 1C min1 for 168 h
followed by cooling in the furnace atB201C min1. Further
details of the synthesis and subsequent characterization by diffraction can be found in ref. 24.
NMR spectroscopy
NMR spectra were acquired using a Bruker Avance III 600 MHz spectrometer, equipped with a 14.1 T widebore magnet operating at Larmor frequencies of 223.8 MHz for119Sn and 29.408 MHz for89Y. As described in ref. 24, for 119Sn, powdered samples were packed into a 3.2 mm ZrO2rotor that was rotated at a rate
of 20 kHz, using a conventional 3.2 mm HX probe. Spectra were acquired using a spin echo pulse sequence, with a radio-frequency field strength of 114 kHz (p/2 = 2.2ms) and a recycle interval of 30 s, and are the result of averaging between 48 and 1280 transients. For89Y, powdered samples were packed into a 4.0 mm Si3N4rotor to avoid any potential background signal,
and rotated at a rate of 14 kHz, using a 4 mm HX low-gprobe. Spectra were acquired using a radiofrequency field strength of
B23 kHz (p/2E11.0ms) and a recycle interval of 100–300 s, and are the result of averaging between 36 and 750 transients. AlthoughT1 is relatively long for all 89Y resonances, there is
little difference in relative relaxation rates, and relative spectral intensities accurately reflect the relative site populations even at shorter recycle intervals. MAS spectra were acquired using either a spin echo (to ensure accurate acquisition of the broad components) or using a Carr–Purcell–Meiboom–Gill (CPMG)25,26 echo train to increase sensitivity. In the latter case, 600–1000 echoes were typically acquired, with a frequency-domain spikelet spacing of 167 Hz. Chemical shifts are shown (in ppm) relative to (CH3)4Sn for119Sn and 1 M YCl3for89Y (measured using secondary
references of SnO2(d=604.3 ppm) and Y2Ti2O7(d=65 ppm,
respectively)).14 The integrated intensities of the spectral
reso-nances were determined using dmfit.27
Calculations
Calculation of total energies and NMR parameters was carried out using the CASTEP DFT code (version 4.1),18employing the gauge-including projector augmented wave (GIPAW) approach28 to reconstruct the all-electron wavefunction in the presence of a magnetic field. Calculations were performed using the GGA PBE functional29 and core–valence interactions were described by ultrasoft pseudopotentials.30A planewave energy cutoff of 50 Ry (B680 eV) was used, and integrals over the first Brillouin zone were performed using a Monkhorst–Pack grid with a k-point spacing of 0.05 Å1. All calculations were converged as far as possible with respect to bothk-point spacing and energy cutoff. Geometry optimisations of atomic coordinates and unit cell parameters were carried out in all cases, before the calculation of NMR parameters. Calculations were performed on a cluster at the University of St Andrews, consisting of 152 AMD Opteron processing cores partly connected by Infinipath high speed interconnects. Typical NMR calculation times were between 8 and 48 h, using 16 cores. Diagonalisation of the absolute shielding tensor, yields the three principal components,s11,s22ands33, from
which the principal components of the shift tensor,dii, can be
generated using dii =(sii sref)/(1 sref) E (sii sref),
ordered such thatd11Zd22Zd33.sref(assumed to be{1) is
a reference shielding, determined (in previous work) to be 2642.5 ppm for89Y and 2435.4 ppm for119Sn. The isotropic
shift,diso, is then given bydiso= (d11+d22+d33)/3.
Results
For Y2Zr2xSnxO7, cation substitution is expected to lead to a
change from a pyrochlore structure (for Sn-rich compositions) to a defect fluorite structure as the Zr content increases. This change is predicted, by simple radius ratio considerations, to occur between Y2Zr0.6Sn1.4O7and Y2Zr0.4Sn1.6O7.7Fig. 2 shows
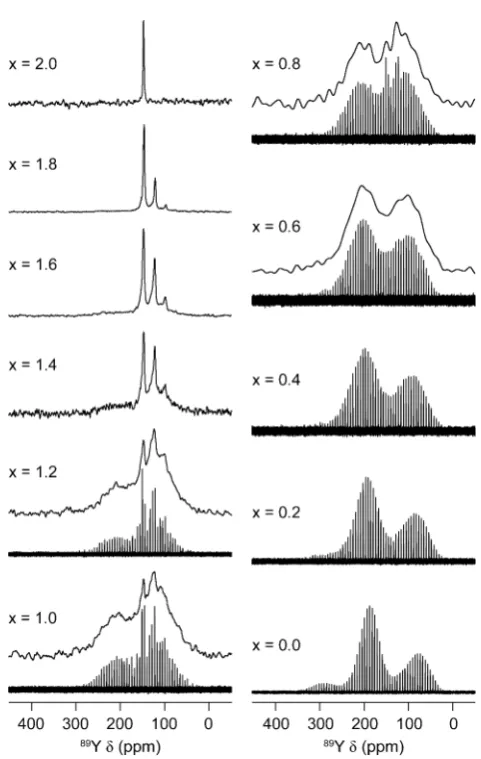
the 89Y MAS NMR spectra of Y2Zr2xSnxO7, acquired using
either a spin echo or a CPMG pulse sequence (spectrum shown as ‘‘spikelets’’). CPMG spectra provide greater peak height signal, but are less successful at accurately representing the true peak shapes and intensities of the narrower resonances.25,26 This is
more successfully achieved using a simple spin echo sequence.
Fig. 2 89Y (14.1 T, 14 kHz MAS) NMR spectra of Y
2Zr2xSnxO7, acquired
using either a spin echo or a CPMG sequence. The latter are shown as ‘‘spikelet’’ spectra.
Open Access Article. Published on 02 March 2015. Downloaded on 04/06/2015 17:05:03.
This article is licensed under a
[image:3.595.307.548.304.684.2]The spectrum of the end member, Y2Sn2O7, exhibits a single
sharp peak at 149 ppm (typical for eight-coordinate yttrium, YVIII), and consistent with previous literature.20,31 This
con-firms the presence of an ordered pyrochlore, with Y occupying the eight-coordinate A site. In contrast, a very different spectrum is observed for the other end member, Y2Zr2O7, which
is expected to adopt the defect fluorite structure. Three very broad resonances are observed at chemical shifts of B290,B185 and
B78 ppm, which are in the regions typically associated with six-, seven- and eight-coordinate Y environments; YVI, YVII and YVIII, respectively,14,32 reflecting the cation and anion disorder in this structure.
Substitution of Zr into Y2Sn2O7results in the appearance of
additional sharp resonances in the spectrum, at lower chemical shift. The narrow width of these lines suggests they result from the more ordered pyrochlore phase, although all resonances in the spectrum of Y2Zr0.2Sn1.8O7are slightly broader than those
for Y2Sn2O7, reflecting the increased (long-range) disorder
upon substitution. From previous work,21–23it seems sensible
to presume that the additional resonances observed correspond to Y species with differing NNN environments,i.e., an increased number of Zr atoms on the six surrounding B sites (shown in Fig. 1(c)). This assignment can be confirmed using DFT calcu-lations, following the approach used in ref. 22, where the local environment of one Y within the Y2Sn2O7pyrochlore unit cell is
varied to include all numbers and possible arrangements of Sn/Zr on the surrounding B sites. For completeness, a second set of calculations was carried out, varying the local environment of one Y within a unit cell of a hypothetical Y2Zr2O7pyrochlore.
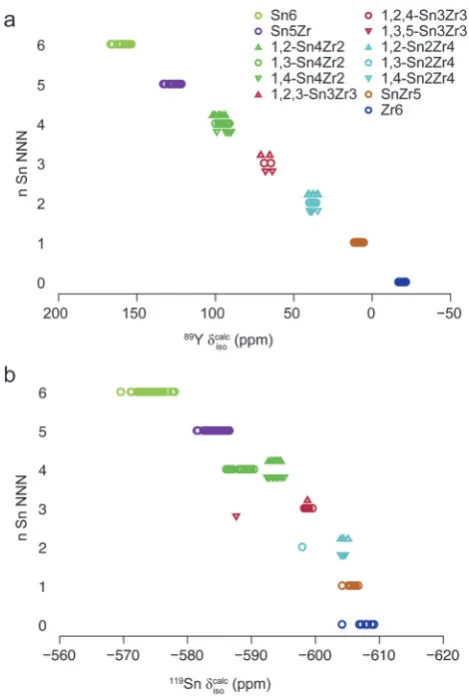
Although this structure is not formed experimentally, it does enable the prediction of potential NMR parameters for Y species with higher Zr content in either the local and/or longer-range structural environment. See the ESI†for further detail. Fig. 3(a) shows the calculated89Y dcalc
iso for varying NNN arrangements.
A systematic change is observed with increasing Sn content, with an increase in dcalc
iso of B28 ppm, per Sn NNN substitution.
A range of values are observed for each NNN arrangement, resulting both from the spatial arrangement of Sn/Zr on the surrounding B sites, and variations in the long-range structure. Fig. 3(a) confirms the assignment of the89Y resonances observed experimentally, with decreasingdisoreflecting an increase in the
number of Zr NNN on the surrounding B sites.
Although the sharp resonances attributed to the pyrochlore phase appear to remain in the spectrum from x= 2.0 until
x = 0.8 (i.e., from Y2Sn2O7 to Y2Zr1.2Sn0.8O7), their relative
intensities vary very little, and no additional peaks further upfield (as might be expected for NNN with higher Zr content) appear. For Zr-rich compositions, only broader resonances are observed, although their relative intensities and lineshape vary as the Sn content increases, confirming that Sn does substitute into the disordered defect fluorite phase. The broad resonances are clearly present in all spectra fromx= 0 tox= 1.4, but even for samples withx= 1.6 and 1.8 these resonances do appear in the spectrum. This can be seen more clearly in the analytical fitting of the spectrum for Y2Zr0.2Sn1.8O7, shown in Fig. 4.
When only the three sharp resonances are considered in the
fitting process a reasonable fit is obtained, but a much better fit is achieved when broader components are included. This indicates that a disordered phase exists even for Sn-rich compositions.
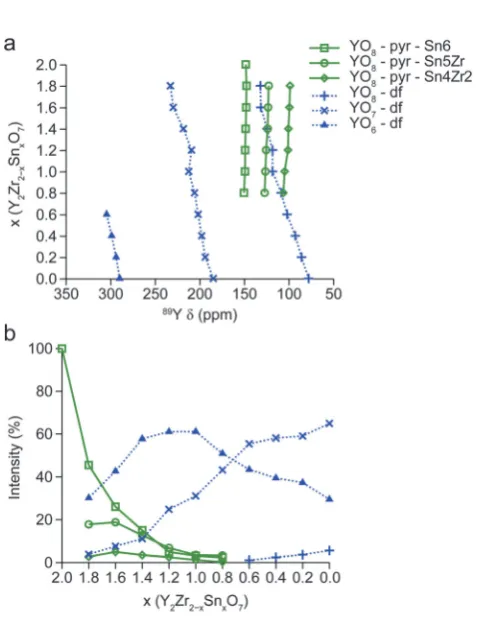
From a fitting of each of the 89Y MAS NMR spectra, the chemical shifts of the individual components, and their relative intensities can be extracted. These are shown in Fig. 5(a) and (b), respectively, and values are given in Table 1. Fig. 5(a) shows that the positions of the three broader resonances vary systematically (downfield) as the Sn content increases, while the position of the sharper peaks show a much smaller upfield shift. If we assume that the three sharp resonances can be attributed to YVIII in the pyrochlore phase (with differing NNN arrange-ments), while the three broad resonances correspond to YVI, YVII and YVIII in the more disordered defect fluorite phase (a reasonable assumption based on Fig. 3 and 5, but discussed in more detail subsequently), the89Y NMR spectra suggest that,
although a solid solution is formed (at least to some extent) at both extremes of the compositional range, there is a significant two-phase region present. Assuming each of the phases con-tains the same proportion of Y cations (i.e., is of composition Y2X2O7) – reasonable in the light of the need for charge balance,
and the method of fabrication – it is possible to determine the
Fig. 3 Plots showing the (a)89Y and (b)119Sn calculated isotropic chemical
shifts,dcalc
iso, as a function of the number,n, of Sn NNN for Y2(Zr,Sn)2O7model
pyrochlores with local environments as described in the ESI.†
Open Access Article. Published on 02 March 2015. Downloaded on 04/06/2015 17:05:03.
This article is licensed under a
[image:4.595.310.545.46.396.2]percentage of pyrochlore and disordered phases that are present, as shown in Fig. 6(a). This shows that a substantial amount of the disordered phase appears to be present even when the Zr content is relatively low, with approximately equal amounts of the two phases present forx= 1.6. A single (disordered) phase is present fromx= 0.6 tox= 0. The presence of a two-phase region from Y2Zr0.2Sn1.8O7 to Y2Zr1.2Sn0.8O7 is a remarkably different
picture from that predicted from the simplerA/rB radius ratio Fig. 4 Fits and corresponding (vertical) expansions of the89Y MAS NMR
spectrum of Y2Zr0.2Sn1.8O7, shown in Fig. 2, (a) without and (b) with
broader components (attributed to the defect fluorite phase) included. The green, blue and red lines denote fits for the pyrochlore, defect fluorite and all resonances, respectively.
Fig. 5 Plot showing the variation of (a) chemical shifts and (b) integrated intensities of the resonances observed in the 89Y MAS NMR spectra (denoted pyr and df for pyrochlore and disordered defect fluorite phases, respectively) of Y2Zr2xSnxO7shown in Fig. 2, with nominal composition.
[image:5.595.49.289.46.279.2]For the pyrochlore phase, the B-site NNN arrangement for each environ-ment is also shown.
Table 1 89Y isotropic chemical shifts,diso, relative intensities (%),
coordi-nation number and assignment of the resonances observed in89Y MAS NMR spectra of Y2Zr2xSnxO7shown in Fig. 2. (Errors are estimated to be
0.5 ppm and3%)
Compound
diso
(ppm)
Intensity (%)
Coordination
number Phase NNN
Y2Sn2O7 148.6 100 8 Pyrochlore Sn6
Y2Zr0.2Sn1.8O7 147.7 45.5 8 Pyrochlore Sn6
122.8 17.8 8 Pyrochlore Sn5Zr
98.9 2.7 8 Pyrochlore Sn4Zr2
233.1 3.8 8 Defect fluorite
132.1 30.2 7 Defect fluorite
Y2Zr0.4Sn1.6O7 148.1 26.0 8 Pyrochlore Sn6
123.5 18.8 8 Pyrochlore Sn5Zr
99.6 4.9 8 Pyrochlore Sn4Zr2
229.9 7.6 8 Defect fluorite
131.6 42.7 7 Defect fluorite
Y2Zr0.6Sn1.4O7 148.7 15.0 8 Pyrochlore Sn6
124.1 12.7 8 Pyrochlore Sn5Zr
100.8 3.5 8 Pyrochlore Sn4Zr2
218.5 11.1 8 Defect fluorite
124.7 57.8 7 Defect fluorite
Y2Zr0.8Sn1.2O7 149.3 4.9 8 Pyrochlore Sn6
125.7 6.8 8 Pyrochlore Sn5Zr
101.2 2.5 8 Pyrochlore Sn4Zr2
209.4 24.8 8 Defect fluorite
118.5 61.1 7 Defect fluorite
Y2Zr1.0Sn1.0O7 149.4 3.1 8 Pyrochlore Sn6
126.6 3.5 8 Pyrochlore Sn5Zr
104.9 1.2 8 Pyrochlore Sn4Zr2
212.5 31.1 8 Defect fluorite
118.6 61.1 7 Defect fluorite
Y2Zr1.2Sn0.8O7 150.6 2.3 8 Pyrochlore Sn6
127.4 3.2 8 Pyrochlore Sn5Zr
106.3 0.2 8 Pyrochlore Sn4Zr2
206.0 43.2 8 Defect fluorite
108.8 50.9 7 Defect fluorite
Y2Zr1.4Sn0.6O7 304.7 1.1 8 Defect fluorite
202.0 55.5 7 Defect fluorite
102.2 43.5 6 Defect fluorite
Y2Zr1.6Sn0.4O7 299.0 2.4 8 Defect fluorite
198.0 58.1 7 Defect fluorite
93.0 39.5 6 Defect fluorite
Y2Zr1.8Sn0.2O7 294.0 3.6 8 Defect fluorite
194.0 59.0 7 Defect fluorite
86.0 37.3 6 Defect fluorite
Y2Zr2O7 290.0 5.6 8 Defect fluorite
185.0 64.9 7 Defect fluorite
78.0 29.5 6 Defect fluorite
Open Access Article. Published on 02 March 2015. Downloaded on 04/06/2015 17:05:03.
This article is licensed under a
[image:5.595.287.553.98.600.2] [image:5.595.48.288.346.656.2]arguments, where a single-phase pyrochlore is predicted from Y2Sn2O7to Y2Sn1.6Zr0.4O7and a single defect fluorite phase from
Y2Zr0.6Sn1.4O7to Y2Zr2O7.
From the plot in Fig. 5(b), where the relative intensities of each of the resonances assigned to the pyrochlore phase are shown, and a consideration of the relative numbers of Sn and Zr cations surrounding each Y, it is possible to determine the relative proportion of Sn and Zr in this phase asxvaries. From these values, and knowing the overall relative proportion of Sn
and Zr used in the synthesis (i.e., the value of x), it is then simple to calculate the relative proportions of these two cations in the disordered phase (see the ESI† for details). Fig. 6(b) shows the relative amounts of Sn and Zr in each of the pyrochlore and in the defect fluorite phases (i.e., the composition of the phase) for each material within the series, and Fig. 6(c) plots the proportion of the total amount of Sn used in the synthesis (and, similarly, the total amount of Zr,) that is incorporated into the pyrochlore and disordered phases, respectively. It can be seen from Fig. 6(b), that the composition of the pyrochlore phase formed varies very little throughout the series, rising to a maximum of
B13% Zr, i.e., corresponding to a formula of Y2Zr0.26Sn1.74O7,
which would appear to represent the solid-solution limit of Zr in Y2Sn2O7. The lack of compositional variation for this phase
explains the small changes in chemical shift observed for the resonances in the NMR spectrum in Fig. 5(a), and the similar peak intensities observed for these resonances asxvaries. In contrast, the composition of the disordered phase varies significantly throughout the compositional range, explaining the considerable changes in chemical shift observed. This suggests that a significant amount of Sn can be incorporated into this phase (i.e., that the limit of solid solution is high), but that, as shown in Fig. 5, for Sn-rich syntheses the pyrochlore phase is preferentially formed, with very little disordered phase produced. Fig. 6(c) shows that whenx= 1.8, of the small proportion of Zr used, just over 60% is incorporated into a disordered phase, whilst just under 40% is found in the pyrochlore phase. Asxdecreases (i.e., for higher Zr content) a much greater proportion of the total Zr used is found in the disordered phase, reflecting the increasing amount of this phase formed.
It was shown in ref. 21 that the relative intensities of the resonances in89Y MAS NMR spectra of Y2Ti2xSnxO7were able
to provide information on B-site cation disorder, matching well to those predicted for a random distribution of cations, with little evidence for ordering or clustering found. If a random distribution is assumed, the probability of findingnSn NNN B sites, P(nSn), can be calculated using a binomial distribution with P(nSn) = O (x/2)n (1 x/2)6n, where O represents the number of possible permutations for the distribution ofnSn atoms over the 6 B sites. The predicted intensities, equally applicable to Y2Zr2xSnxO7, are shown in the ESI.†A
compar-ison to the relative experimental intensities of the pyrochlore peaks, shown in Fig. 5(a), confirms that only a small number of Zr cations appear to be incorporated into the pyrochlore phase, with good agreement obtained only if the proportion of Zr is low, no matter the formal value ofx. This supports the previous conclusion of a relatively low solid-solution limit of Zr in Y2Sn2O7pyrochlore. If a random distribution of B-site cations
is assumed it is possible to determine (from Fig. S3.1 in the ESI†) the pyrochlore composition for which best agreement is obtained. These points are plotted on Fig. 6(b) (as red crosses), and confirm the values obtained previously and,ergo, the likely presence of a random distribution of B-site cations in this phase. Comparison of these values to those determined pre-viously and shown on Fig. 6(b) also provide an estimate of the possible errors of the approaches used. The lack of resonances
Fig. 6 Plot showing (a) the amount of pyrochlore (pyr) and disordered defect fluorite (df) phases, (b) the composition of the two phases and (c) the percentage of each type of Sn/Zr obtained, as a function of nominal composition. In (b), the percentages of the Sn and Zr in the pyrochlore phase (or the defect fluorite phase) should equal 100%. In (c), the percentage of Sn in the pyrochlore and defect fluorite phases should add to 100%. Also shown in (b), are red crosses corresponding to the pyrochlore compositions determined assuming a random distribution of Sn/Zr cations, as described in the ESI.†
Open Access Article. Published on 02 March 2015. Downloaded on 04/06/2015 17:05:03.
This article is licensed under a
[image:6.595.49.287.45.498.2]with low numbers of Sn NNN in any of the spectra confirm that cation segregation,i.e., the formation of domains, is not observed for the pyrochlore phase. This is in agreement with previous conclusions from TEM measurements.24 Further
information on the phases present (and their composition) can be obtained using119Sn (I= 1/2) NMR.119Sn MAS NMR
spectra of Y2Zr2xSnxO7 have been published in previous
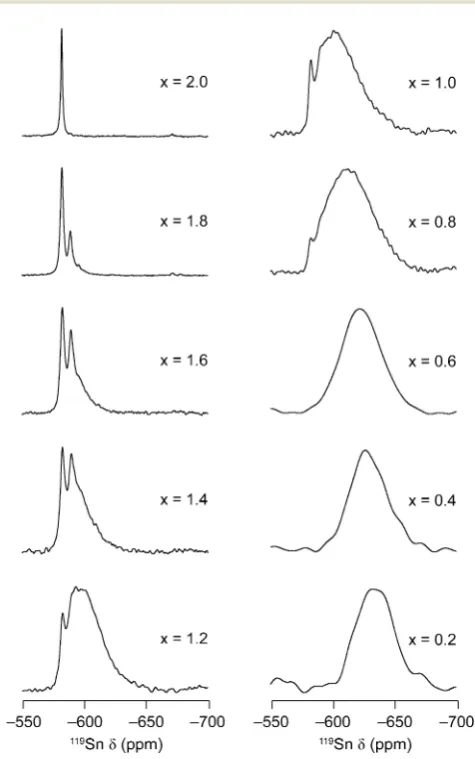
work,22but are reproduced here, in Fig. 7, to aid subsequent discussion and analysis. The chemical shifts and relative inten-sities of the components are given in Table 2. For Y2Sn2O7, a
single sharp resonance is observed at582 ppm, corresponding to SnVI, and consistent with Sn on the six-coordinate B site of an ordered pyrochlore. As Zr is substituted (i.e., as xdecreases), additional resonances appear at lower chemical shift. Following the procedure of ref. 21 described above (and in more detail in the ESI†), 119Sn DFT calculations for a range of Y2(Zr,Sn)2O7
model systems were carried out.
The results are shown in Fig. 3(b), where the variation in
dcalc
iso with the number of Sn NNN is shown. The figure confirms
a shift to lowerd(ofB10 ppm) is observed upon substitution of Zr, although the magnitude of the change does appear to
become smaller as the Zr content increases. This is in contrast to the corresponding plots for89Y (Fig. 3(a)), but is similar to
the behavior observed for119Sn in Y
2(Ti,Sn)2O7in ref. 22. In this
latter case, complete overlap of resonances associated with NNN environments with differing (but high) numbers of Ti was predicted (and observed experimentally) for119Sn NMR spectra. Although Fig. 3(b) shows that differentiating119Sn environments with high numbers of Zr NNN might be possible in principle for Y2(Zr,Sn)2O7, only a maximum of three resonances from the
pyrochlore phase are ever observed, providing some support for the lack of significant amounts of Zr in this phase (and the lack of any significant amount of cation ordering).
For Y2Zr1.8Sn0.2O7, a broad resonance is observed in the
119Sn NMR spectrum, at approximately 634 ppm, again
corresponding to SnVI, presumably now in a disordered defect fluorite phase. This resonance shifts to highdas the Sn content increases, confirming the increased substitution of Sn in this phase. The presence of this broader resonance is clear in all spectra fromx = 0 tox= 1.6 and, although not immediately obvious by eye, analytical fitting of the spectrum for x = 1.8 (shown in the ESI†), reveals a much better fit is obtained when this broad component is included. As observed for 89Y, the
119Sn MAS NMR spectra appear to suggest a significant
two-phase region is present for Y2Zr2xSnxO7, with peaks associated Fig. 7 119Sn (14.1 T, 20 kHz MAS) NMR spectra of Y
2Zr2xSnxO7, acquired
[image:7.595.303.552.92.416.2]using a spin echo pulse sequence. Adapted with permission from ref. 24.
Table 2 119Sn isotropic chemical shift,diso, relative intensity (%),
coordi-nation number and assignment of the resonances observed in89Y MAS NMR spectra24of Y2Zr2xSnxO7shown in Fig. 2. (Errors are estimated to be
0.5 ppm and3%)
Compound
diso
(ppm)
Intensity (%)
Coordination
number Phase NNN
Y2Sn2O7 582.0 100 6 Pyrochlore Sn6
Y2Zr0.2Sn1.8O7 582.2 57.6 6 Pyrochlore Sn6
589.1 19.9 6 Pyrochlore Sn5Zr
595.7 0.8 6 Pyrochlore Sn4Zr2
591.6 21.7 6 Defect fluorite
Y2Zr0.4Sn1.6O7 582.5 33.5 6 Pyrochlore Sn6
589.6 25.5 6 Pyrochlore Sn5Zr
596.3 41.0 6 Defect fluorite
Y2Zr0.6Sn1.4O7 582.6 18.9 6 Pyrochlore Sn6
590.1 25.9 6 Pyrochlore Sn5Zr
598.8 55.2 6 Defect fluorite
Y2Zr0.8Sn1.2O7 582.5 6.6 6 Pyrochlore Sn6
590.0 5.2 6 Pyrochlore Sn5Zr
600.0 87.3 6 Defect fluorite
Y2Zr1.0Sn1.0O7 582.7 6.4 6 Pyrochlore Sn6
590.0 6.1 6 Pyrochlore Sn5Zr
604.0 87.6 6 Defect fluorite
Y2Zr1.2Sn0.8O7 582.6 1.9 6 Pyrochlore Sn6
590.0 2.3 6 Pyrochlore Sn5Zr
612.0 95.8 6 Defect fluorite
Y2Zr1.4Sn0.6O7 622.0 100 6 Defect fluorite
Y2Zr1.6Sn0.4O7 627.3 100 6 Defect fluorite
Y2Zr1.8Sn0.2O7 634.8 100 6 Defect fluorite
Open Access Article. Published on 02 March 2015. Downloaded on 04/06/2015 17:05:03.
This article is licensed under a
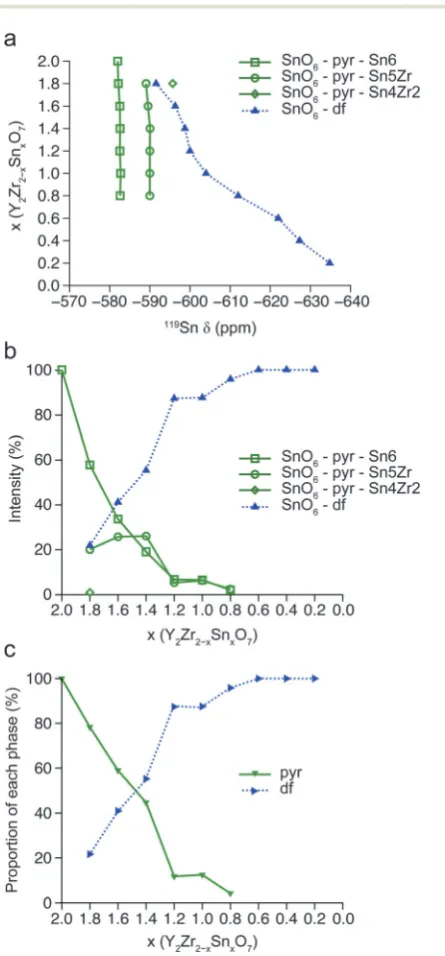
[image:7.595.47.285.315.695.2]with the pyrochlore phase observed untilx= 0.8. The positions and relative intensities of all peaks in each of the119Sn spectra are plotted in Fig. 8(a) and (b), respectively. Unlike89Y, these
intensities cannot provide information directly on the propor-tion of the phases present, as the amount of Sn in each phase may vary. However, the relative proportion of Sn in the two phases at each composition can be determined easily (and is shown in Fig. 8(c)). The values obtained are in excellent agree-ment with those determined (indirectly and independently) by
89Y NMR shown in Fig. 6(c), confirming the validity of the
approach used previously.
So far, attention has been focussed on the number and nature of phases present for Y2(Zr,Sn)2O7, and on their
compo-sition and, for the pyrochlore phase only, the cation distribu-tion. However, for the disordered defect fluorite phase, disorder of the anions/vacancies is also present. If the vacancy distribu-tion were random the average coordinadistribu-tion number of each of the different types of cations within this phase would be 7, and the proportions of YVIII, YVII and YVI (as determined from a simple binomial distribution) would be expected to beB34%,
B39% and B20%, respectively, with the amount of all other coordination environments accounting (combined) for less than 7% of the Y. The89Y MAS NMR spectrum of Y2Zr2O7in
Fig. 2, and the plot in Fig. 5(b), show that YVIII, YVIIand YVI account forB29%,B65% andB6% of the spectral intensity for the disordered phase, giving an average coordination num-ber ofB7.2. Therefore, the average coordination number of Zr in Y2Zr2O7 is B6.8, indicating some ordering of the anion
vacancies, and preferential ordering/clustering around Zr. As Sn is substituted into this phase the relative intensities of the spectral resonances resulting from YVIII, YVII and YVIvary
(as shown in Fig. 5(b)), indicating a change in the average Y coordination number. The119Sn MAS NMR spectra in Fig. 7 show only SnVIis present in all cases, (see the ESI†for more detail), suggesting that anion vacancies in the disordered phase are preferentially associated with this species. Combining the relative intensities of the spectral resonances (i.e., the propor-tion of each type of environment) with the number of vacancies associated with each (i.e., 0, 1 and 2 for eight-, seven- and six-coordinate species, respectively), it is possible to determine the average coordination number for Y, Sn and Zr in the disordered phase for each of the compositions studied, as shown in Fig. 9. (Note that Fig. 9 plots this against the value ofxdetermined for the disordered phase, shown in Fig. 6(b), not the nominal value ofx used in the synthesis). Fig. 9 shows that as Sn is introduced into the defect fluorite phase (i.e., asxincreases) the coordination number of Y rises fromB7.2 to close to 8,
Fig. 8 Plot showing the variation of (a) chemical shifts and (b) integrated intensities of the resonances observed in the119Sn MAS NMR spectra of
Y2Zr2xSnxO7shown in Fig. 7, with nominal composition. (c) Plot showing
the amount of Sn in the pyrochlore (pyr) and disordered defect fluorite (df) phases.
Fig. 9 Plot showing the variation in average coordination number of Y, Sn and Zr in the disordered defect fluorite phase as a function of the actual composition (determined from Fig. 6(b)). Note, this is not the nominal composition of the starting materials.
Open Access Article. Published on 02 March 2015. Downloaded on 04/06/2015 17:05:03.
This article is licensed under a
[image:8.595.61.284.185.664.2] [image:8.595.310.546.494.672.2]while that of Zr drops fromB6.8 toB6.5. Only SnVIis observed for all compositions.
Discussion
The picture of Y2Zr2xSnxO7 that emerges from NMR
spectro-scopy is a relatively complex one. Although a change is observed from a pyrochlore (atx= 2.0) to a defect fluorite phase (atx= 0), a significant two-phase region is present, fromx= 1.8 to 0.8, before a single disordered defect fluorite phase is found from
x = 0.6 to 0. However, the compositions of the two phases present simultaneously are very different, with an apparent solid solution limit of B13% Zr in Y2Sn2O7, whereas the
composition of the disordered phase varies systematically, indicating that there does not appear to be a fundamental miscibility gap for this phase. As the initial amounts of Sn and Zr vary, it is not the composition of the pyrochlore phase that changes, but instead, as shown in Fig. 6a, the relative amount of the Sn-rich pyrochlore and the Zr-rich defect fluorite phase. Note that all of the samples in this work (and in ref. 24 and 35) have been synthesised at one temperature. It is not clear whether variation of synthetic conditions would lead to a variation in the composition or in the amount of each phase obtained. This prevents any detailed analysis of the thermo-dynamic stability of the phases, although this may be possible in future work if a wider range of synthetic conditions are employed.
This picture is very different from those described in pre-vious work on this system. Early work by Kuet al.33 found a single phase present throughout the solid solution, with a distinct transition from pyrochlore to defect fluorite observed atx= 0.4, and this was confirmed in a subsequent study34using both X-ray and neutron diffraction, although large composi-tional steps (ofx = 0.4) were used in both cases. This latter work, however, did note the difficulty in studying these materi-als using diffraction; with Zr4+and Y3+being isoelectronic (and, hence, having indistinguishable X-ray scattering factors), and all three cations having similar neutron scattering lengths. Although diffraction might be expected to be more sensitive to ordered phases, it was noted that the intensity of the pyrochlore superstructure reflections were extremely weak. In the latter work, the coexistence of a small but significant amount of a more disordered second phase was suggested for higher Sn content (though it is not clear for which samples this might be present) but, although a detailed study of the occu-pancies and positions of the oxygen sites in the more ordered phase was carried out, a single-phase refinement with fixed composition was performed in all cases.34
More recent work by de los Reyes et al.24 combined a
number of techniques to study Y2Zr2xSnxO7, and prepared a
series of samples with smaller compositional steps (ofx= 0.2). Laboratory X-ray diffraction showed the complete loss of pyro-chlore at x = 0.8, indicating the transformation to a defect fluorite phase. Raman spectra were interpreted as showing a gradual disorder (of both anions and cations) in the pyrochlore
phase, that continued up tox= 1.0, and also suggested some local order in the defect fluorite phase observed. However, it was noted that the laboratory X-ray measurements did not have the resolution to detect any coexisting phases, given the similar X-scattering from isoelectronic Y3+ and Zr4+, and all
refine-ments considered a single phase of fixed composition. This work was subsequently extended by some of the authors,35with synchrotron X-ray diffraction appearing to suggest that pyro-chlore phases are observed from x = 2.0 to 1.2, and defect fluorite forx= 0.6 to 0, with a two-phase region betweenx= 1.2 to 0.6. However, XANES spectra indicate continuous local structure variation over the compositional range.
The presence of two phases is observed over a much greater compositional range using NMR spectroscopy, possibly owing to its sensitivity to local, rather than long-range, structure. It is very clear, however, from Fig. 2, that many of the89Y MAS NMR spectra look very similar, containing significant (but evolving) amounts of both broader and sharp resonances, and indicating no abrupt change in the phase composition of the sample. The interpretation of the NMR data hinges on one crucial assump-tion – that the sharper resonances in the spectra can be associated with a pyrochlore phase, with the much broader ones attributable to disordered defect fluorite phases. There is, however, a significant amount of evidence to support this: (i) the similarity of the shape and width of the resonances between compositions, (ii) the systematic variation in line position of the broad resonances shown in Fig. 5(a), suggesting a compositional variation of a similar structural phase, (iii) the self-consistent result from independent analysis of 89Y and
119Sn spectra and (iv) the width of the broader resonances even
whenxis low, suggesting considerable disorder not just in the local but also the longer-range environment.
There is considerable discussion in earlier work of the onset of cation and anion disorder with varying composition, with detailed studies of oxygen occupancies examining when each might occur and to what extent.24,33–35Although this work is
not focussed on this aspect directly, it does emphasise the need for caution when considering previous results, particularly if only a single phase of fixed composition was used during the refinement. Although the relative intensities of the sharp resonances in the spectra indicate that the substitution of Zr into Y2Sn2O7appears random, with no evidence for significant
clustering, little detailed information on the onset of cation and anion disorder can be easily extracted from the spectra obtained (although this may be possible with more complex NMR experiments in future work). No evidence of SnVIIor SnVIII is observed by 119Sn NMR, indicating little cation antisite disorder (at least for Sn) in the pyrochlore phase, and the similarity of the broader resonances observed for samples with
x = 2.0 to 1.6 to those for samples with higher Zr content suggest that these result not from cation antisite disorder (as suggested previously), but more likely from a coexisting dis-ordered defect fluorite phase. There is no evidence in the89Y MAS spectra for YVIin the pyrochlore phase, suggesting that cation antisite disorder is either not present, or at least is below the detection level (i.e., the relative signal-to-noise ratio) of the
Open Access Article. Published on 02 March 2015. Downloaded on 04/06/2015 17:05:03.
This article is licensed under a
spectrum. It may well be that the disorder observed in previous work using XANES or Raman24,35results from the presence of the coexisting defect fluorite phase in these samples.
Good agreement is obtained, however, between the coordi-nation numbers determined by NMR spectroscopy (see Fig. 9), the molecular dynamics (MD) calculations and XANES results in ref. 35. XANES suggested the coordination of Zr changed almost continuously from 7 at x = 0 towards 6 at lower Zr content, while that of Y varied from 8 in the pyrochlore (x= 2.0) phase toB7 in the defect fluorite phase. MD calculations for Y2Zr2O7predicted coordination numbers of 6.8 for Zr and 7.2
for Y, in excellent agreement with the NMR results.
Conclusions
89Y and 119Sn NMR spectroscopy have been used to investigate
Y2Zr2xSnxO7materials. In contrast to previous work,24,33–35a more
complex picture of the phase variation with composition emerges, with single-phase pyrochlore observed only for the Sn end member (x= 2.0), and a single defect fluorite phase only forx= 0 to 0.6. Using only the intensities of peaks in the NMR spectra (with spectral assignment aided by DFT calculations), we are able to obtain information on the proportion of phases present and their composition. A broad two-phase region is obtained, but the two phases present have very different composition, with the pyrochlore phase having a maximum amount of 13% Zr incorporated, whereas the composition of the defect fluorite phase varies throughout. However, the observation of such a large a two-phase region, and the difference in composition between the two phases does not agree well with previous diffraction studies of these materials,24,33–35 where in most cases a single phase of fixed composition has been assumed for the refinement procedure. The NMR spectra show little evidence for significant cation antisite disorder in the pyrochlore phase (i.e., this is below the detection limit of the measurement), but do show some prefer-ential ordering of the anion vacancies in the defect fluorite phase. Sn is only ever found in a six-coordinate environment, while remaining vacancies are more likely to be associated with Zr than Y. These results are in good agreement with previous results using XANES and simple MD calculations.35
It is anticipated that additional NMR measurements may also provide information. For example, measurement of the anisotropic shielding and its variation across the lineshapes may offer more insight into cation disorder within the defect fluorite phase – information that is not able to be extracted from the measurements performed in this work. Alternatively, the use of17O NMR spectroscopy also has the potential to offer information on the defect fluorite cation disorder, providing that the sample (and both phases within it) can be uniformly enriched. However, the results presented here, extracted simply from the NMR spectra without the imposition of any structural model, or any assumption of the composition, suggest the need to exercise caution when interpreting previous diffraction studies, and for significantly more detailed analysis (perhaps including two-phase and/or coupled refinements) to be used in
the future, before the more detailed aspects of cation substitu-tion and/or disorder are considered. These results highlight the use of complementary approaches if detailed and accurate pictures of the long- and short-range structure of such solids are to be obtained, and the need to carefully consider the information that is required and the limitations and sensitivity of all analytical techniques employed.
Acknowledgements
The authors would like to thank EPSRC for DTA awards to MM and SS, and for experimental and computational support (EP/ E041825/1, EP/J501542/1 and EP/F018096/1). We thank EaSt-CHEM for computational support through the EaStEaSt-CHEM Research Computing Facility.
Notes and references
1 M. Kumar, I. A. Raj and R. Pattabiraman,Mater. Chem. Phys., 2008,108, 102.
2 A. Orera and P. R. Slater,Chem. Mater., 2010,22, 675. 3 G. R. Lumpkin,Elements, 2006,2, 365.
4 Y. Zhang, M. W. A. Stewart, M. L. Carter, E. R. Vance and S. Moricca,J. Nucl. Mater., 2009,395, 69.
5 R. Ewing, W. J. Weber and J. Lian,J. Appl. Phys., 2004,95, 5949. 6 M. A. Subramanian, M. A. G. Aravamudan and G. V. Subba
Rao,Solid State Chem., 1983,15, 55.
7 B. C. Chakoumakos,J. Solid State Chem., 1984,53, 120. 8 B. J. Wuensch, K. W. Erberman, C. Heremans, E. M. Ku,
P. Onnerud, E. M. E. Yeo, S. M Haile, J. K. Stalick and D. Jorgensen,Solid State Ionics, 2000,129, 111.
9 K. R. Whittle, L. M. D. Cranswick, S. A. T. Redfern, I. P. Swainson and G. R. Lumpkin, J. Solid State Chem., 2009,
182, 442.
10 K. R. Whittle, M. G. Blackford, R. D. Aughterson, G. R. Lumpkin and N. J Zaluzec,Acta Mater., 2011,59, 7530.
11 K. E. Sickafus, R. W. Grimes, J. A. Valdez, M. Ishimaru, F. Li, K. J. McClellan and T. Hartman,Science, 2000,289, 748. 12 G. R. Lumpkin, M. Pruneda, S. Rios, K. L. Smith, K. Trachenko,
K. R. Whittle and N. J. Zaluzec, J. Solid State Chem., 2007,
180, 1512.
13 M. E. Smith, inEncyclopedia of Nuclear Magnetic Resonance, ed. R. K. Harris and R. E. Wasylishen, Wiley, Chichester, 2009, DOI: 10.1002/9780470034590.emrstm1044.
14 K. J. D. MacKenzie and M. E. Smith,Multinuclear Solid-State NMR of Inorganic Materials, Pergamon Press, Oxford, 2002. 15 T. Charpentier,Solid State Nucl. Magn. Reson., 2011,40, 1. 16 C. Bonhomme, C. Gervais, F. Babonneau, C. Coelho,
F. Pourpoint, T. Azaı¨s, S. E. Ashbrook, J. M. Griffin, J. R. Yates, F. Mauri and C. J. Pickard,Chem. Rev., 2012,112, 5733. 17 S. E. Ashbrook and D. M. Dawson,Acc. Chem. Res., 2013,
46, 1964.
18 M. D. Segall, P. J. D. Lindan, M. J. Probert, C. J. Pickard, P. J. Hasnip, S. J. Clark and M. C. Payne,J. Phys.: Condens. Matter, 2002,14, 2717.
Open Access Article. Published on 02 March 2015. Downloaded on 04/06/2015 17:05:03.
This article is licensed under a
19 P. Blaha, K. Schwarz, G. K. H. Madsen, D. Kvasnicka and J. Lutiz,
Computer code WIEN2k, Vienna University of Technology, 2001. 20 S. E. Ashbrook, K. R. Whittle, G. R. Lumpkin and I. Farnan,
J. Phys. Chem. B, 2006,110, 10358.
21 S. W. Reader, M. R. Mitchell, K. E. Johnston, C. J. Pickard, K. R. Whittle and S. E. Ashbrook,J. Phys. Chem. C, 2009,113, 18874. 22 M. R. Mitchell, S. W. Reader, K. E. Johnston, C. J. Pickard,
K. R. Whittle and S. E. Ashbrook,Phys. Chem. Chem. Phys., 2011,13, 488.
23 M. R. Mitchell, D. Carnevale, R. Orr, K. R. Whittle and S. E. Ashbrook,J. Phys. Chem. C, 2012,116, 4273.
24 M. de los Reyes, K. R. Whittle, Z. Zhang, S. E. Ashbrook, M. R. Mitchell, L. Y. Jang and G. R. Lumpkin,RSC Adv., 2013,3, 5090. 25 H. Y. Carr and E. M. Purcell,Phys. Rev., 1954,94, 630. 26 S. Meiboom and D. Gill,Rev. Sci. Instrum., 1958,29, 688. 27 D. Massiot, F. Fayon, M. Capron, I. King, S. Le Calve,
B. Alonso, J. O. Durand, B. Bujoli, Z. Gan and G. Hoatson,
Magn. Reson. Chem., 2002,40, 70.
28 C. J. Pickard and F. Mauri, Phys. Rev. B: Condens. Matter Mater. Phys., 2001,63, 245101.
29 J. P. Perdew, K. Burke and M. Ernzerhof, Phys. Rev. Lett., 1996,77, 3865.
30 J. R. Yates, C. J. Pickard and F. Mauri,Phys. Rev. B: Condens. Matter Mater. Phys., 2007,76, 024401.
31 C. P. Grey, M. E. Smith, A. K. Cheetham, C. M. Dobson and R. Dupree,J. Am. Chem. Soc., 1990,112, 4670.
32 K. Kawata, H. Maekawa, T. Nemoto and Y. Yamamura,Solid State Ionics, 2006,117, 1687.
33 E. M. Ku, E. M. E. Yeo and B. J Wuensch,Mater. Res. Soc. Symp. Proc., 1999,547, 327.
34 B. J. Wuensch, K. W. Eberman, C. Heremans, E. M. Ku, P. Onnerud, E. M. E. Yeo, S. M. Haile, J. K. Stalick and J. D. Jorgensen,Solid State Ionics, 2000,129, 111.
35 Z. Zhang, S. C. Middleburgh, M. de los Reyes, G. R. Lumpkin, B. J. Kennedy, P. E. R. Blanchard, E. Reynolds and L. Y. Jang,
J. Phys. Chem. C, 2013,117, 26740.
Open Access Article. Published on 02 March 2015. Downloaded on 04/06/2015 17:05:03.
This article is licensed under a