ISSN Print: 2327-4034
DOI: 10.4236/als.2019.74013 Oct. 14, 2019 193 Advances in Literary Study
Learning to Improve: Report of a Three-Year
Capacity-Building Project Leveraging
Professional Development + Coaching to
Improve Third-Grade Reading Outcomes
David D. Paige
1, Grant S. Smith
1, Theresa Magpuri-Lavell
21Bellarmine University, Louisville, KY, USA
2Sandra Dunagan Deal Center for Early Language and Literacy, Georgia College, Milledgeville, GA, USA
Abstract
This study reports the results of a three-year capacity building effort to im-prove core reading knowledge and practice in 165 third-grade teachers working in 63 urban schools and its effects on student reading outcomes. Teachers volunteered to participate in one or two years of professional development lasting from 90 to 180 hours. Core reading knowledge among teachers re-sulted in statically significant growth with generally large effect sizes. Three cohorts of third-grade students taught by participating teachers were assessed on multiple measures of reading at the beginning and end of each school year. Results for within-year improvement showed large effects on all student outcomes. Analysis of the magnitude of student gains between the three years found that for two of the four measures gains in year one were exceeded in years two and three. Implications for professional training to facilitate im-proved reading outcomes are discussed.
Keywords
Teacher Capacity Building, Foundational Reading Skills, At-Scale Reading Improvement
1. Introduction
Calls for reading improvement have echoed for decades and include those from Flesch (1955), Anderson, Hiebert, Wilkinson, & Scott (1985), Snow, Burns, & Griffin (1998), the National Reading Panel (2000), Foorman et al. (2016), and Seidenberg (2017). Accompanying these calls are reading achievement scores How to cite this paper: Paige, D. D.,
Smith, G. S., & Magpuri-Lavell, T. (2019). Learning to Improve: Report of a Three- Year Capacity-Building Project Leveraging Professional Development + Coaching to Improve Third-Grade Reading Outcomes. Advances in Literary Study, 7, 193-223. https://doi.org/10.4236/als.2019.74013
Received: May 27, 2019 Accepted: October 11, 2019 Published: October 14, 2019
Copyright © 2019 by author(s) and Scientific Research Publishing Inc. This work is licensed under the Creative Commons Attribution International License (CC BY 4.0).
http://creativecommons.org/licenses/by/4.0/
DOI: 10.4236/als.2019.74013 194 Advances in Literary Study from the National Assessment of Educational Progress (NAEP, 2017) that have shown little substantive improvement since 1992. Today, close to two-thirds of students score less than-proficient in reading at the fourth- and eighth-grade le-vels. Despite the considerable body of research that has advanced the science of reading (Rayner, Pollatsek, Ashby, & Clifton, 2012) evidence suggests that phi-losophical differences of reading remain tightly ensconced among teacher edu-cators who directly impact the reading praxis taught in teacher preparation pro-grams (Kato & Manning, 2007; Huang, 2014;Taylor & Otinsky, 2007). As Sei-denberg (2017) suggests, these disparate philosophies among teacher educators make their way into the classroom and lead to frustration, low job satisfaction, and children who cannot read. Seidenberg observes that teachers are:
Left to discover effective classroom practices [on their own] because they haven’t been taught them. One of their first discoveries is the irrelevance of most of the theory they have learned that is unconnected to practice. Some of the concepts are impractical, or don’t work, or don’t work as well as something else, like instruction. (p. 255)
The Common Core standards (2010) identify foundational skills as the read-ing sub-skills involved in convertread-ing print to speech and the fluent readread-ing skills that are important to comprehension. Extending the link from language to comprehension, a recent study has found that foundational skills are critical to third-grade achievement on end-of-year state accountability assessments (Paige et al., 2019). The authors reported that students with appropriate foundational skills were seven times more likely to score proficient or better on the state reading test. Further, only one-third of the over 1000 students in the study had attained appropriate foundational skills. Using professional development and coaching to build capacity for teaching reading, the present study reports on an initiative to improve third-grade reading outcomes. This study contributes to the knowledge base of educational change through a description of the teacher training process and the measurement of the student outcome measures that detect improvement in fundamental reading processes.
The structure of this article proceeds with a review of the applicable literature including the role of teacher core and pedagogical knowledge, attempts to change and build teacher practice, and the role of coaching. The study continues with a description of the methods including details of the study context and the curriculum used to improve teacher knowledge and practice, as well as the in-struments used to measure reading. In the results section, we address each of the three research questions with details of the quantitative analysis and the ings. In the discussion section, we provide our interpretations of the study find-ings and the contribution this study makes to the literature base.
2. Review of the Literature
2.1. Teacher Knowledge and Practice
DOI: 10.4236/als.2019.74013 195 Advances in Literary Study students leaves a significant imprint on how these aspiring teachers view reading education. Teacher educators also equip these students with an initial instruc-tional toolkit that is carried with them into the classroom after graduation. How-ever, for too many of these future teachers this toolkit is woefully inadequate. Binks-Cantrell, Washburn, Joshie, & Hougen (2012) assessed what teacher edu-cators understand about foundational reading knowledge. After grouping teach-er educators into highteach-er- and lowteach-er-scoring groups the authors reported that those in the more knowledgeable group produced teacher candidates who out-scored those taught by teacher educators who knew less. The authors concluded that students cannot learn what their teacher does not know and join others who have proposed this condition as a major contributor to poor reading outcome in the United States (Applegate & Applegate, 2004; Seidenberg, 2017). Unfortu-nately, changing what is taught by teacher educators in the over 1200 schools of education in the US is more than a challenging task. For example, in a state-wide analysis of teacher data in Florida, Harris & Sass (2007) found no evidence that either undergraduate training or academic achievement had any effect on the academic outcomes of their future students.
2.2. Changing Teacher Practice
What teachers do in the classroom matters because reading is a learned skill that must be taught, and so it follows that teacher quality impacts student outcomes (Blair, Rupley, & Nichols, 2007; Wenglinsky, 2000; Wharton-McDonald, Press-ley, & Hampston, 1998). In order to be effective reading instruction must be guided by content knowledge and efficacious instructional practices (Kennedy, 2016; Sparks & Loucks-Horsley, 1990). As in subject areas such as biology or history, there exists a core body of content knowledge that teachers must know in order to be effective reading teachers (Snow & Griffin, 2007). Reading core content includes deep knowledge of phonemic awareness, phonics, fluency, vo-cabulary and comprehension, as well as the fundamentals of language and its development (McCardle & Chhabra, 2004; NRP, 2000; Snow, Burns, & Griffin, 1998). In order to provide evidence-based reading instruction teachers must not only possess core content knowledge, they must also have the ability to effec-tively apply that knowledge to classroom practice (Goldhaber & Anthony, 2007; McCardle & Chhabra, 2004; Moats, 2004; NRP, 2000).
ineffec-DOI: 10.4236/als.2019.74013 196 Advances in Literary Study tive delivery models (Darling-Hammond et al., 2009). It has been estimated that about 15 percent of traditional “sit and get” professional development is actually implemented in the classroom, a transfer ratio that provides less than the neces-sary capacity to affect change (Meyer, 1988). Bush (1984) found that training describing instructional practices could be successfully adopted by just 10% of teachers, in other words 90% gained no benefit at all. This suggests that an effec-tive model must provide considerably more support over time as teachers strug-gle to implement new instructional practices (Ermeling, 2009; Fullan, 2001). However, an ineffective delivery model may not be the single root cause of the poor return on PD. It may be, as Elmore (2000) points out, that PD may not target the content most likely to result in change to student outcomes. This may be a problem that both precedes and interacts with complaints of ineffective de-livery models as improvement experts are clear that capacity training must ad-dress the processes that will actually result in change (Bryk, 2014; Elmore, 2002; Demming, 2000).
2.3. Building Teacher Capacity
PD directly addresses the issue of capacity which Cohen, Raudenbush, & Ball (2000) define as the teacher’s knowledge, instructional skill, and material re-sources that combine to create the interaction among students, the content, and the teacher to result in learning. Desimone (2009) posits that effective profes-sional development (PD) increases teacher knowledge and skill, which then leads to change in instruction that results in greater student learning. While this seems a reasonable theory of action it has seldom been shown to actually evolve. A re-view of 1343 PD studies (Yoon et al., 2007) found just nine meeting the re-quirements of What Works Clearinghouse that resulted in significant student gains. This suggests that connecting the links recommended by Desimone is ex-tremely difficult. Looking further into recommendations, Lewis (2009) says that PD must connect what teachers learn directly to their practice. For example, Garet et al. (2001) report that effective PD must focus not only on content knowledge, but also include opportunities for active learning integrated with in-struction. Despite these recommendations, researchers have found teacher prac-tice to be surprisingly resilient to change (Cohen, 1990; Peterson & Comeaux, 1990; Spillane & Zeuli, 1999). Unfortunately, inadequate teacher knowledge is not limited to reading as insufficiencies have been noted across other content areas including teachers of science (Dorph et al., 2007; Luft & Hewson, 2014) and mathematics (National Council of Teachers of Mathematics, 1991).
DOI: 10.4236/als.2019.74013 197 Advances in Literary Study McVay, & Riordan (2003) found that programs providing 80 hours of instruc-tion were more likely to be successful than those providing less. French (1997), on the other hand, found that 50 hours of instruction, practice, and coaching was sufficient to transfer learning to instruction. Teachers must be supported during the critical process of applying new learning to the classroom. Truesdale (2003), Cornett & Knight (2009), and Atteberry & Bryk (2011) report that dur-ing the confusion and frustration that accompanies the implementation of new teaching strategies and routines, coaching can provide teachers with critical support. Active learning involves teachers in a variety of learning approaches to new concepts (Richardson, 1998; Roy & Chi, 2005). Such activities include implementation videos, role playing, reading, discussion, and modeling. Of these activities modeling has been viewed as most effective (Desimone, et al., 2002; Garet et al., 2001; Penuel, Fishman, Gallagher, Korbak, & Lopez-Prado, 2009). The final principle states that professional development should focus on content specific curriculum as it is most effective at improving teacher practice and student achievement (Blank & de las Alas, 2009; Cohen & Hill, 2001; Ken-nedy, 1998).
In their What Works Clearinghouse review, Yoon et al. (2007) arrived at the following conclusions of what drives effective PD. First, while workshops have garnered a poor reputation for effectiveness, surprisingly, all 9 of the studies found to be effective involved workshops of some kind. Second, within-school expertise is often insufficient to facilitate and lead teachers in capacity-building initiatives aimed at student improvement. Successful professional development is more likely to be successful when involving content experts from outside the building. Third, none of the 9 successful studies employed a train-the-trainer approach to professional development which may hold potential for success, but has no evidence for support. Fourth, professional development must be distri-buted over time as educators cannot quickly absorb new learning. Effective PD was found to take 30 or more hours while implementations of shorter duration yielded no positive results. The fifth finding suggests that following professional development sustained follow-up is necessary to leverage its potential for effec-tiveness. Finally, there is no set of best practices for PD, rather, effective PD is constructed from a carefully considered mix of practices customized by content, process, and the context of the particular school building.
2.4. Coaching
DOI: 10.4236/als.2019.74013 198 Advances in Literary Study state-wide middle school study Marsh et al. (2008) found a small, positive effect of coaching on the reading achievement in two of four student cohorts. Newman & Cunningham (2009) as well as Sailors & Price (2010) both found workshop training plus coaching out-performed teachers receiving workshop training only on measures of classroom practice. Matsumura, Gernier, Correnti, Junker, and Bickel (2010) determined that coaching accounted for increases in effective teacher practice that could be attributed to student achievement increases with an effect size equal to 0.51. A four-year study of coaching effects on kindergarten through second-grade learning across 17 schools was conducted by Biancarosa, Bryk, & Dexter (2010). Beginning with a baseline of student reading outcomes, the authors compared growth over four years and found that coaching could be attributable to increases in reading achievement with statistically significant ef-fect sizes of 0.22, 0.37, and 0.43 across the three years following the baseline year. Finally, Davis, McPartland, Pryseski, and Kim (2018) found that the use of lite-racy coaches to assist ninth-grade teachers in the use and implementation of li-teracy strategies resulted in improved student reading comprehension with an effect size of 0.19.
2.5. Research Questions
The present study is part of a three-year professional development initiative to improve end-of-third-grade reading outcomes by improving teacher capacity for reading instruction from kindergarten-through third-grade. This study investi-gates changes in third-grade teacher reading knowledge as a result of PD and the resulting student reading outcomes through a focus on three research questions:
RQ1: To what extent does teacher core reading knowledge change as a result of capacity training delivered within the project?
RQ2: How do third-grade student reading outcomes in the areas of spelling knowledge, pseudo- and sight-word reading, and reading fluency change over the three years of the project?
RQ3: What is the magnitude of student learning across years?
3. Method
3.1. District
Jefferson County Public Schools (JCPS) is located in Louisville, Kentucky and serves approximately 100,000 students, making it the 27th largest public-school
DOI: 10.4236/als.2019.74013 199 Advances in Literary Study Department of Education (2017) state reading achievement test scores (KPREP) reveals that well over half (53.6%) of JCPS students achieve at less-than-proficient levels. When these scores are broken out by ethnicity nearly 60% of Euro-pean-American children achieve proficiency compared to 28.9% of Afri-can-American children. This disparity is important as the present study is con-ducted in schools largely attended by African-American children and others from disadvantaged backgrounds.
3.2. Project Background
The Jefferson County Public Schools Literacy Project (Project) was a universi-ty-district initiative between JCPS and literacy educators from Bellarmine Uni-versity with a goal of increasing end-of-third-grade reading outcomes. The theory of action adopted by the Project was that of Desimone (2009) where im-proving teachers’ core reading knowledge and pedagogical skill with the help of literacy coaches, improves core (tier 1) instruction and results in improved stu-dent reading outcomes. The Project adopted the fundamental idea that to sub-stantially improve reading outcomes teachers must be deeply knowledgeable about how printed words are transferred into sound and meaning by the reader. Teachers must also be highly skilled in the pedagogy that facilitates letter-sound correspondence and the transfer of that knowledge into appropriate reading fluency with comprehension. As such, the Project took the approach that every-one involved in reading instruction must learn to improve, and that this learning is not to a criterion, but rather, grows on a continuous improvement continuum. The district had in place a “Third-Grade Reading Pledge,” an aspirational goal that all end-of-third-grade students would be reading on grade-level, although grade-level was left undefined. In the fall of 2013, the district’s Chief Academic Officer invited area schools of education to propose initiatives to facilitate achievement of the third-grade reading pledge. The proposal from Bellarmine was based on the design of prior reading academies initiated in Dallas and Memphis (Manzo, 2000; Feldman, Schneck, Feighan, Coffey, & Rui, 2011). The Project was reviewed by the District and ultimately approved by the JCPS Board of Education. Project funding came primarily from Title 1 and general funds to pay delivery costs to Bellarmine. Deliverables included the design and delivery of a one-year capacity-building curriculum for kindergarten through third-grade teachers, ESL and Special Education teachers, the training of literacy coaches, designing a student outcome assessment system, collecting and analyzing data, and generally overseeing the Project in conjunction with district administrators. The first-year success of the Project resulted in the annual renewal of the project over the next two years. Total expenditures by the district for the three years amounted to approximately $2.5 million.
3.3. School and Teacher Participation
prin-DOI: 10.4236/als.2019.74013 200 Advances in Literary Study cipals of the 19 lowest performing elementary schools as a major initiative to as-sist them in increasing the teaching capacity necessary to improve attainment of the third-grade reading pledge. As part of Kentucky’s educational reform act (Kentucky General Assembly, 1990) the state incorporated site-based decision making (SBDM) teams at every public school in the state. SBDMs became public policy with the primary intention of giving parents and school-based personnel a voice in the management of their school. As such, each SBDM team is composed of six members that include the principal, two parents, and three faculty mem-bers. Among other duties the SBDM must approve to participate in dis-trict-proposed projects. Principals at each of the 19 schools presented the Project to their SBDM for consideration with all schools voting to participate. Once ap-proved, principals began to solicit the voluntary participation of their teachers in the year-long training initiative and identified a school-based literacy coach. Teachers received no monetary compensation for participation in the Project. However, teachers did receive a total of six hours (3 hours per semester) of graduate level credit at no cost to them and were provided the books required for class. Graduate credit was granted by Bellarmine University and could be ap-plied toward a degree at Bellarmine or transferred to another institution. Classes were delivered weekly in elementary schools that were in proximity to partici-pating schools to ease travel for teacher participants. One year of classes resulted in 90 hours of face-to-face training over the two courses.
By the end of Year 1 many teachers were requesting a second year of training to better extend what they had learned. This resulted in the design of a third and fourth course available to teachers who had completed the initial foundational year of training. For participation in the second year of advanced training, teachers received an additional six hours of graduate credit, again at no cost to them, bringing the total of earned graduate credit to 12 hours for those com-pleting two years of training. This second year of face-to-face training provided an additional 90 hours of training. Teachers participating in both years of train-ing received a total of 180 hours of professional development.
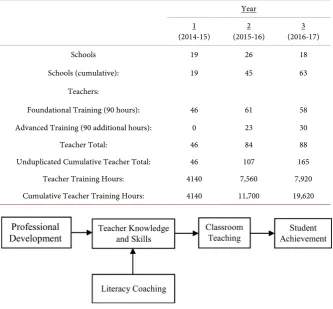
Project training was open to teachers from K-3, special education, and ESL classrooms. Across the three project years a total of 162, 224, and 200 teachers enrolled in training in years 1, 2, and 3 respectively for a total enrollment of 586 teachers. Table 1 shows that in the first year of the project 46 third-grade teach-ers completed foundational training. In project Year 2, 61 third-grade teachteach-ers completed foundational training while 23 (50%) teachers from Year 1 completed advanced training, bringing Year 2 enrollment total to 84. Year 3 saw 58 third- grade teachers complete foundational training while 30 (49%) teachers com-pleted advanced training. In total, 88 teachers comcom-pleted training in Year 3.
DOI: 10.4236/als.2019.74013 201 Advances in Literary Study on this test were viewed as being in need of capacity training to assist their teachers in efforts to better achieve the third-grade reading pledge. Beyond the initial 19 schools, the next group identified as most in need of assistance resulted in twenty-six schools joining the Project in Year 2 for a total of 45 schools. The following year 18 additional schools were identified by the district, bringing to 63 the number of participating schools in Year 3. Schools identified by the dis-trict went through the same SBDM procedures as the initial 19 schools.
3.4. Course Content
[image:9.595.207.541.402.711.2]The theory of action (Figure 1) adopted by the Project is one hypothesized by Desimone (2009) where professional development and literacy coaching im-proves teacher knowledge and skill, which then leads to improved classroom teaching and ultimately, to improved student reading outcomes. This put the primary focus of the Project on the improvement of Tier 1 or core instruction. Training was conducted through traditional face-to-face classes that met 15 times from August through December, and another 15 sessions that met from January to May with instructors hired from the district and trained and moni-tored by the Project leader. Each session lasted 3 hours resulting in a total of 90 training hours across the school year. Training was conducted during Year 1 (2014-15), Year 2 (2015-16), and Year 3 (2016-17) with Year 2 and 3 training
Table 1. Third-grade teacher participation by cohort year.
Year 1
(2014-15) (2015-16) 2 (2016-17) 3
Schools 19 26 18
Schools (cumulative): 19 45 63
Teachers:
Foundational Training (90 hours): 46 61 58
Advanced Training (90 additional hours): 0 23 30
Teacher Total: 46 84 88
Unduplicated Cumulative Teacher Total: 46 107 165
Teacher Training Hours: 4140 7,560 7,920
[image:9.595.208.540.404.708.2]Cumulative Teacher Training Hours: 4140 11,700 19,620
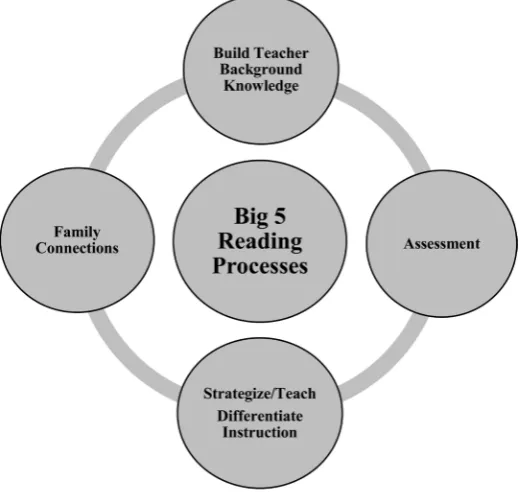
DOI: 10.4236/als.2019.74013 202 Advances in Literary Study consisting of both foundational and advanced training. Course content included the theoretical language processes involved in converting print to speech and the Big 5 reading processes (National Institute of Child Health and Human Devel-opment, 2000) of phonemic and phonological awareness, fluency, vocabulary and comprehension within the context of the Project’s instructional delivery model. Teachers were taught how these processes work on an interactive basis to produce efficient reading with understanding. Teachers were trained and coached to implement reading instruction using the Project’s instructional deli-very model that provided a flexible framework for planning instruction based on student needs. A teaching and learning cycle for each of the Big 5 reading processes was utilized in coursework to ensure a comprehensive understanding of the subject matter and implementation with fidelity of the Project’s instruc-tional delivery model. The teaching and learning cycle included building back-ground knowledge on each of the Big 5 reading processes, assessment for diag-nosis, strategic instruction, and how to involve families and caregivers in the reading development of their child (Figure 2). As part of their training, teachers implemented classroom action plans (CAPs), assignments intended to assist in bridging coursework to classroom application. Embedded within the Project curriculum for the foundational training year were five CAPs that targeted spe-cific teaching strategies associated with the Big 5 reading processes, one each for phonemic awareness, phonics, fluency, vocabulary, and comprehension. The advanced year of training included CAPs focused on systematic and differen-tiated word study and the implementation of guided reading to reinforce the connection to the instructional delivery model for reading instruction. Submis-sion of weekly CAPs detailing the teaching and learning of the Big 5 reading
DOI: 10.4236/als.2019.74013 203 Advances in Literary Study processes and grade level Common Core Standards for English Language Arts within the Project’s instructional delivery model was required in the advanced year of training. Also included in this year of training was a strong emphasis on assessment of the critical reading subskills related to efficient reading. These in-cluded diagnostic assessments that provided insight into the student’s under-standing of phonics, pseudo- and sight-word reading, and reading fluency (van Kuijk, Deunk, Bosker, & Ritzema, 2016). This provided for data-driven instruc-tion based on individual student need. Teachers also received addiinstruc-tional training in teaching letter-feature analysis skills as well as oral reading fluency and com-prehension instruction. Also emphasized was development of a multi-tier sup-port structure (MTSS) for students who were struggling. Throughout the Project a formative approach to curriculum was maintained that allowed the training curriculum to be adjusted in response to the learning of teacher-participants (Jimenez, 1997; Reinking & Bradley, 2004).
3.5. Literacy Coaches
In conjunction with the district, coaches were selected and then trained in the Project curriculum during a 2-week, 80-hour long summer workshop. During the school year coaches met monthly as a group with Project leaders to share in-sights, discuss logistics of the Project, how best to assist teachers, refine coaching skills, and continually enhance subject matter knowledge. Coaches were also trained to develop trust and establish rapport with each teacher in order to pro-vide useful suggestions based on best-practice for improved student outcomes. For each CAP, coaches engaged the participating teacher in a coaching cycle to provide support in the implementation of a new teaching strategy and to ensure continued use of the teaching strategy based on student need. As part of the coaching cycle the coaches held a pre-conference, observed an implementation of the strategy, and then held a post-conference with their respective Project teachers. Each pre- and post-conference session lasted up to 30 minutes. Addi-tionally, and on an as-needed basis, coaches modeled strategies in participating classrooms.
DOI: 10.4236/als.2019.74013 204 Advances in Literary Study district from general funds.
3.6. Student Participants
The unit of analysis for reading outcomes is conducted at the student level. The empirical student sample in the present study are third-grade students instructed by teachers participating in foundational and advanced training across the three years of the study. As the primary concern of district leaders was making the Project available on a wide basis, selection of a control-group was not possible. The number of third-grade teachers participating in the Project varied each year which resulted in a fluctuating number of students available for the analytic sample. After accounting for incomplete data and student mobility, the reported student samples for each Project year reflects an average of 13 to 20 students per Project teacher. While 62% of students attending district schools came from disadvantaged backgrounds, approximately 85.6% of students attending Year 1 and 2 schools are from backgrounds putting them at-risk for reading acquisition. While fewer students attending the Year 3 schools came from disadvantaged backgrounds, the overall percentage of 75% is well above the district average.
3.7. Assessments
3.7.1. Literacy Instruction Knowledge Scale
The Literacy Instruction Knowledge Scale (Reutzel et al., 2009 [LIKS]) is a stan-dardized assessment that assesses a teacher’s literacy content knowledge through a multiple-choice test composed of three subscales, two of which are used in this study. Teachers participating in foundational skill training were administered the LIKS in the beginning of the fall semester and again at the end of the spring semester. The decoding subscale has 32 items while the comprehension subscale contains 43 items. The total knowledge scale is the sum of the two scales reflect-ing a range of 0 to 75. Internal consistency for each subscale reported by the au-thors of the LIKS are Cronbach’s alpha of 0.68 for decoding and 0.77 for com-prehension. Test-retest reliability for the two subscales reported by the test au-thors are 0.76 for decoding and 0.83 for comprehension.
3.7.2. Developmental Spelling Assessment Screener
DOI: 10.4236/als.2019.74013 205 Advances in Literary Study The DSI is scored by awarding one point for each correctly spelled word for a total score ranging from 0 to 20. The assessed range in this study is 0 to 20 with 19 students attaining a score of 20. Two forms of the DSI are available with Form A used in the fall and Form B in the spring. Pearson-r correlations for the five words comprising each of the four spelling stages as reported by the test au-thor range from 0.97 to 0.99 while test-retest correlations range from 0.97 to 0.98.
3.7.3. Word Reading
Word reading is assessed using the Test of Word Reading Efficiency-2 ([TOWRE] Torgesen, Wagner, & Rashotte, 2014). The TOWRE consists of two subtests that determine a students’ ability to efficiently read 1) sight-words (SWE) and 2) phonologically regular pseudo-words (PDE). Sight-word efficiency reflects the extent to which students have automatized regular words while pseudo-word reading is indicative of the student’s ability to quickly apply what they under-stand about letter-sound correspondence to reading decodable non-words. The TOWRE is available in four forms with Forms A & B used in this study. The test is administered individually to each student. For each subtest, the student has 45 seconds to read aloud increasingly complex words that are aligned in columns on the test page. The test administrator marks words read incorrectly with the raw score equal to the number of words pronounced correctly for each subtest. The maximum possible score is 66 for pseudo-word reading and 108 for sight- word reading. In this study, the range of scores on the pseudo-word test (PDE) was 0 to 64 while the range on the sight-word test (SWE) was 0 to 94. Test-retest reliability coefficients for the assessed age group equals 0.92 for the sight-word test and 0.87 for the pseudo-word test.
3.7.4. Reading Fluency
DOI: 10.4236/als.2019.74013 206 Advances in Literary Study that possess adequate reliability (Deno, 1985; Deno, Mirkin, & Chiang, 1982; McGlinchey & Hixson, 2004). The range of reading fluency scores for this group of students was 0 to 200 words-correct-per-minute. Reliability of the present da-ta was determined using a split-half reliability test resulting in Pearson’s r rang-ing between 0.982 and 0.991 dependrang-ing on the text.
3.7.5. Assessment Administration
All assessments were individually administered to students by their Project teacher. Teachers and coaches were instructed on the administration and scoring of each instrument early in foundational training. Assessments were introduced one at a time followed by in-class administration practice. Teachers were then required to administer the assessments to two students and then bring the com-pleted assessments to class. Assessments were then blindly scored by both the instructor and student and compared for reliability. Students whose grading was not in complete agreement with that of the instructor were immediately reme-diated to correct the scoring error. Those teachers were then required to bring to class an additional set of assessments from two different students the following week to repeat the scoring procedure under the auspices of the instructor. After 100% agreement with the instructor, a sample of blind scores for both raters were returned to the researchers for another round of reliability checking. After training and reliability checking, teachers then administered all assessments to their remaining students. Because of the temporal distance between the assess-ment periods the administration training protocol was repeated in April as preparation for the May assessment period.
4. Results
This study reports first, the results of a project to improve teacher capacity of core reading content and second, changes in third-grade reading outcomes over a three-year period as measured by developmental spelling knowledge, pseudo- and sight-word reading, and reading fluency. We begin by analyzing growth in teacher knowledge as measured by the LIKS.
4.1. Research Question One
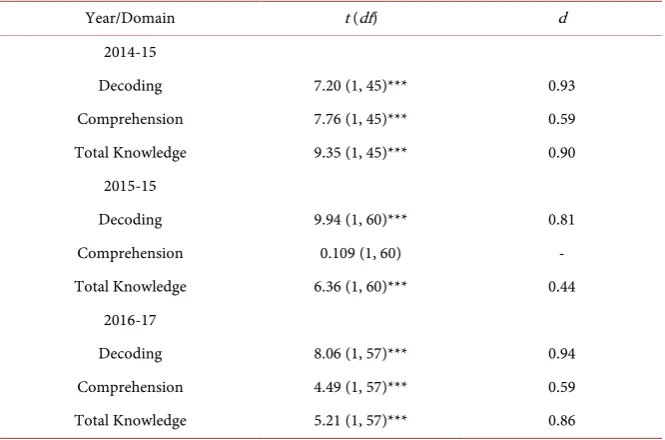
DOI: 10.4236/als.2019.74013 207 Advances in Literary Study increases from 20.9 to 24.0 found in Year 3. Total knowledge means increased from 36.9 to 43.3 in Year 1, Year 2 increased from 39.3 to 42.9, while Year 3 in-creased from 36.6 to 43.1. We conducted a series of paired-sample t-tests using a Bonferroni correction between pre- and posttest LIKS results to determine the sta-tistical significance of change with effect size measured using Cohen’s d (Cohen, 1988). Results in Table 3 show that Year 1 teachers made significant improvement in decoding knowledge, t (1, 45) = 7.2, p < 0.001, d = 0.93, comprehension, t (1, 45) = 7.76, p < 0.001, d = 0.59, and total knowledge, t (1, 45) = 9.35, p < 0.001, d = 0.90. Year 2 teachers showed statistically significant improvement in decoding
Table 2. Means, standard deviations, and standard errors for LIKS assessment of pre- and
posttest decoding, comprehension, and total knowledge domains
Variable Year 1 (n = 46) Year 2 (n = 61) Year 3 (n = 58)
Mean(sd) Std. Error Mean(sd) Std. Error Mean(sd) Std. Error Decoding
Pretest: 14.61 (3.82) 0.39 15.47 (4.25) 0.34 15.66 (3.53) 0.39
Posttest: 18.14 (3.72) 0.38 19.09 (4.71) 0.38 19.33 (4.38) 0.48
Comprehension
Pretest: 21.86 (5.32) 0.43 23.83 (5.37) 0.42 20.89 (5.82) 0.51
Posttest: 24.81 (4.96) 0.41 23.87 (5.34) 0.42 23.98 (4.72) 0.41
Total Knowledge
Pretest: 36.88 (6.51) 0.68 39.30 (8.03) 0.65 36.60 (7.50) 0.93
Posttest: 43.33 (7.92) 0.82 42.92 (8.71) 0.70 43.12 (7.73) 0.96
Note. Decoding subscale range is 0 to 32; comprehension subscale range is 0 to 43. Total knowledge is a sum of the decoding and comprehension subscales for a range of 0 to 75.
Table 3. Pre- to posttest change in LIKS scores by year and domain.
Year/Domain t (df) d
2014-15
Decoding 7.20 (1, 45)*** 0.93
Comprehension 7.76 (1, 45)*** 0.59
Total Knowledge 9.35 (1, 45)*** 0.90
2015-15
Decoding 9.94 (1, 60)*** 0.81
Comprehension 0.109 (1, 60) -
Total Knowledge 6.36 (1, 60)*** 0.44
2016-17
Decoding 8.06 (1, 57)*** 0.94
Comprehension 4.49 (1, 57)*** 0.59
Total Knowledge 5.21 (1, 57)*** 0.86
[image:15.595.207.540.491.711.2]DOI: 10.4236/als.2019.74013 208 Advances in Literary Study knowledge, t (1, 60) = 9.94, p < 0.001, d = 0.81, and total knowledge, t (1, 60) = 6.36, p < 0.001, d = 0.44, with no significant gains found for comprehension. Year 3 teachers showed improvement in decoding knowledge, t (1, 57) = 8.06, p < 0.001, d = 0.94, comprehension, t (1, 57) = 4.49, p < 0.01, d = 0.59, and total knowledge, t (1, 57) = 5.21, p < 0.001, d = 0.86.
4.2. Research Question Two
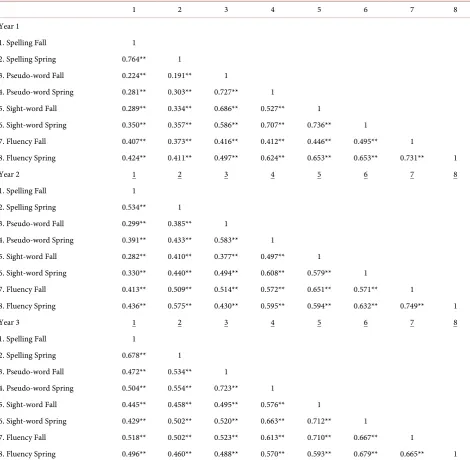
For each study year we measured spelling development, sight-word reading, pseudo-word reading, and reading fluency with each year representing an inde-pendent sample of students. Table 4 shows the means and standard deviations for the measured variables by year while Table 5 shows the bi-variate correla-tions. A close inspection of the study variables indicates some differences in the levels of fall achievement between years while spring scores appear to increase in years two and three beyond that of year one. Bi-variate correlations reveal mod-erate to large relationships between variables for each of the three years with re-lationships in years two and three appearing generally larger than those in year one.
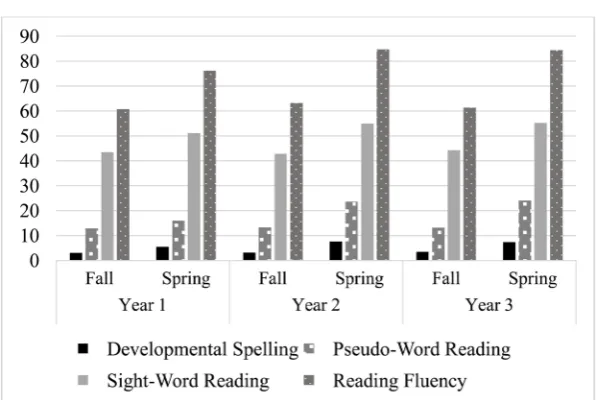
Research question two asks the extent to which student reading outcomes changed over the three years of the Project. The Figure 3 bar graph shows the fall and spring means for each variable across the three study years. A visual in-spection of the means shows first, that growth occurred in each of the four va-riables between fall and spring of each year. Developmental spelling means in-creased from 3.1 to 5.5 in Year 1 while in Year 2 it inin-creased from 3.2 to 7.6, and in Year 3 means rose from 3.5 to 7.4. Pseudo-word reading means saw Year 1 rise from 13.9 to 18.0, Year 2 increase from 14.1 to 23.0 and Year 3 improve from 14.0 to 23.3. For sight-word reading Year 1 means increased from 40.0 to 48.5 while Year 2 rose from 39.4 to 55.0, and Year 3 increases grew from 40.7 to 55.2. Increase in reading fluency can also be seen as Year 1 rose from 60.7 to 73.3, Year 2 began at 63.2 and then rose to 86.6, and Year 3 improved from 60.3 to 85.7. The second observation from Figure 3 is that the spring means for Years 2 and 3 consistently exceeded those for the spring of Year 1. Spelling develop-ment in spring of Year 1 was 5.5 compared to 7.6 and 7.4 in the spring of Years 2 and 3 respectively. The spring mean for Year for pseudo-word reading was 18.0 and increased to 23.0 in Year 2 and 23.4 in Year 3. The same trend can be seen in sight-word reading where the Year 1 spring mean is 48.5, while the Year 2 mean is 55.0 and Year 3 is 55.2. Finally, reading fluency shows a spring of Year 1 mean equal to 73.3 which increased to 86.6 and 85.7 respectively for Years 2 and 3. Our next step is to determine the statistical significance of these observed changes.
DOI: 10.4236/als.2019.74013 209 Advances in Literary Study
Table 4. Third-grade means and standard deviations for reading outcome variables by year.
Variable Year 1 (n = 392) Year 2 (n = 410) Year 3 (n = 460)
Fall Spring Fall Spring Fall Spring
Developmental Spelling 3.07 (2.02) 5.51 (2.57) 3.15 (1.38) 7.59 (3.16) 3.48 (1.33) 7.37 (2.82)
Pseudo-Word Reading 13.94 (4.43) 17.95 (5.34) 14.09 (6.39) 22.96 (7.57) 13.99 (5.89) 23.40 (8.37)
Sight-Word Reading 40.01 (8.26) 48.50 (7.98) 39.39 (8.70) 55.00 (10.13) 40.67 (8.18) 55.24 (8.86)
Reading Fluency 60.71 (15.79) 73.31 (17.15) 63.16 (22.35) 86.56 (24.04) 60.32 (21.59) 85.72 (27.36)
Note. Differences from fall to spring within year are all statistically significant at p< 0.001.
Table 5. Bivariate correlations for reading outcome variables by year.
1 2 3 4 5 6 7 8
Year 1
1. Spelling Fall 1
2. Spelling Spring 0.764** 1
3. Pseudo-word Fall 0.224** 0.191** 1
4. Pseudo-word Spring 0.281** 0.303** 0.727** 1
5. Sight-word Fall 0.289** 0.334** 0.686** 0.527** 1
6. Sight-word Spring 0.350** 0.357** 0.586** 0.707** 0.736** 1
7. Fluency Fall 0.407** 0.373** 0.416** 0.412** 0.446** 0.495** 1
8. Fluency Spring 0.424** 0.411** 0.497** 0.624** 0.653** 0.653** 0.731** 1
Year 2 1 2 3 4 5 6 7 8
1. Spelling Fall 1
2. Spelling Spring 0.534** 1
3. Pseudo-word Fall 0.299** 0.385** 1
4. Pseudo-word Spring 0.391** 0.433** 0.583** 1
5. Sight-word Fall 0.282** 0.410** 0.377** 0.497** 1
6. Sight-word Spring 0.330** 0.440** 0.494** 0.608** 0.579** 1
7. Fluency Fall 0.413** 0.509** 0.514** 0.572** 0.651** 0.571** 1
8. Fluency Spring 0.436** 0.575** 0.430** 0.595** 0.594** 0.632** 0.749** 1
Year 3 1 2 3 4 5 6 7 8
1. Spelling Fall 1
2. Spelling Spring 0.678** 1
3. Pseudo-word Fall 0.472** 0.534** 1
4. Pseudo-word Spring 0.504** 0.554** 0.723** 1
5. Sight-word Fall 0.445** 0.458** 0.495** 0.576** 1
6. Sight-word Spring 0.429** 0.502** 0.520** 0.663** 0.712** 1
7. Fluency Fall 0.518** 0.502** 0.523** 0.613** 0.710** 0.667** 1
8. Fluency Spring 0.496** 0.460** 0.488** 0.570** 0.593** 0.679** 0.665** 1
[image:17.595.61.532.236.696.2]DOI: 10.4236/als.2019.74013 210 Advances in Literary Study
Figure 3. Means of the measured variables by time of year by year.
ij i i i ij
Y = + +µ τ βX +ε
(Yij = Spring Measure; τi = Year; βiXi = Fall Measure)
Utilizing the fall measure as a covariate in each of the models controls for any variability between the years resulting from the pretest (Fall measure). The ANCOVA controls for any differences in the outcomes (spring measure) that may be attributable to the fall measure. ANCOVA is an efficient method for iso-lating a treatment effect and the use of pretest scores is an effective covariate when the purpose of the model is to examine post-test variability (Yang & Tsia-tis, 2001). In practical terms, the ANCOVA adjusts the data such that the differ-ent starting points (fall measures) do not impact the observed differences in the spring measures. The slopes shown in Table 6 represent the within year com-parison (fall to spring). In all years the slopes are statistically significant (p < 0.001) indicating a significant increase in the spring scores compared to those from the fall.
4.3. Research Question Three
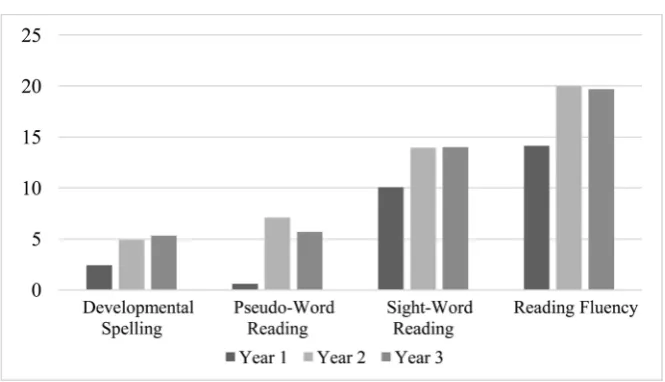
Research question three asks if the rate of student learning on the measured va-riables changed by year? In other words, for each of the measured vava-riables did students acquire the same amount of learning each year or were some years more productive than others? It may be inferred that the greater the value of the slope estimate the greater the rate or magnitude of learning. Equality of slopes by year would indicate an equal amount of learning took place while statistically significant differences between the slopes would indicate student learning dif-fered. Figure 4 plots the mean growth by variable while Figure 5 plots the slope coefficient estimates by year for each of the four student outcomes.
DOI: 10.4236/als.2019.74013 211 Advances in Literary Study
[image:19.595.232.518.283.441.2]Figure 4. Mean growth by year by variable.
Figure 5. Slope coefficient estimates by year by measure.
software to construct a dummy variable for year. Next, new variables were created to estimate the interaction of the year*fall measure. The new terms were then used in a dummy regression to predict the spring measure (outcome). This re-sulted in the equation:
0 1 1 2 2 3 1 2
ij ij
Y =β +β X +β X +β X X +ε
(Spring Measure, β1 1X = Dummy variable for year, β2X2 = Fall measure, and β3 1X X2 = Interaction of Year*Fall measure)
DOI: 10.4236/als.2019.74013 212 Advances in Literary Study
Table 6. Unstandardized slope coefficient estimates from analysis of covariance (ANCOVA)
by variable by spring of year.
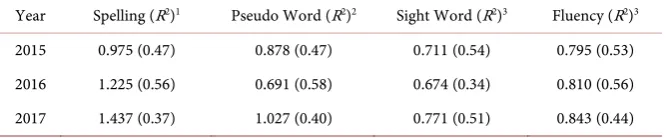
Year Spelling (R2)1 Pseudo Word (R2)2 Sight Word (R2)3 Fluency (R2)3
2015 0.975 (0.47) 0.878 (0.47) 0.711 (0.54) 0.795 (0.53)
2016 1.225 (0.56) 0.691 (0.58) 0.674 (0.34) 0.810 (0.56)
2017 1.437 (0.37) 1.027 (0.40) 0.771 (0.51) 0.843 (0.44)
Notes. All R2 values are significant at p < 0.001. 1Spelling slope coefficient for the three years are statistically
different from each other, F (2, 1257) = 12.6, p ≤ 0.001; 2Pseudo-Word slope coefficients for the three years
are statistically different from each other, F (2, 1256) = 16.1, p ≤ 0.001; 3Slope coefficients for the three years
are not statistically different from each other.
those for both 2016 (slope = 1.225), (t (3, 799) = 2.55, p = 0.001) and 2017 (slope = 1.437), (t (3, 848) = 5.65, p ≤ 0.001) while the 2016 slope was statistically equal to that of 2017 (t (3, 867) = −0.178, p = 0.075). In other words, the magnitude of change for spelling knowledge in 2016 was 26% over 2015, while the 2017 mag-nitude was 47% higher than 2015. For pseudo-word reading the 2015 slope of 0.878 exceeded that of 2016 (slope = 1.225), (t (3, 798) = 2.65, p = 0.008) while the 2017 slope of 1.027 exceeded those of 2015 (t (3, 848) = 2.17, p = 0.029) and 2016 (t (3, 866) = 5.09, p ≤ 0.001). For pseudo-word reading the magnitude of growth between 2015 and 2016 dropped by 21.3% while 2017 was 17% greater than 2015. Analysis of the slope coefficients for sight-word reading and reading fluency resulted in no between-year differences meaning the magnitude of learning for each year was similar.
5. Discussion
curri-DOI: 10.4236/als.2019.74013 213 Advances in Literary Study culum was moderated to reflect greater emphasis on phonological awareness and letter-feature analysis. While this may have contributed to the decline in Year 2 comprehension gains seen on the teacher knowledge instrument, it may have also improved developmental spelling scores in the two succeeding years. The curriculum was adjusted in preparation for Year 3 to include additional com-prehension material which was reflected in end of Year 3 LIKS increases in comprehension knowledge. Also, in the second year additional emphasis was put on the use of the Developmental Spelling Inventory (DSA) as a diagnostic tool to clearly understand what students understood and needed to learn regarding let-ter-sound correspondence. In the second and third years of training teachers were taught to use the DSA feature inventories (letter-name, within-word, sylla-ble juncture, and derivational constancy) as a tool to diagnose and group stu-dents for differentiated word work instruction.
Our results for research question two are reported in Table 6 and show large regression coefficients for each measured outcome across all three years. A study by Paige et al., (2019) used path analysis to model the contribution of develop-mental spelling and found it contributed significant, unique variance, beyond even reading fluency, to achievement on the end-of-year state reading assess-ment. This finding provides evidence that developmental spelling is critical to reading achievement. The results of this study show that end of Year 1 develop-mental spelling means were equal to 5.51 (2.57) showing that as a group, stu-dents were exiting the letter-naming stage and entering the within-word spelling stage. While this level of spelling understanding may reflect appropriate devel-opment for end-of-year first-grade students, it is inadequate for third-graders who are likely to receive little phonics instruction in fourth-grade and beyond. In Year 1 we also saw pseudo- and sight-word reading attainment scores of 17.95 (5.34) and 48.50 (7.98) respectively, both of which are commensurate with the 14th percentile. End-of-first-year reading fluency was 73.31 (17.50), a score
ap-proximating the 23rd percentile on the Hasbrouck & Tindal (2006) reading
norms. In total these measures suggest a group of students with an insufficient understanding of the sound structure of words that resulted in poor word read-ing and languid readread-ing fluency.
re-DOI: 10.4236/als.2019.74013 214 Advances in Literary Study spectively. These results represent attainment at the 25th (pseudo-word) and 32nd percentiles (sight-word) reflecting increases from end-of-year-one
percen-tiles at the 14th and 23rd percentiles respectively. While reading accumaticity
(CWPM) at the end of year one was at the 23rd percentile, year two and three
re-sults showed scores of 86.56 (24.04) and 85.72 (27.36) respectively, reflecting at-tainment at approximately the 43rd percentile for both. Although we do not have
a direct measure of classroom reading instruction, we take the year 2 and 3 in-creases across the measured variables as indirect evidence that instruction im-proved. We think it is unlikely that given the large sample sizes across the three years that students independently improved with no instructional input.
Beyond quantifying the descriptive changes occurring in all four of the read-ing outcomes, our third research question explored whether the magnitude of learning differed by year. Our analysis of covariance (ANCOVA) results revealed that the regression slopes were significantly different across the three years for two of the reading outcome variables. While the plots in Figure 4 for spelling development and pseudo-word reading show clear differences in the magnitude of growth between years, those for sight-word reading and fluency clearly do not. We interpret the between-year increases in the magnitude of spelling know-ledge growth as evidence that students learned at increasingly faster rates. While we cannot make a causal claim, we interpret this as suggesting teachers became increasingly proficient with instructional practices that encourage letter-feature development in students. As pseudo-word reading reflects the ability of students to apply their letter-feature knowledge to decode words, the increases in 2017 over 2015 suggests growth in the magnitude of student learning. The 2014 to 2015 reduction in the regression coefficient for pseudo-word learning is difficult to explain as there could be numerous reasons. The regression coefficients for sight-word reading and fluency also show significant growth for each year, al-though differences suggesting increasingly faster between-year growth were not found.
ac-DOI: 10.4236/als.2019.74013 215 Advances in Literary Study tually reading appropriate connected texts, the complexity of text that students are asked to read, the amount and quality of teacher feedback provided to stu-dents, the materials teachers use to implement instruction, and the fidelity with which teachers implement a teaching and learning cycle. We suggest it is rea-sonable to expect that teachers differ in the quality with which they implement these and other instructional indicators and that these differences account for common variation that affects student outcomes. It follows then that determin-ing which indicators account for the greatest variation in student learndetermin-ing, and then bringing them into statistical control may lead to reading achievement gains. We posit that a continuous quality improvement process (which implies it is guided by appropriate measurement) can provide a school with a proven, re-liable, and predictable process that puts it in control of instructional improve-ment and student outcomes.
6. Primary Contribution of the Research
This study contributes to the research base in four ways. First, the study shows that improving in-service teacher knowledge of core reading and pedagogy prac-tices is possible through a focused curriculum. Second, the results show that it takes time for teacher knowledge and practice to change. In other words, changes in student outcomes do not come quickly as teacher must first become comfortable with new understandings about reading and changes to their peda-gogy. Third, the study shows that improving decoding knowledge at scale, as in-dicated by the statistically significant increases in spelling development and pseudo-word reading across 63 schools and 165 teachers, is possible. Fourth, the similar results in Years 2 and 3 effectively represents a replication of the Project that provides evidence suggesting the efficacy of the curricular focus and content taken by Project designers.
7. Conclusion
be-DOI: 10.4236/als.2019.74013 216 Advances in Literary Study gin to understand, as Deming (1980) suggests, that first knowing what to do and then doing it well is critical to helping their students become better readers.
Given the reviewed research suggesting teachers are poorly prepared to teach reading to students at-risk for reading failure, combined with data showing too many students are underachieving in reading, leads to the consideration that the current reading teacher preparation model is insufficient (Licklider, 1997). Much as a medical student who just received an M.D. degree is not ready to practice without several years of residency training, graduation from a teacher prepara-tion program can provide at best, a start at becoming a skilled reading teacher. It may be that becoming competent in the practice of reading instruction requires much more than preparation programs can provide under the current model. Long-term and consistently poor national and state-level reading results support the notion that post-certification PD is not improving reading outcomes. As Project implementation began we were surprised at the poor level of core read-ing knowledge across one of the country’s great city school districts. From the central office and senior administrator level down to the building level, deep li-teracy knowledge was universally absent. Even more problematic was the pres-ence of instructional ideas that were at odds with what we know about how hu-mans read and how best to teach its acquisition. Our efforts suggest to us that teachers of students at-risk for reading failure are in need of long-term, high-level “residency” training under highly knowledgeable coaches employing best prac-tices within a proven quality improvement system. While the question remains of how best to deliver such training we suggest that the model presented in the present study is a beginning.
8. Limitations
DOI: 10.4236/als.2019.74013 217 Advances in Literary Study allowed the measurement of change in teacher practice and modeling of its effect on student outcomes. In all, our study reflects the challenges of working within school districts where the desire for quickly improved outcomes on state assess-ments can be intense and the will and discipline to implement well-designed studies that can rigorously answer important questions is often lacking.
9. Future Research
Our results suggest research into the development of a continuous improvement system that can measure, analyze, and improve the indicators found to predict significant variance in reading instruction is needed. Much of the focus of read-ing research has been on the specification of the cognitive processes involved in reading and instructional strategies that facilitate growth in sub-processes such as phonological awareness, letter-sound learning, fluency, vocabulary, and com-prehension. Much less is known about how these strategies work coherently within a system of instruction whose objective is to get every student to at least, minimum levels of reading achievement that can facilitate academic success. This is an ambitious task that has yet to resonate on a general basis across the research community and school districts. If NAEP and state accountability re-sults are accepted as evidence of poor reading, we suggest it is time to move in the direction of the quality of improvement of reading instruction.
Conflicts of Interest
The authors declare no conflicts of interest regarding the publication of this pa-per.
References
Anderson, R. C., Hiebert, E. H., Wilkinson, I. A. G., & Scott, J. (1985). Becoming a Nation of Readers: The Report of the Commission on Reading. Washington DC: National In-stitute of Education.
Applegate, A. J., & Applegate, M. D. (2004). The Peter Effect: Reading Habits and Atti-tudes of Teacher Candidates. The Reading Teacher, 57, 554-563.
Atteberry, A., & Bryk, A. (2011). Analyzing Teacher Participation in Literacy Coaching Activities. The Elementary School Journal, 112, 356-382.
https://doi.org/10.1086/661994
Bean, R. M., Swan, A. L., & Knaub, R. (2003). Reading Specialists in Schools with Exem-plary Reading Programs: Functional, Versatile, and Prepared. The Reading Teacher, 56, 446-455.
Biancarosa, G., Bryk, A. S., & Dexter, E. R. (2010). Assessing the Value-Added Effects of Literacy Collaborative Professional Development on Student Learning. Elementary School Journal, 111, 7-34.https://doi.org/10.1086/653468
Binks-Cantrell, E., Washburn, E. K., Joshi, R. M., & Hougen, M. (2012). Peter Effect in the Preparation of Reading Teachers. Scientific Studies of Reading, 16, 526-536. https://doi.org/10.1080/10888438.2011.601434
DOI: 10.4236/als.2019.74013 218 Advances in Literary Study https://doi.org/10.1080/0969595980050102
Blair, T. R., Rupley, W. H., & Nichols, W. D. (2007). The Effective Teacher of Reading: Considering the “What” and “How” of Instruction. Reading Teacher, 60, 432-438. https://doi.org/10.1598/RT.60.5.3
Blank, R. K., & de las Alas, N. (2009). Effects of Teacher Professional Development on Gains in Student Achievement. Washington DC: Council of Chief State School Offic-ers. http://ccsso.org/Documents/2009/Effects_of_Teacher_Professional_2009.pdf Bryk, A. S. (2014). 2014 AERA Distinguished Lecture: Accelerating How We Learn to
Improve. Educational Researcher, 44, 467-477. https://doi.org/10.3102/0013189X15621543
Bush, R. N. (1984). Effective Staff Development in Making Schools More Effective: Pro-ceedings of Three State Conferences. San Francisco, CA: Far West Laboratory. http://files.eric.ed.gov/fulltext/ED249576.pdf
Cohen, D. K. (1990). A Revolution in One Classroom: The Case of Mrs. Oublier. Educa-tional Evaluation and Policy Analysis, 12, 311-329.
https://doi.org/10.3102/01623737012003311
Cohen, D. K., & Hill, H. C. (2001). Learning Policy: When State Education Reform Works. New Haven, CT: Yale University Press.
https://doi.org/10.12987/yale/9780300089479.001.0001
Cohen, D. K., Raudenbush, S., & Ball, D. (2000). Resources, Instruction and Research. A Working Paper from the Center for Teaching Policy.
Cohen, J. (1988). Statistical Power Analysis for the Behavioral Sciences (2nd ed.). Hillsdale, NJ: Erlbaum.
Corcoran, T. B., McVay, S., & Riordan, K. (2003). Getting It Right: The MISE Approach to Professional Development. CPRE Research Report Series RR-55.
https://doi.org/10.12698/cpre.2003.rr55
https://repository.upenn.edu/cpre_researchreports/42/
Cornett, J., & Knight, J. (2009). Research on Coaching. In J. Knight (Ed.), Coaching: Ap-proaches and Perspectives (pp. 192-216). Thousand Oaks, CA: Corwin Press.
Darling-Hammond, L., Wei, R. C., Andree, A., Richardson, N., & Orphanos, S. (2009). Professional Learning in the Learning Profession: A Status Report on Teacher Devel-opment in the United States and Abroad. Oxford, OH: National Staff Development Council.
Davis, M. H., McPartland, J. M., Pryseski, C., & Kim, E. (2018). The Effects of Coaching on English Teachers’ Reading Instruction Practices and Adolescent Students’ Reading Comprehension. Literacy Research and Instruction, 57, 255-275.
https://doi.org/10.1080/19388071.2018.1453897
Deming, W. E. (2000). Out of the Crisis. Cambridge, MA: MIT Press.
Deno, S. L. (1985). Curriculum-Based Measurement: The Emerging Alternative. Excep-tional Children, 52, 219-232.https://doi.org/10.1177/001440298505200303
Deno, S. L., Mirkin, P. K., & Chiang, B. (1982). Identifying Valid Measures of Reading. Exceptional Children, 49, 36-45.https://doi.org/10.1177/001440298204900105
Desimone, L. M. (2009). Improving Impact Studies of Teachers’ Professional Develop-ment: Toward Better Conceptualizations and Measures. Educational Researcher, 38, 181-199.https://doi.org/10.3102/0013189X08331140
DOI: 10.4236/als.2019.74013 219 Advances in Literary Study https://doi.org/10.3102/01623737024002081
Dole, J. A. (2004). The Changing Role of the Reading Specialist in School Reform. The Reading Teacher, 57, 462-471.
Dorph, R., Goldstein, D., Lee, S., Schneider, L, K., & Venkatsesan, S. (2007). The Status of Science Education in the Bay Area: Research Brief. Berkeley, CA: Lawrence Hall of Science, University of California.
Ehri, L. C. (1993). How English Orthography Influences Phonological Knowledge as Children Learn to Read and Spell. In R. J. Scales (Ed.), Literacy and Language Analysis (pp. 21-43). Hillsdale, NJ: Lawrence Erlbaum Associates.
Elmore, R. F. (2002). Bridging the Gap between Standards and Achievement: The Imper-ative for Professional Development in Education. Washington DC: Albert Shanker In-stitute.
Ermeling, B. (2009). Tracing the Effects of Teacher Inquiry on Classroom Practice. Teach-ing and Teacher Education, 26, 377-388.https://doi.org/10.1016/j.tate.2009.02.019 Feldman, J., Schneck, A., Feighan, K., Coffey, D., & Rui, N. (2011). Memphis Striving
Readers Project, Evaluation Report Year 4. Research for Better Schools & RMC Re-search Corporation.
Flesch, R. (1955). Why Johnny Can’t Read. New York: HarperCollins.
Foorman, B., Beyler, N., Borradaile, K., Coyne, M., Denton, C. A., Dimino, J. et al. (2016). Foundational Skills to Support Reading for Understanding in Kindergarten through 3rd Grade (NCEE 2016-4008). Washington DC: National Center for Education Evalua-tion and Regional Assistance (NCEE), Institute of EducaEvalua-tion Sciences, U.S. Depart-ment of Education.
French, V. W. (1997). Teachers Must Be Learners, too: Professional Development and National Teaching Standards. NASSP Bulletin, 81, 38-44.
https://doi.org/10.1177/019263659708158507
Fuchs, L. S., Fuchs, D., Hosp, M. K., & Jenkins, J. R. (2001). Oral Reading Fluency as an Indicator of Reading Competence: A Theoretical, Empirical, and Historical Analysis. Scientific Studies of Reading, 5, 239-256.https://doi.org/10.1207/S1532799XSSR0503_3 Gamse, B. C., Jacob, R. T., Horst, M., Boulay, B., & Unlu, F. (2008). Reading First Impact
Study Final Report (NCEE 2009-4038). Washington DC: National Center for Educa-tion EvaluaEduca-tion and Regional Assistance, Institute of EducaEduca-tion Sciences, U.S. Depart-ment of Education.
Ganske, K. (1994). Developmental Spelling Analysis: A Diagnostic Measure for Instruc-tion and Research. Unpublished Doctoral Dissertation. Charlottesville, VA: University of Virginia.
Ganske, K. (2014). Word Journeys: Assessment-Guided Phonic, Spelling, and Vocabulary Instruction (2nd ed.). New York: The Guilford Press.
Garet, M. S., Cronen, S., Eaton, M., Kurki, A., Ludwig, M., Jones, W. et al. (2008). The Impact of Two Professional Development Interventions on Early Reading Instruction and Achievement (NCEE Report 2008-4031). Washington, DC: National Center for Educational Evaluation and Regional Assistance, Institute of Education Sciences. Garet, M. S., Porter, A., Desimone, L., Birman, B., & Yoon, K. S. (2001). What Makes
Professional Development Effective? Results from a National Sample of Teachers. Amer-ican Educational Research Journal, 38, 915-945.
https://doi.org/10.3102/00028312038004915
DOI: 10.4236/als.2019.74013 220 Advances in Literary Study Statistics, 89, 134-150.https://doi.org/10.1162/rest.89.1.134
Graesser, A. C., McNamara, D. S., & Kulikowich, J. M. (2011). Coh-Metrix: Providing Multilevel Analysis of Text Characteristics. Educational Researcher, 40, 223-234. https://doi.org/10.3102/0013189X11413260
Gulamhussein, A. (2013). Teaching the Teachers: Effective Professional Development in the Era of High Stakes Accountability. National School Board Association, Center for Public Education.
http://conference.ohioschoolboards.org/2017/wp-%20content/uploads/sites/17/2016/0 7/1pm111317A114Job-embedPD.pdf
Harris, D. N., & Sass, T. R. (2007). Teacher Training, Teacher Quality, and Student Achievement. (Working Paper #3). Washington DC: Calder Urban Institute, National Center for Analysis of Longitudinal Data in Education Research.
Hasbrouck, J., & Tindal, G. A. (2006). Oral Reading Fluency Norms: A Valuable Assess-ment Tool for Reading Teachers. The Reading Teacher, 59, 636-644.
https://doi.org/10.1598/RT.59.7.3
Henderson, E. H., & Templeton, S. (1986). A Developmental Perspective of Formal Spel-ling Instruction through Alphabet, Pattern, and Meaning. The Elementary School Journal, 86, 317-323.https://doi.org/10.1086/461451
Huang, L. (2014). Learning to Read with the Whole Language Approach: The Teacher’s View. English Language Teaching, 7, 71-77.https://doi.org/10.5539/elt.v7n5p71 Introduction to SAS. UCLA: Statistical Consulting Group.
https://stats.idre.ucla.edu/sas/modules/sas-learning-moduleintroduction-to-the-feature s-of-sas/
Jimenez, R. T. (1997). The Strategic Reading Abilities and Potential of Five Low-Literacy Latina/o Readers in Middle School. Reading Research Quarterly, 32, 224-243. https://doi.org/10.1598/RRQ.32.3.1
Kato, T., & Manning, M. (2007). Content Knowledge—The Read Reading Crisis. Child-hood Education, 83, 238-239.https://doi.org/10.1080/00094056.2007.10522922 Kennedy, M. M. (1998). Form and Substance in in-Service Teacher Education. Madison,
WI: University of Wisconsin National Institute for Science Education. https://www.msu.edu/~mkennedy/publications/valuePD.html
Kennedy, M. M. (2016). How Does Professional Development Improve Teaching? Review of Educational Research, 86, 945-980. https://doi.org/10.3102/0034654315626800 Kentucky Department of Education (2017). Kentucky Department of Education School
Report Card 2016-17.https://education.ky.gov/AA/distsupp/Pages/SRC.aspx
Kentucky General Assembly (1990). “Kentucky Education Reform Act of 1990.” Regular Session 1990, House Bill 940, Section 104. Frankfort, KY:Kentucky General Assembly. Lewis, C. (2009). What is the Nature of Knowledge Development in Lesson Study?
Edu-cational Action Research, 17, 95-110.https://doi.org/10.1080/09650790802667477 Licklider, B. L. (1997). Breaking Ranks: Change the in-Service Institution. NASSP
Bulle-tin, 81, 9-22.https://doi.org/10.1177/019263659708158504
Luft, J. A., & Hewson, P. W. (2014). Research on Teacher Professional Development in Science. In N. G. Lederman, & S. K. Abel (Eds.), Handbook of Research on Science Education (Vol. 2, pp. 889-910). New York: Routledge.
DOI: 10.4236/als.2019.74013 221 Advances in Literary Study (2008). Supporting Literacy across the Sunshine State: A Study of Florida Middle School Reading Coaches. Santa Monica, CA: RAND.
McGlinchey, M. T., & Hixson, M. D. (2004). Using Curriculum-Based Measurement to Predict Performance on State Assessments in Reading. School Psychology Review, 33, 193-203.
MetaMetrics (2016). The Lexile Framework for Reading. https://www.lexile.com/analyzer/
Moats, L. C. (2004). The Professional Development of Reading Teachers. In P. McCardle, & V. Chhabra (Eds.), The Voice of Evidence in Reading Research. Baltimore, MD: Paul H. Brookes Publishing Co.
National Assessment of Educational Progress (NAEP) (2017). 2017 Reading Assessment. U.S. Department of Education, Institute of Education Sciences, National Center for Education Statistics, National Assessment of Educational Progress (NAEP).
https://www.nationsreportcard.gov/media.aspx
National Council of Teachers of Mathematics (1991). Commission on Teaching Stan-dards for School Mathematics: Professional StanStan-dards for Teaching Mathematics. Res-ton, VA: National Council of Teachers of Mathematics.
National Institute of Child Health and Human Development (2000). Report of the Na-tional Reading Panel: Teaching Children to Read: An Evidence-Based Assessment of the Scientific Research Literature on Reading and Its Implications for Reading Instruc-tion. Washington DC: U.S. Government Printing Office.
Newman, S. B., & Cunningham, L. (2009). The Impact of Professional Development and Coaching on Early Language and Literacy Practices. American Educational Research Journal, 46, 532-566.https://doi.org/10.3102/0002831208328088
Paige, D. D., Smith, G. S., Rasinski, T. V., Rupley, W. H., Magpuri-Lavell, T., & Nichols. W. D. (2019). A Path Analytic Model Linking Foundational Skills to Grade 3 State Reading Achievement. Journal of Educational Research, 112, 110-120.
https://doi.org/10.1080/00220671.2018.1445609
Penuel, W. R., Fishman, B. J., Gallagher, L, P., Korbak, C., & Lopez-Prado, B. (2009). What Makes Professional Development Effective? Strategies that Foster Curriculum Implementation. American Educational Research Journal, 44, 921-958.
https://doi.org/10.3102/0002831207308221
Peterson, P. L., & Comeaux, M. A. (1990). Evaluating the Systems: Teachers’ Perspectives on Teacher Evaluation. Educational Evaluation and Policy Analysis, 12, 3-24. https://doi.org/10.3102/01623737012001003
Rayner, K., Pollatsek, A., Ashby, J., & Clifton Jr., C. (2012). Psychology of Reading. New York: Psychology Press.
Reinking, D., & Bradley, B. A. (2004). Connecting Research and Practice Using Formative Design Experiments. In N. K. Duke, & M. H. Mallette (Eds.), Literacy Research Me-thodologies (pp. 149-169). New York: Guilford Press.
Reutzel, D. R., Dole, J. A., Fawson, P. C., Jones, C. D., Read, S., Fargo, J. D. et al. (2009). Connecting Primary Grade Teacher Knowledge to Primary Student Achievement: De-veloping an Evidence-Based Assessment Tool-The Literacy Instruction Knowledge Scales (LIKS). Washington DC: U.S. Department of Education, Institute of Education Sciences.