On: 17 March 2014, At: 10:51 Publisher: Taylor & Francis
Informa Ltd Registered in England and Wales Registered Number: 1072954 Registered office: Mortimer House, 37-41 Mortimer Street, London W1T 3JH, UK
International Journal of Digital Earth
Publication details, including instructions for authors and subscription information:http://www.tandfonline.com/loi/tjde20
Rating crowdsourced annotations:
evaluating contributions of variable
quality and completeness
Giles M. Foodya a
School of Geography, University of Nottingham, Nottingham, UK Accepted author version posted online: 16 Sep 2013.Published online: 15 Nov 2013.
To cite this article: Giles M. Foody (2013): Rating crowdsourced annotations: evaluating contributions of variable quality and completeness, International Journal of Digital Earth, DOI: 10.1080/17538947.2013.839008
To link to this article: http://dx.doi.org/10.1080/17538947.2013.839008
PLEASE SCROLL DOWN FOR ARTICLE
Taylor & Francis makes every effort to ensure the accuracy of all the information (the “Content”) contained in the publications on our platform. Taylor & Francis, our agents, and our licensors make no representations or warranties whatsoever as to the accuracy, completeness, or suitability for any purpose of the Content. Versions of published
Taylor & Francis and Routledge Open articles and Taylor & Francis and Routledge Open Select articles posted to institutional or subject repositories or any other third-party website are without warranty from Taylor & Francis of any kind, either expressed or implied, including, but not limited to, warranties of merchantability, fitness for a particular purpose, or non-infringement. Any opinions and views expressed in this article are the opinions and views of the authors, and are not the views of or endorsed by Taylor & Francis. The accuracy of the Content should not be relied upon and should be independently verified with primary sources of information. Taylor & Francis shall not be liable for any losses, actions, claims, proceedings, demands, costs, expenses, damages, and other liabilities whatsoever or howsoever caused arising directly or indirectly in connection with, in relation to or arising out of the use of the Content.
Commons Attribution License http://creativecommons.org/licenses/by/3.0/. However, authors may opt to publish under a Creative Commons Attribution-Non-Commercial License http://creativecommons.org/licenses/by-nc/3.0/ Taylor & Francis and Routledge Open Select articles are currently published under a license to publish, which is based upon the Creative Commons Attribution-Non-Commercial No-Derivatives License, but allows for text and data mining of work. Authors also have the option of publishing an Open Select article under the Creative Commons Attribution License http:// creativecommons.org/licenses/by/3.0/.
It is essential that you check the license status of any given Open and Open Select article to confirm conditions of access and use.
Rating crowdsourced annotations: evaluating contributions of variable
quality and completeness
Giles M. Foody*
School of Geography, University of Nottingham, Nottingham, UK
(Received 27 March 2013; accepted 23 August 2013)
Crowdsourcing has become a popular means to acquire data about the Earth and its environment inexpensively, but the data-sets obtained are typically imperfect and of unknown quality. Two common imperfections with crowdsourced data are the contributions from cheats or spammers and missing cases. The effect of the latter two imperfections on a method to evaluate the accuracy of crowdsourced data via a latent class model was explored. Using simulated and real data-sets, it was shown that the method is able to derive useful information on the accuracy of crowdsourced data even when the degree of imperfection was very high. The practical potential of this ability to obtain accuracy information within the geospatial sciences and the realm of Digital Earth applications was indicated with reference to an evaluation of building damage maps produced by multiple bodies after the 2010 earthquake in Haiti. Critically, the method allowed data-sets to be ranked in approximately the correct order of accuracy and this could help ensure that the most appropriate data-sets are used.
Keywords:volunteered geographic information; accuracy; error
1. Introduction
Crowdsourcing has become a popular means to acquire data on a wide range of phenomena and has the potential to play a major role in relation to the various aspects of the Digital Earth and its applications (Georgiadou, Lungo, and Richterin press; Mooney and Corcoran in press). Crowdsourcing projects vary in nature (Estelles-Arolas and Gonzalez-Ladron-de-Guevara 2012) but thrive across a vast array of disciplines from astronomy (Raddick and Szalay 2010), through neogeography (Neis, Zielstra, and Zipf
2012; Foody and Boyd2013) to zoology (Wiersma2010; Newell, Pembroke, and Boyd
2012). Within the realm of the Digital Earth, crowdsourcing has considerable scope for growth as the potential for volunteered geographic information (VGI) becomes increasing apparent with the rise of citizen sensors (Goodchild 2007) and is a central feature of priority topics such as grand challenges for the geographical sciences (CSDGSND2010; Craglia et al.2012).
The nature of the data acquired varies, but one popular application is to use crowdsourcing to label cases of the phenomenon of interest. For example, it is common for crowdsourcing projects to seek annotations such as class labels from photographs, in which cases of the phenomenon of interest are given a class label. If the photographs are geographically referenced, this provides one basis for the acquisition of VGI (Antoniou,
*Email:[email protected]
© 2013 The Author(s). Published by Taylor & Francis.
This is an Open Access article. Non-commercial re-use, distribution, and reproduction in any medium, provided the original work is properly attributed, cited, and is not altered, transformed, or built upon in any way, is permitted. The moral rights of the named author(s) have been asserted.
Morley, and Kaklay2010). For example, photographs acquired at the intersection of lines of latitude and longitude through the Degrees of Confluence project have been used to provide crowdsourced data on land cover (Iwao et al. 2006; Foody and Boyd 2013). Additionally, this type of activity is aided by a range of Internet-based systems such as the Amazon Mechanical Turk online labour market (https://www.mturk.com/mturk/ welcome). With the latter, a large task can be offered out to a large group of contributors with each, for example, undertaking a small part of the work in return for a small payment (Snow et al.2008; Welinder et al.2010). Similarly, Internet-based projects such as the geo-wiki seek volunteers to interpret satellite sensor images of selected locations of the Earth such that land cover class labels may be applied to them (Fritz et al2012). As data about the Earth and digital representations become more abundant, Digital Earth applications need to be able to effectively convert often large data volumes into meaningful information (Li et al.in press; Ajmar et al.in press).
Key attractions of crowdsourcing are the potential to acquire large data-sets cheaply, if not freely, and quickly (Snow et al. 2008; Raykar and Yu 2012). Moreover, the volunteers may also contribute to important applications such as those associated with natural disasters and their impacts (Gao, Barbier, and Goolsby 2011; van Aardt et al.
2011), which is recognised as a research frontier in the geographical sciences (Goodchild and Glennon 2010) and an important application in the context of the Digital Earth (Carrion et al.in press). The value of the volunteered data is, however, a function of its quality. Although some studies have shown that the quality of the data derived can be as good as that from expert annotators (Welinder et al.2010), concerns about the quality of crowdsourced data abound (Flanagin and Metzger 2008; Roman 2009; Fichman 2011; Yaari, Baruchson-Arbib, and Bar-Ilan 2011; Fowler et al. 2013). These concerns are significant across the spectrum of possible applications. Errors in the training data used to classify remotely sensed data may, for example, degrade the ability to map and monitor land cover (Townshend et al. 2012). A particular concern is when there is information provided by a variety of sources. For example, in relation to post-disaster relief applications, it has become evident that the large amounts of data provided by a variety of agencies can be a source of problems due to the different and sometimes conflicting information provided (Shan, Eguchi, and Jones2011; Voigt et al.2011; Carrion et al.in press). Making full use of crowdsourced information represents a major scientific challenge (CSDGSND2010; Voigt et al.2011), and one step in the process to addressing this challenge is to provide a means to evaluate the quality of the data contributed in order to aid its optimal use within the context of the Digital Earth (Craglia et al.2012; Carrion et al.in press). In some cases, the desire is not necessarily to have a rigorous assessment of data quality but the provision of some, even qualitative, information on map quality to assist map users (van Aardt et al. 2011; Tiede et al. 2011). The disaster response chain would, for example, benefit greatly from such information on data quality, but it is often not provided as a core focus is often on the rapid provision of data to inform response activity (Carrion et al.in press). Map validation, therefore, remains a critical concern and a challenge for the producers and users of maps. Often, the ability to undertake a traditional accuracy assessment, based on high-quality ground reference data, is impractical (Carrion et al. in press). The development of new tools and devices may help to provide useful field data for map validation activities (Ajmar et al.in press), but alternative methods may also aid the evaluation of maps, especially if derived from different sources such as crowdsourcing projects or even different authoritative agencies. While it is true that conventional approaches to evaluate the quality of digital map
representations used in Digital Earth applications that are founded on design-based inference require ground data (Carrion et al.in press), this does not mean that accuracy assessment is impossible as model-based methods can allow evaluation without ground data (Foody2012).
The contributors submitting data to a crowdsourcing project may differ greatly in motivation and skill and so can vary from experts to novices with possible inputs from people who make malicious contributions as well as those from spammers (Shachaf and Hara2010; Brabham2012; Hirth, Bobfeld, and Tran-Gia2012; Kazai, Kamps, and Milic-Frayling2012; Naroditskiy et al.2012; Neis, Goetz, and Zipf2012; Raykar and Yu2012; Fowler et al. 2013). Thus, there is commonly a degree of disagreement between annotators contributing data (Raykar et al.2010). The quality of the data provided by an individual contributor may also vary within a task as the person may find some aspects of the task more challenging than others (Welinder et al.2010; Foody et al.Submitted) and may learn to label by experience. Indeed, annotators may vary greatly in how they reach decisions, some, for example, may be relatively intolerant to false positives while others willing to accept a proportion if it yields a high detection rate (Welinder et al.2010). So while crowdsourced data-sets can potentially be made up of contributions that are mainly of a high quality, with only a small proportion from poor or sloppy contributors, and be as good as data derived mainly from experts (Welinder et al.2010; Brabham2012), it is also possible for them to be comprised predominantly of low-quality data. For example, data-sets could be dominated by contributions from cheaters or spammers, who randomly assign labels (Hirth, Bobfeld, and Tran-Gia2012; Raykar and Yu2012).
Critically, in many cases, the end-user of the derived data has little or no control over the contributors and has no or negligible information on data quality. Additionally, there is often no obvious way to discriminate between contributors and their data in cases of conflict in labelling. In situations in which there are labels derived from multiple contributors, it is possible to use, for example, the majority vote system to determine a label, but this treats all annotators equally and is of little value if the vast majority of the contributions are of low quality (Raykar and Yu2012). If the identity of a contributor is known, it may be possible to build up levels of trust in their work over time and rate by reputation (Fichman 2011). There are still, however, concerns such as how a rated contributor copes with cases of new, previously unseen classes. Some Internet-based projects use editors as gatekeepers to help quality control. Again, there are concerns and no simple link between accuracy and aspects of editorial activity (Yaari, Baruchson-Arbib, and Bar-Ilan 2011). Alternatively, it may be possible to use other means of checking the credibility of the data. For example, with VGI that have become an important component of the Digital Earth, a range of approaches can be used to aid in quality assurance including assessments of the sense of the data relative to existing and trusted geographic contextual information (Goodchild and Li2012). Critically, however, the quality of the contributed data is a key issue and the tension between wisdom of the crowd and mob rules is apparent in crowdsourcing projects (Roman 2009) making an ability to rate and rank contributors a desirable feature (Snow et al.2008; Welinder et al.
2010, Raykar and Yu 2012). In some applications, notably in relation to post-disaster response, the need for even quite basic characterisation of quality is established (Carrion et al.in press).
A variety of methods have been proposed to rate the quality of data derived from multiple contributors (Raykar et al.2010; Welinder et al.2010; Raykar and Yu2012). A simple alternative approach is to view the crowdsourced contributions as imperfect
indicators of the actual phenomenon under study and use a latent class analysis to reveal information on it and on the quality of the data provided by the contributors. Although researchers are aware of the potential of latent class modelling (Raykar et al.2010), it does not appear to have been used extensively in relation to crowdsourced data. In a previous study, it was shown that a latent class analysis could provide information on the quality of crowdsourced data and allowed contributors to be ranked in terms of the quality of their labelling (Foody et al.2013). This was, however, an exploratory analysis based upon a small set that may be unrepresentative of typical crowdsourced data-sets: the analysis was focused on data from a low number of volunteers, 7, and only a small amount, <2%, of cases were missing. Volunteers vary greatly in features such as motivation, skill level and time to contribute, and hence, it is common to find that while many people may contribute to a project, most of the data comes from a relatively small number of people (Mooney and Corcoran 2012). Additionally, although there are sometimes barriers to involvement (Haklay 2013), it is generally relatively easy to contribute data as barriers are often low and so, it is perhaps inevitable that at least some of the people providing data will have undesirable characteristics. The latter may vary greatly in nature, from well-meaning people who have little ability through to people who will set out to damage a project with malicious intent. Recognising that real crowdsourced data-sets often contains a large proportion of missing cases and may have numerous contributors which may possibly be dominated by spammers or other problematic sources (Raykar et al. 2010; Raykar and Yu 2012; Neis, Goetz, and Zipf
2012), the aim of this study is to explore the potential of latent class analysis to situations in which a large proportion of data may be from poor sources (e.g. spammers) and/or be incomplete. While the latent class analysis should be viable with some missing data (Vermunt1997), its sensitivity to differing degrees of incompleteness within potentially very noisy data-sets is uncertain. This work, therefore, develops previous studies and explores the effect of missing data on the estimates obtained from a latent class analysis and the ability to rate contributors such that the end-user might, for example, be able to disregard data provided by poor contributors in order to enhance data quality, identify and remove spammers or perhaps identify training needs.
2. Data
Real and simulated data-sets were used to explore the potential to rate and rank individual annotators contributing to crowdsourced data collection activities. The simulations allowed data with known properties to be analysed. Two of the real data-sets have been used in other studies on the rating of crowdsourced data and so provide a comparative context based on example applications that facilitate the comparison of ranking methods. The final real data-set arises from the unprecedented response of the geospatial science community to the 2010 earthquake in Haiti.
2.1. Simulated data
Building on earlier research (Foody2010), a series of simple binary classifications were generated. This series comprised data from what may be considered to be four genuine, albeit imperfect, annotators supplemented here with data from a further 18 spammers. The total data-set generated was, therefore, dominated by spammers, with a spammer viewed here as a source that provides, essentially, a random label. As spammers may vary in sophistication, the abundance or prevalence of the target class was also allowed to vary
over a range of prevalence. Thus, each simulated spammer labelled a specified proportion of cases in the data-set as members of the target class but aside from this feature of the design, all allocations were made randomly.
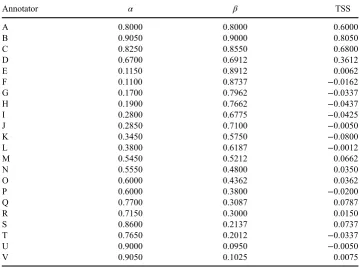
The data on the four genuine contributors were labelled A–D. These data-sets contained 1000 cases which were generated with known sensitivity (α, the true positive rate or the recall rate) and specificity (β, the true negative rate or 1-false alarm rate) for a scenario in which the prevalence was 0.2 (Table 1); in the terminology used widely in the geographical information science community, these measures equate to producer’s accuracy values (Liu, White, and Newell 2009). Here, the data for the 18 spammers, labelled E-V, were derived randomly using a binomial distribution with the prevalence ranging from 0.1 to 0.9 in 0.1 steps. At each setting of prevalence, two data-sets were generated to ensure that data from spammers would vastly dominate the final data-set. The quality of the labelling by each contributor can be characterised by their sensitivity and specificity which were also combined into the true skills statistic (TSS) or Youden’s J statistic to give a measure of overall classification accuracy (Allouche, Tsoar, and Kadmon2006) via
TSS¼aþb1 ð1Þ
With this measure, a perfect classification has a TSS = 1, while random allocation would be associated with TSS =∼0. The properties of the data-sets used are defined inTable 1. The data for A–D were also used to explore the effect of missing cases on the accuracy of estimation derived from the latent class model. The latter was achieved by randomly recoding some of the cases as missing. A series of scenarios were investigated. First, analyses were undertaken in which the data provided by annotators A–D were progressively degraded by randomly recoding 100 cases from contributor C as missing until only 100 cases (10% of the initial sample size) remained. Further scenarios were constructed in which cases from C and D were recoded as missing. Specifically, data-sets in which 10%, 20% and 50% of cases in C and D were recoded as missing were generated. This was done twice: once with the same cases coded as missing in the data from C and D and then with different cases in the data provided by C and D missing.
2.2. Real data
Three real data-sets were used. Two have been employed in other studies focused on the quality of crowdsourced data. A key feature of each is the availability of a reference data-set for validation purposes. The latter allows the accuracy of the data submitted by each contributor to be assessed, enabling the relative performance of contributors to be assessed and for contributors to be ranked in terms of the quality of their labelling. Additionally, as two of the data-sets have been used in other studies focused in the evaluation of the quality of crowdsourced data (e.g. Raykar and Yu 2012), their use allows comparison to other methods of ranking contributors by the quality of their labelling. The salient features of each data-set are outlined as follows.
The rating of annotators and identification of spammers was undertaken with the ‘bluebird’data-set (Raykar and Yu2012). This data-set comprises the response from 39 annotators of 108 images for a binary labelling task; annotators indicated the presence or absence of a bird species in photographs presented to them and there were no missing
cases. This data-set has been used previously in the rating of annotators by Raykar and Yu (2011,2012).
The effect of missing cases on the rating of contributed data was assessed using the ‘temp’data-set. This presents data on a binary classification task in which 462 cases were labelled by 76 annotators. Each case was labelled by 10 annotators with each annotator labelling an average of 61 cases (Raykar and Yu2012). This data-set was used by Raykar and Yu (2012) in a study that sought to rate annotators.
[image:8.493.66.426.111.378.2]The final data-set arises from the unprecedented response by the geospatial science community to the 2010 earthquake in Haiti (Duda and Jones 2011; Voigt et al. 2011; Ajmar et al. in press). The latter included maps of post-disaster building damage produced by a variety of different agencies, sometimes using crowdsourced data. Here, five building damage maps focused on Port-au-Prince were used and compared against the results of a ground-based survey that visited 98 buildings in the city to provide a reference data-set. A detailed description of each map is beyond the scope of this article, but the key details and an indicative reference for each of the five maps used are: (map a) a map derived from oblique, multi-perspective airborne imagery (Gerke and Kerle2011; the data used here were downloaded from http://www.istructe.org/resources-centre/ technical-topic-areas/eefit/haiti-photo-archive); (map b) a map derived through the
Table 1. The quality of the 22 contributors to the simulated data-set expressed in terms of sensitivity (α), specificity (β) and TSS. Contributors A–D represent the genuine, albeit imperfect, contributors (note, A D correspond to scenarios B, I, J and K defined in Foody2010) while E–V
were spammers who made random allocations.
Annotator α β TSS
A 0.8000 0.8000 0.6000
B 0.9050 0.9000 0.8050
C 0.8250 0.8550 0.6800
D 0.6700 0.6912 0.3612
E 0.1150 0.8912 0.0062
F 0.1100 0.8737 −0.0162
G 0.1700 0.7962 −0.0337
H 0.1900 0.7662 −0.0437
I 0.2800 0.6775 −0.0425
J 0.2850 0.7100 −0.0050
K 0.3450 0.5750 −0.0800
L 0.3800 0.6187 −0.0012
M 0.5450 0.5212 0.0662
N 0.5550 0.4800 0.0350
O 0.6000 0.4362 0.0362
P 0.6000 0.3800 −0.0200
Q 0.7700 0.3087 0.0787
R 0.7150 0.3000 0.0150
S 0.8600 0.2137 0.0737
T 0.7650 0.2012 −0.0337
U 0.9000 0.0950 −0.0050
V 0.9050 0.1025 0.0075
activities of the Global Earth Observation–Catastrophe Assessment Network which used inputs from over 600 people in 23 countries (van Aardt et al.2011; the specific data used were downloaded from http://www.istructe.org/resources-centre/technical-topic-areas/ eefit/haiti-photo-archive); (map c) a map produced by the Centre for Satellite based Crisis Information (ZKI) by a team using visual interpretation of satellite sensor images (Voigt et al. 2011; the specific data used were downloaded from http://www.zki.dlr.de/ article/1262); (map d) a map produced through the Global Monitoring for Environment and Security (GMES) Services for the Management of Operations, Situation Awareness and Intelligence for Regional Crisis (Tiede et al. 2011; the specific data used were downloaded fromhttp://spatial.telespazio.it/gmosaic_haiti/); and (map e) a map produced from WorldView-2 satellite and aerial survey imagery by the United Nations Institute for Training and Research’s (UNITAR) Operational Satellite Applications Programme (UNOSAT) (Duda and Jones2011; the specific data used were downloaded fromhttp:// www.unitar.org/unosat/node/44/1424). The ground reference data for 98 buildings arises from a survey undertaken by The Earthquake Engineering Field Investigation Team (Booth, Saito, and Madabhushi 2010). Post-disaster damage mapping from remotely sensed data is a challenging task with maps, such as those used here, often differing in relation to spatial detail, thematic legend or other basic issues (Kerle2010; Voigt et al.
2011; Carrion et al.in press). Critically, the maps do not show the exact same information but rather different representations of the same phenomenon: building damage. To enhance the degree of comparability of the maps, attention focused on only the most severely damaged buildings. To do this, the two most severe building damage classes in maps a, b, d and e were aggregated into one new class, considered here to indicate severely damaged buildings. Map c had a different legend and the class severely damaged buildings was taken to correspond to its ‘very strong’ damage class. Each of the 98 buildings visited in the field was also re-classified to show severely damaged buildings by aggregating the two most severely damaged classes in the original data-set. All 98 buildings in the reference data were identified in the damage maps except for map e, in which there was no data for 17 buildings.
3. Methods
3.1. Latent class model
A standard latent class model was used. This model had been used in earlier research with crowdsourced data (Foody et al.2013) and its general basis is re-stated here with further discussion provided in the literature (e.g. Rindskopf and Rindskopf 1986; Yang and Becker1997; Vermunt and Magidson2003, Magidson and Vermunt2004).
The latent class model is based on the probability of observing the patterns of class allocation made by the set of contributors to the crowdsourcing project. The group of contributors, C, were each presented with a set of cases to label. The set of labels provided by the contributors represent the manifest variables of the analysis and are used to provide information on the unobserved (latent) variable. Letting,Mcrepresents one of
the set of C manifest variables indexed 1 ≤ c ≤ C, and its values are class labels represented by mv which lie in the range r (1−q). Using vector notation M and m to
represent the complete response patterns (i.e.M denotes (M1,., Mc) andmdenotes (m1,. mq)), the latent class model is that the probability of obtaining the response pattern m, represented asP(M=m), is a weighted average of theqclass-specific probabilitiesP(M= m|T=t) (Magidson and Vermunt2004). On the assumption that the labels derived from
each contributor are conditionally independent of those from all others, the latent class model may be written as:
PðM¼mÞ ¼X q
t¼1
P Tð ¼tÞY C
c¼1
P Mð c¼mcjT ¼tÞ ð2Þ
where P(T = t) is the proportion of cases belonging to latent class t(Yang and Becker
1997; Vermunt1997; Vermunt and Magidson2003). The quality of the model is assessed typically with regard to a computed likelihood ratio chi-squared statistic, L2, obtained from a comparison of information on the pattern of labelling observed with that expected from the model. The model is normally viewed as providing a good fit if theL2value obtained is sufficiently small to be attributable to the effect of chance (i.e. p > 0.05; Magidson and Vermunt2004).
The only parameters of the latent class model in equation (2) are the latent class probabilities which provide useful information on the variable under investigation as well as of the quality of the contributing data sources. Specifically, the model parameterP(T= t) represents the probability of a case being a member of latent classtwhich, for a simple random sample, reflects directly the proportion of that class in the data-set which can be valuable in studies of prevalence. Of particular significance to this article, however, is that the model parameters representing the conditional probabilities include measures that equate the sensitivity and specificity of each contributing source of data (Yang and Becker 1997; Foody 2010, 2012). For example, when mc = t, the expression P
(Mc=mc|T=t) represents the sensitivity for class t in the data represented by Mc. Thus,
the parameters of the fitted latent class model include values that indicate the estimated sensitivity and specificity of each contributor. The model, therefore, provides a means to quantify the accuracy of each contributor and this arises without the need for any reference (truth) data. Thus, contrary to a widespread belief in the realm of the Digital Earth that ground reference data are essential for accuracy assessment (e.g. Carrion et al.
in press; Ajmar et al. in press), it is possible to derive estimates of data quality via a model-based method that exploits the large, but imperfect, data volumes that are sometimes available (Foody 2012). Since even a small amount of error in a ground reference data-set can be a large source of error in some studies (Foody2010,2013), the ability to make some assessments of data quality without reference data may be an attractive feature of the model for other studies and applications
3.2. Comparisons
Here, the sensitivity (α), specificity (β) and TSS were used to characterise the quality of the labelling provided by individual contributors. The quality of the data from each contributor was rated and ranked in terms of the sensitivity, specificity and associated TSS values obtained. The ranking derived by the latent class analysis was evaluated by comparison against reference data and the rankings derived from the application of other methods of rating crowdsourced contributions reported in the literature.
A variety of methods have been used to rate and rank data-sets contributed to crowdsourcing projects data-sets. Here, the latent class model-based approach was compared against methods used in ranking, crowdsourced data including research based on some of the data-sets used to aid comparison. Specifically, the results from the latent class analysis were compared against the results reported by Raykar and Yu (2011,2012).
Comparison of the annotator rankings derived from the latent class analysis was compared against those derived by Raykar and Yu (2012) with the bluebird and temp data-sets that was dominated by spammers. The approach proposed by Raykar and Yu (2012) was an empirical Bayesian method in which a spammer is defined as an annotator for which the TSS was <0.05; full details of the method are given in Raykar and Yu (2012). The selection of a specific score to act as a threshold to identify spammers is a relatively arbitrary, but the TSS-based score derived allows the quality of each contributing data source to be ranked. The rank order of the annotators was defined by Raykar and Yu (2012), using the lowest value of the 95% confidence interval estimated for each contributor and was compared against the rank order obtained from the results of the latent class analysis.
In another study, Raykar and Yu (2011) propose an entropic score as a means to rate and rank annotators. Again the details are presented in their article, but the basis of the method is to focus on the reduction in entropy that arises from the use of an annotator’s data. A score for each contributor may be derived and used to rank annotators. For the j-th annotator, the score was calculated from
sj¼1 N
XN
i¼1
H yð Þ i H yð ijyijÞ H yð Þi
ð3Þ
in whichNis the number of instances,H(yi) represents the entropy of the unknown labelyi
prior to observing any annotations andH yð ijyijÞis the entropy after observing the annotation ofyijfrom thej-th annotator. The basis of the method is that a spammer would allocate labels randomly and so does contribute any information to reduce the uncertainty in the labels and henceH yð ijyijÞ ¼H yð Þi yielding a score of 0 while an ideal annotator would reduce the uncertainty in the label reducingH yð ijyijÞto 0 and so produce a score of 1. Again, Raykar and Yu (2011) calculated a score for each annotator contributing to the analysis of the bluebird data-set and ranked them by the lower limit of the calculated 95% confidence interval for each annotator; further details on the method are given in Raykar and Yu (2011).
4. Results and discussion
Initial analyses used the simulated data-set and focused on the ranking of annotators in the presence of spammers before considering the effect of missing cases. A standard latent class model was formed using the data from each of the 22 contributors in the simulated data-set. This model appeared to fit the observed data, L2 = 10,508.4 (p >> 0.05), and so its parameters were extracted and compared against the relevant truth known for the simulated data used.
The first set of parameters in equation (2) yields an estimate of the prevalence. The value suggested by the latent class model was 21.2%, close to the actual value of 20.0%. The second set of parameters in equation (2) is the conditional probabilities which include estimates of the accuracy of each contributor; the set of conditional probabilities generated include values that represent the sensitivity and specificity of each contributor. The estimates derived from the latent class model were very similar to the actual values (Figure 1); the estimated and actual values of the sensitivity, specificity and TSS were all very highly correlated with r > 0.99. Additionally, the regression line fitted to each relationship was close to a 1:1 line that passes through the origin. Furthermore, in
Figure 1c, the four genuine, but imperfect, annotators are easily identifiable as the cases lying furthest from the origin. All the remaining contributors lie in the zone defined by an
estimated and actual TSS < 0.1. Only two of the latter cases had a TSS > 0.05 in the output of the latent class model, the threshold value used by Raykar and Yu (2012) to define a spammer. However, for these contributors, the highest TSS was 0.09 which would indicate a very low accuracy.
The results showed that the latent class model was able to provide accurate estimates of both the prevalence and the quality of each contributor in terms of the accuracy of their labelling even when the data-set was vastly dominated by spammers. The model
(a)
(b)
(c)
y = 0.9872x + 0.0083 R² = 0.9948
0.0 0.5 1.0
0.0 0.5 1.0
Estimated sensitivity
Actual sensitivity
y = 1.0049x – 0.0007 R² = 0.9996
0.0 0.5 1.0
0.0 0.5 1.0
Estimated specificity
Actual specificity
y = 0.9858x + 0.0043 R² = 0.9911
–0.1 0.1 0.3 0.5 0.7 0.9
–0.1 0.1 0.3 0.5 0.7 0.9
Estimated TSS
[image:12.493.118.379.56.507.2]Actual TSS
Figure 1. Relationship between estimated and actual accuracy values derived from analyses of the simulated data. (a) Sensitivity, (b) specificity and (c) TSS.
estimates were very highly correlated with the actual values and could form a basis for activities such as spammer identification. Critically, however, accurate estimates could be derived from data dominated by spammers.
Attention turned to the real data-set on bluebird annotations. Again a standard latent class model was generated using the data provided by all 39 annotators. As with the analyses of the simulated data, the parameters of the model that indicated the sensitivity and specificity of each contributor were extracted from the model. The sensitivity and specificity values were used to calculate the TSS for each contributor, enabling contributors to be ranked in terms of quality estimated from the latent class model-based approach. These rankings were then compared to the rank order generated for the data-set by Raykar and Yu (2011,2012) using the entropic score and empirical Bayesian-based methods, respectively.
The three sets of contributor rankings obtained were very similar (Figure 2). The degree of correspondence between the rankings was generally very high but degraded at the higher ranks (lower quality) where very small differences in magnitude could alter rank position substantially. In particular, it was evident that all three methods of ranking the contributors identified the same nine contributors as being of highest accuracy, albeit with slightly different order. Although the degree of correspondence between ranks declined at high ranks, there was still a large degree of correspondence at the low-quality end of the rankings. Indeed, the least accurate set of nine contributors defined by each approach to ranking had six contributors in common across the three approaches to ranking contributors.
Perhaps more important than the comparison between the different ranking methods, the TSS estimated from the latent class model approach was very highly correlated with the actual TSS,r> 0.95 (Figure 2c). The regression line between the estimated and actual TSS of the contributors was again close to a 1:1 line passing through the origin, highlighting that the model-based estimates were strongly related to the actual vales and of magnitude directly comparable to the actual values.
The latent class model-based approach appeared to perform comparably well to other methods of ranking contributors in terms of the quality of their labelling in the presence of spammers. As such, it provides a means to enhance analyses that use crowdsourced data. For example, the information on contributor quality may be used to enhance the accuracy with which a data-set is classified. As a guide to this, if the data from all 39 contributors to the bluebird identification task were used in a basic ensemble approach to classification, with each case allocated to the class with the dominant label, the resulting classification has TSS = 0.479. If, however, only the top five contributors identified by the latent class model-based approach were used, the accuracy of the resulting classification was markedly higher, TSS = 0.808. Critically, the focus on only quality annotators enables a more accurate classification to be derived and these high-quality annotators may be identified in the output of the latent class analysis without any reference (truth) data.
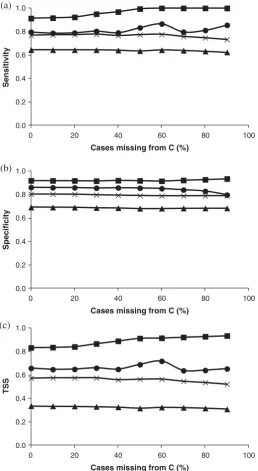
Thus far, the analyses had used complete data-sets, but many crowdsourced data-sets will contain missing cases. The effect of missing cases was explored with initial attention focused on the simulated data for the 4 genuine annotators (A-D) defined in Table 1. Incremental removal of cases from contributor C had only a relatively minor effect on the estimates of the sensitivity, specificity and TSS, which were shown above to be close to the actual values (Figure 3).
The effect of missing cases, while small, differed between the contributors. For contributor A, the estimated sensitivity and specificity remained close, within 0.01 of actual, until more than 50% of the cases from contributor C were missing. When most cases from contributor C were missing, the sensitivity, specificity and TSS all declined
(a)
(b)
(c)
0 10 20 30 40
0 10 20 30 40
Ran
k from
laten
t
class
model
Rank from Raykar and Yu (2011)
0 10 20 30 40
0 10 20 30 40
Ran
k
from
laten
t
class
model
Rank from Raykar and Yu (2012)
R² = 0.9475
–0.5 –0.3 –0.1 0.1 0.3 0.5 0.7 0.9
–0.4 –0.2 0.0 0.2 0.4 0.6 0.8 1.0
Estimated TS
S
[image:14.493.119.376.57.517.2]Actual TSS y = 0.9981x – 0.0701
Figure 2. Evaluation of the latent class model-based outputs and other ranking methods and actual TSS. (a) Comparison of the annotator ranks from the latent class model with those from Raykar and Yu (2011). (b) comparison of the annotator ranks from the latent class model with those from Raykar and Yu (2012) and (c) comparison of estimated and actual TSS.
slightly. For example, with 90% of the cases of contributor C missing, the TSS declined to 0.521 from its starting value of 0.572 when no cases were missing. For contributor B, the general trend for sensitivity, specificity and TSS was that the estimated values increased with an increase in the number of missing cases from contributor C. The TSS
(a)
(b)
(c) 0.0 0.2 0.4 0.6 0.8 1.0
0 20 40 60 80 100
Sensitivity
Cases missing from C (%)
0.0 0.2 0.4 0.6 0.8 1.0
0 20 40 60 80 100
Specificity
Cases missing from C (%)
0.0 0.2 0.4 0.6 0.8 1.0
0 20 40 60 80 100
TSS
[image:15.493.119.378.59.531.2]Cases missing from C (%)
Figure 3. Effects of missing cases on accuracy characterisation for sources A (crosses), B (squares), C (circles) and D (triangles). (a) Sensitivity, (b) specificity and (c) TSS.
rose from 0.832 with no cases missing to 0.934 with 90% of the cases from contributor C missing. With contributor D, the general effect of increasing the number of missing cases from contributor C was to decrease the values of sensitivity, specificity and TSS. The TSS declined from 0.335 to 0.307 as the percentage of missing cases from contributor C rose from 0 to 90%. Finally, the estimated values of the sensitivity, specificity and TSS for contributor C, whose data was subject to recoding as missing, there was a relatively high degree of variation as cases were progressively re-labelled as missing. For example, while the TSS with 0 and 90% of cases missing were relatively similar, at 0.657 and 0.652, respectively, they did vary over a range of 0.640–0.718 as the percentage of missing cases varied (Figure 3). Overall, it was apparent that missing data did impact upon the estimation of the quality of the contributed data. The variation was relatively small and, for the data considered, did not change the rank order of the contributors. Thus, the latent class approach seems able to derive useful information on the accuracy of the contributors that allows their accurate ranking even in the presence of missing cases. Further assessments were undertaken with the data from two contributors, C and D, missing. Again the effect of increasing missing cases varied on the values derived for the sensitivity, specificity and TSS of each contributor. Additionally, there were differences between the scenarios in which the same or different cases were labelled as missing in the data from contributors C and D (Table 2). Many of the trends noted when just cases from contributor C were missing appeared for the situations in which cases were missing from contributors C and D. Note, for example that the magnitude of variation in the estimated values with increasing number of missing cases was small. Also some specific trends were similar, with, for example, the sensitivity and TSS of contributor B generally increasing with more missing cases. Perhaps more important are some trends between the scenarios involving the same or different missing cases. Note for example that the estimated sensitivity values for all four contributors were higher when different rather than the same cases are labelled as missing in the data from contributors C and D. Additionally, the specificity values for all contributors except those for contributor D when 20 and 50% of cases are missing were always lower when different rather than similar cases were missing in the data from contributors C and D. The difference between the scenarios with the same and different cases missing was greatest for contributor D (Table 2). These results highlight that the nature of the missing data, especially in whether there is similarity in the cases missing, has an impact on the values output from the latent class model approach. For the limited range of scenarios investigated, this did not impact on the ranking of the contributors derived from the latent class analysis.
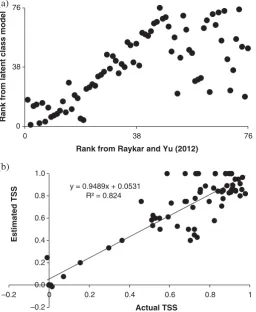
With the real, temp, data-set a latent class model was derived and the sensitivity and specificity for each of the 76 contributors was obtained from the model parameters to calculate the TSS for each. The obtained estimates of the TSS were strongly correlated with the actual values derived from the available reference data; r> 0.90. Indeed, the latent class model seemed particularly able to characterise well the poorer contributions, those that were associated with low TSS values (Figure 4). This information could be valuable to future studies by enabling, for example, the data from weak contributors to be removed which was shown above to be helpful in increasing the accuracy of analyses based upon the contributed data.
Finally, using the data relating to the Haiti earthquake, a latent class model was fitted using the class labels depicted in the five classifications for the 98 buildings for which a ground-based classification was also available. The model generated appeared to fit the data well;L2= 29.98 (p= 0.70). The prevalence or amount of severely damaged buildings
C and D missing (%) Sensitivity Specificity TSS
A B C D A B C D A B C D
0 0.7681 0.9133 0.7963 0.6437 0.8039 0.9193 0.8615 0.6916 0.5720 0.8326 0.6578 0.3353 Same cases
10 0.7676 0.9087 0.7837 0.6291 0.8049 0.9198 0.8616 0.6938 0.5725 0.8285 0.6453 0.3229 20 0.7667 0.9123 0.7854 0.6142 0.8041 0.9199 0.8616 0.6889 0.5708 0.8322 0.647 0.3031 50 0.7703 0.9904 0.8302 0.5427 0.7909 0.9186 0.8576 0.6982 0.5612 0.9090 0.6878 0.2409 Different cases
10 0.7704 0.9242 0.7869 0.6291 0.8020 0.9187 0.8584 0.6894 0.5724 0.8429 0.6453 0.3185 20 0.7751 0.9404 0.7948 0.6218 0.7988 0.9163 0.8554 0.6981 0.5739 0.8567 0.6502 0.3199 50 0.7890 1.0000 0.8518 0.7490 0.7889 0.9106 0.8554 0.6647 0.5779 0.9106 0.7072 0.4137
onal
Journal
of
Di
gital
Ear
th
15
[image:17.493.68.663.176.322.2]was indicated to be 21.8%. This value is less than the 30.6% reflected in analysis of the reference data. However, damage is often greatly underestimated by remote sensing (Yamazaki, Yano, and Matsuoka2005; Kerle2010) and the value derived from the latent class model is closer to the actual value than all but one of the five classifications used; map e suggests a value of 30.8% while the others vary from 4.1% to 20.4%. Thus, while the amount of building damage was underestimated by the value derived from the latent class model, the value was the second closest to the actual value and it must be noted that there is no information available to guide the user to identify the most accurate map from the set used.
Estimates of the sensitivity of each classification or map, which represent the producer’s accuracy for the severely damaged building class, were also obtained from the latent class model’s parameters. The obtained estimates of map accuracy varied greatly, from 0% to 91.2%. Damage maps are often very inaccurate (e.g. Kerle2010; Ajmar et al.
in press) and the ground reference data suggested that the actual range in accuracy was from 3.3% to 58%. The estimates from the latent class model were not always close to the actual values of accuracy, determined by comparing the classifications against the available ground reference data. Although the accuracy values sometimes differed greatly
(a)
(b) 0 38 76
0 38 76
Rank from latent class model
Rank from Raykar and Yu (2012)
y = 0.9489x + 0.0531 R² = 0.824
–0.2 0.0 0.2 0.4 0.6 0.8 1.0
–0.2 0 0.2 0.4 0.6 0.8 1
Estimated TSS
[image:18.493.121.378.61.374.2]Actual TSS
Figure 4. Results of analyses of the temp data-set. (a) Comparison of ranks from the latent class method with those by Raykar and Yu (2012) and (b) comparison of the estimated and actual TSS.
from the actual in absolute terms, the relative order of maps by accuracy was close (Figure 5). For example, the spearman rank correlation between the estimated and actual accuracy values wasr= 0.8; but the small size of the sample should be noted. Critically, as with the analyses of the temp data-set above, the analysis was very effective in allowing the relatively inaccurate maps to be identified. As such, the method may be able to provide useful accuracy information for key Digital Earth applications such as building damage mapping to inform post-disaster response activities. It must be stressed that no criticism of the different maps or their producer’s is intended, the maps have value beyond the issue considered here and may well be of different quality in other parts of the affected area (Hisada, Shibaya, and Ghayamghamian 2004; Tiede et al.2011). The key concern is that on the one specific issue considered, the detection of severely damaged buildings, there was a marked difference in the accuracy with which the maps represented the sample of cases. While the latent class analyses were not able to provide an accurate absolute estimate of the accuracy of the maps, it did provide a very good relative assessment and other work has shown that the quality with which the accuracy of a data source is characterised can increase with the inclusion of additional sources (Foody et al.
Submitted); so, there is scope for further enhancement in the estimation of map accuracy. The results from the analyses of both the simulated and real data-sets indicate the potential of latent class modelling for the characterisation of key aspects of the quality of crowdsourced data. In particular, it was shown that for data-sets comprising cases labelled by multiple annotators, it was possible to derive quantitative estimates of the quality of each data source. In the examples shown, the quality of the characterisation of source accuracy was often very high. However, there were also instances in which the quality of the estimates of source accuracy obtained was inaccurate in an absolute sense. In these latter cases, however, the estimates obtained typically provided an excellent characterisa-tion of relative quality. Moreover, this ability to rate data sources in terms of quality was found to apply in situations in which the data-sets used were highly imperfect, including situations in which data were contributed primarily by spammers and/or had many missing observations. The latent class modelling approach also offers other valuable features not explored here, including the ability to combine all the observations for a case and derive a predicted label in a manner similar to an ensemble classification. One key
0 20 40 60 80 100
0 20 40 60
Estimate
d accuracy (%)
[image:19.493.121.374.61.210.2]Actual accuracy (%)
Figure 5. Relationship between the estimated and actual accuracy for the analyses of building damage in Haiti.
feature of the latent class modelling analysis is also that it can be undertaken without reference data, which, given the difficulties of acquiring gold standard data and the substantial problems that may arise if a non-gold standard is used, is a major attraction for the use of the method. The method is also widely applicable. The focus in this paper has been on data of the type that are often spatially referenced, as is common in Digital Earth applications. The method may, however, be applied to aspatial data-sets derived from multiple annotators contributing perhaps to popular crowdsourcing or other projects.
5. Conclusions
Crowdsourcing through Internet-based projects has grown in popularity to become a major part of Digital Earth applications and offers the potential to acquire large data-sets inexpensively. To address the concerns with the quality of crowdsourced data, it is important to obtain information on the accuracy of data contributed. This requires ideally a method that requires no ancillary information and can cope with common problems such as the presence of data from spammers and missing cases. Here, the potential of latent class modelling as a means to characterise the quality of data from contributors to crowdsourced projects was confirmed. Moreover, it was shown that the latent class model could characterise the accuracy of contributors, in terms of the accuracy of their labelling, when the overall data-set was dominated by spammers and contained many incomplete cases. The practical value of the method was illustrated with regard to data on post-earthquake building damage arising from multiple sources. The latent class model was able to rank the different building damage maps by accuracy, enabling, for example, post-disaster aid work to focus on the most accurate information sources.
Acknowledgements
I am grateful to V Raykar for providing some of the data used and T Meadows for assistance in acquiring the data relating to the Haiti earthquake. This work benefited from support via the European Union COST Action TD1202. The latent class analyses were undertake with the LEM (available free from http://www.tilburguniversity.edu/nl/over-tilburg-university/schools/ socialsciences/organisatie/departementen/mto/onderzoek/software/) and LatentGold packages (http:// statisticalinnovations.com/products/aboutlc.html). Finally, I would like to thank the referees for their helpful comments on the article.
Funding
This work benefited in part from funding from the Engineering and Physical Science Research Council [grant number EP/J0020230/1]; the British Academy [grant number SG112788].
References
Ajmar, A., S. Balbo, P. Boccardo, F. G. Tonolo, M. Piras, and J. Princic. in press.“A Low-cost Mobile Mapping System (LCMMS) for Field Data Acquisition: A Potential Use to Validate Aerial/Satellite Building Damage Assessment.” International Journal of Digital Earth. doi:10.1080/17538947.2011.638991.
Allouche, O., A. Tsoar, and R. Kadmon. 2006.“Assessing the Accuracy of Species Distribution Models: Prevalence, Kappa and the True Skill Statistic (TSS).”Journal of Applied Ecology43 (6): 1223–1232. doi:10.1111/j.1365-2664.2006.01214.x.
Antoniou, V., J. Morley, and M. Kaklay. 2010.“Web 2.0 Geotagged Photos: Assessing the Spatial Dimension of the Phenomenon.”Geomatica64: 99–110.
Booth, E., K. Saito, and G. Madabhushi. 2010.The Haiti Earthquake of 12 January 2010. A Field Report by EEFIT. London: Earthquake Engineering Field Investigation Team (EEFIT), Institution of Structural Engineers.
Brabham, D. C. 2012. “The Myth of Amateur Crowds. A Critical Discourse Analysis of Crowdsourcing Coverage.”Information Communications and Society15: 394–410. doi:10.1080/ 1369118X.2011.641991.
Carrion, D., C. Corbane, M. Broglia, and M. Pesaresi. in press.“First Extensive and Cost-effective Quality Check of Crisis Maps: Presentation of Assessmeht Parameters and Results.” Interna-tional Journal of Digital Earth. doi:10.1080/17538947.2012.674563.
Craglia, M., K. de Bie, D. Jackson, M. Pesaresi, G. Remetey-Fülöpp, C. Wang, A. Annoni et al. 2012.“Digital Earth 2020: Towards the Vision for the Next Decade.”International Journal of Digital Earth5 (1): 4–21. doi:10.1080/17538947.2011.638500.
CSDGSND (Committee on Strategic Directions for the Geographical Sciences in the Next Decade). 2010.Understanding the Changing Planet: Strategic Directions for the Geographical Sciences. Washington, DC: National Academies Press.
Duda, K. A., and B. K. Jones. 2011. “USGS Remote Sensing Coordination for the 2010 Haiti Earthquake.”Photogrammetric Engineering and Remote Sensing77: 899–907.
Estelles-Arolas, E., and F. Gonzalez-Ladron-de-Guevara. 2012.“Towards an Integrated Crowdsour-cing Definition.” Journal of Information Science 38 (2): 189–200. doi:10.1177/ 0165551512437638.
Fichman, P. 2011. “A Comparative Assessment of Answer Quality on Four Question Answering Sites.”Journal of Information Science37 (5): 476–486. doi:10.1177/0165551511415584. Flanagin, A. J., and M. J. Metzger. 2008.“The Credibility of Volunteered Geographic Information.”
GeoJournal72 (3–4): 137–148. doi:10.1007/s10708-008-9188-y.
Foody, G. M. 2010. “Assessing the Accuracy of Land Cover Change with Imperfect Ground Reference Data.” Remote Sensing of Environment 114 (10): 2271–2285. doi:10.1016/j. rse.2010.05.003.
Foody, G. M. 2012.“Latent Class Modelling for Site and Non-site Specific Classification Accuracy Assessment Without Ground Data.”IEEE Transactions on Geoscience and Remote Sensing50 (7): 2827–2838. doi:10.1109/TGRS.2011.2174156.
Foody, G. M. 2013. “Ground Reference Data Error and the Mis-estimation of the Area of Land Cover Change as a Function of its Abundance.” Remote Sensing Letters 4 (8): 783–792. doi:10.1080/2150704X.2013.798708.
Foody, G. M., and D. S. Boyd. 2013. “Using Volunteered Data in Land Cover Map Validation: Mapping West African Forests.”IEEE Journal of Selected Topics in Applied Earth Observations and Remote Sensing6 (3): 1305–1312. doi:10.1109/JSTARS.2013.2250257.
Foody, G. M., L. See, S. Fritz, M. Van der Velde, C. Perger, C. Schill, and D. S. Boyd. 2013.
“Assessing the Accuracy of Volunteered Geographic Information Arising from Multiple Contributors to an Internet Based Collaborative Project.” Transactions in GIS. doi:10.1111/ tgis.12033.
Foody, G. M., L. See, S. Fritz, M. Van der Velde, C. Perger, C. Schill, D. S. Boyd, and A. Comber. Submitted. “Accurate Attribute Mapping from Volunteered Geographic Information: Issues of Volunteer Quantity and Quality.”Cartographic Journal.
Fowler, A., J. D. Whyatt, G. Davies, and R. Ellis. 2013. “How Reliable Are Citizen-derived Scientific Data? Assessing the Quality of Contrail Observations Made by the General Public.”
Transactions in GIS17 (4): 488–506. doi:10.1111/tgis.12034.
Fritz, S., I. McCallum, C. Schill, C. Perger, L. See, D. Schepaschenko, M. van der Velde, F. Kraxner, and M. Obersteiner. 2012.“Geo-Wiki: An Online Platform for Improving Global Land Cover.”Environmental Modelling and Software31: 110–123. doi:10.1016/j.envsoft.2011.11.015. Gao, H., G. Barbier, and R. Goolsby. 2011.“Harnessing the Crowdsourcing Power of Social Media
for Disaster Relief.”IEEE Intelligent Systems26 (3): 10–14. doi:10.1109/MIS.2011.52. Gerke, M., and N. Kerle. 2011.“Automatic Structural Seismic Damage Assessment with Airborne
Oblique Pictometry Imagery.”Photogrammetric Engineering and Remote Sensing77: 885–898. Georgiadou, Y., J. H. Lungo, and C. Richter. in press. “Citizen Sensors or Extreme Publics? Transparency and Accountability Interventions on the Mobile Geoweb.”International Journal of Digital Earth. doi:10.1080/17538947.2013.782073.
Goodchild, M. F. 2007.“Citizens as Sensors: The World of Volunteered Geography.”GeoJournal
69: 211–221. doi:10.1007/s10708-007-9111-y.
Goodchild, M. F., and J. A. Glennon. 2010.“Crowdsourcing Geographic Information for Disaster Response: A Research Frontier.” International Journal of Digital Earth 3 (3): 231–241. doi:10.1080/17538941003759255.
Goodchild, M. F., and L. Li. 2012.“Assuring the Quality of Volunteered Geographic Information.”
Spatial Statistics1: 110–120. doi:10.1016/j.spasta.2012.03.002.
Haklay, M. 2013. “Neogeography and the Delusion of Democratisation.” Environment and Planning A45 (1): 55–69. doi:10.1068/a45184.
Hirth, M., T. Bobfeld, and P. Tran-Gia. 2012. “Analyzing Costs and Accuracy of Validation Mechanisms for Crowdsourcing Platforms.” Mathematical and Computer Modelling. doi:10.1016/j.mcm.2012.01.006.
Hisada, Y., A. Shibaya, and M. R. Ghayamghamian. 2004.“Building Damage and Seismic Intensity in Bam from the 2003 Iran, Bam, Earthquake.” Bulletin of Earthquake Research 79: 81–93.
http://www.eri.u-tokyo.ac.jp/BERI/pdf/IHO79306.pdf.
Iwao, K., K. Nishida, T. Kinoshita, and Y. Yamagata. 2006.“Validating Land Cover Maps with Degree Confluence Project Information.” Geophysical Research Letters 33: L23404. doi:10.1029/2006GL027768.
Kazai, G., J. Kamps, and N. Milic-Frayling. 2012. “An Analysis of Human Factors and Label Accuracy in Crowdsourcing Relevance Judgments.” Information Retrieval 16: 138–178. doi:10.1007/s/10791-012-9205-0.
Kerle, N. 2010. “Satellite-based Damage Mapping Following the 2006 Indonesia Earthquake – How Accurate Was It?”International Journal of Applied Earth Observation and Geoinformation
12: 466–476. doi:10.1016/j.jag.2010.07.004.
Li, D., L. Zeng, N. Chen, J. Shan, L. Liu, Y. Fan, and W. Li. in press.“A framework design for the Chinese National Disaster Reduction System of Systems (CNDRSS).”International Journal of Digital Earth. doi:10.1080/17538947.2013.783634.
Liu, C., M. White, and G. Newell. 2009.“Measuring the Accuracy of Species Distribution Models: A Review.”InProceedings of the 18th World IMACs/MODSIM Congress, 4241–4247. Cairns, Australia, July 13–17.http://mssanz.org.au/modsim09.
Magidson, J., and J. K. Vermunt. 2004. “Latent Class Models.” In The SAGE Handbook of Quantitative Methodology for the Social Sciences, edited by D. Kaplan, 175–198. Thousand Oaks: Sage.
Mooney, P., and P. Corcoran. 2012.“Characteristics of Heavily Edited Objects in OpenStreetMap.”
Future Internet4: 285–305. doi:10.3390/fi4010285.
Mooney, P., and P. Corcoran. in press.“Has OpenStreetMap a Role in Digital Earth Applications?”
International Journal of Digital Earth. doi:10.1080/17538947.2013.781688.
Naroditskiy, V., I. Rahwan, M. Cebrian, and N. R. Jennings. 2012.“Verification in Referral-based Crowdsourcing.”PLoS ONE7 (10): e45924. doi:10.1371/journal.pone.0045924.
Neis, P., M. Goetz, and A. Zipf. 2012. “Towards Automatic Vandalism Detection in Open-StreetMap.” ISPRS International Journal of Geoinformation 1: 315–332. doi:10.3390/ ijgi1030315.
Neis, P., D. Zielstra, and A. Zipf. 2012.“The Street Network Evaluation of Crowdsourced Maps: OpenStreetMap in Germany 2007–2011.”Future Internet4: 1–21. doi:10.3390/fi4010001. Newell, D. A., M. M. Pembroke, and W. E. Boyd. 2012.“Crowd Sourcing for Conservation: Web
2.0 A Powerful Tool for Biologists.”Future Internet4: 551–562. doi:10.3390/fi4020551. Raddick, M. J., and A. S. Szalay. 2010.“The Universe Online.”Science329 (5995): 1028–1029.
doi:10.1126/science.1186936.
Raykar, V. C., and S. Yu. 2011. “An Entropic Score to Rank Annotators for Crowdsourced Labelling Tasks.” IEEE Proceedings of the Third National Conference on Computer Vision, Pattern Recognition, Image Processing and Graphics, 29–32. doi:10.1109/NCVPRIPG.2011.14. Raykar, V. C., and S. Yu. 2012.“Eliminating Spammers and Ranking Annotators for Crowdsourced
Labelling Tasks.”Journal of Machine Learning Research13: 491–518.
Raykar, V. C., S. Yu, L. H. Zhao, G. H. Valadez, C. Florin, L. Bogoni, and L. Moy. 2010.“Learning from Crowds.”Journal of Machine Learning Research11: 1297–1322.
Rindskopf, D., and W. Rindskopf. 1986. “The Value of Latent Class Analysis in Medical Diagnosis.”Statistics in Medicine5 (1): 21–27. doi:10.1002/sim.4780050105.
Roman, D. 2009.“Crowdsourcing and the Question of Expertise.”Communications of the ACM
52: 12.
Shachaf, P., and N. Hara. 2010. “Beyond Vandalism: Wikipedia Trolls.”Journal of Information Science36 (3): 357–370. doi:10.1177/0165551510365390.
Shan, J., R. Eguchi, and B. Jones. 2011.“Special Issue: Haiti 2010 Earthquake.”Photogrammetric Engineering and Remote Sensing77: 883–884.
Snow, R., B. O’Connor, D. Jurafsky, and A. Y. Ng. 2008. “Cheap and Fast –But Is It Good? Evaluating Non-expert Annotations for Natural Language Tasks.” In Proceedings 2008 Conference on Empirical Methods in Natural Language Processing, 25–27 October, 254–263. Hawaii.
Tiede, D., S. Lang, P. Fureder, D. Holbiling, C. Hoffmann, and P. Zell. 2011.“Automated Damage Indication for Rapid Geospatial Reporting.”Photogrammetric Engineering and Remote Sensing
77: 933–942.
Townshend, J. R., J. G. Masek, C. Huang, E. F. Vermote, F. Gao, S. Channan, J. O. Sexton et al. 2012. “Global Characterization and Monitoring of Forest Cover Using Landsat Data: Opportunities and Challenges.” International Journal of Digital Earth 5 (5): 373–397. doi:10.1080/17538947.2012.713190.
van Aardt, J. A. N., D. McKeown, J. Fauiring, N. Raqueno, M. Caterline, C. Renschler, R. Eguchi et al. 2011.“Geospatial Disaster Response During the Haiti Earthquake: A Case Study Spanning Airborne Deployment Data Collection, Transfer, Processing and Dissemination.” Photogram-metric Engineering and Remote Sensing77: 943–952.
Vermunt, J. K. 1997.Log-linear Models for Event Histories. Thousand Oaks: Sage.
Vermunt, J. K., and J. Magidson. 2003. “Latent Class Analysis.” InThe Sage Encyclopaedia of Social Science Research Methods,volume 2, edited by M. Lewis-Beck, A. E. Bryman, and T. F. Liao, 549–553, Thousand Oaks: Sage.
Voigt, S., T. Schneiderhan, A. Tweie, M. Gahler, E. Stein, and H. Mehl. 2011.“Rapid Damage Assessment and Situation Mapping: Learning from the 2010 Haiti Earthquake.” Photogram-metric Engineering and Remote Sensing77: 923–931.
Welinder, P., S. Branson, S. Belongie, and P. Perona. 2010.“The Multi-dimensional Wisdom of Crowds.”InAdvances in Neural Information Processing Systems 23, edited by J. Lafferty, C. Williams, J. Shawe-Taylor, R. Zemel, and A. Culotta, 2424–2432. NY: Curran.
Wiersma, Y. F. 2010. “Birding 2.0: Citizen Science and Effective Monitoring in the Web 2.0 World.”Avian Conservation and Ecology5: 13.http://www.ace-eco.org/vol5/iss2/art13/http://dx. doi.org/10.5751/ACE-00427-050213.
Yang, I., and M. P. Becker. 1997.“Latent Variable Modelling of Diagnostic Accuracy.”Biometrics
53: 948–958. doi:10.2307/2533555.
Yaari, E., S. Baruchson-Arbib, and J. Bar-Ilan. 2011. “Information Quality Assessment of Community-Generated Content–A User Study of Wikipedia.”Journal of Information Science
37 (5): 487–498. doi:10.1177/0165551511416065.
Yamazaki, F., Y. Yano, and M. Matsuoka. 2005.“Visual Damage Interpretation of Buildings in Bam City Using QuickBird Images Following the 2003 Bam, Iran, Earthquake.”Earthquake Spectra
21 (S1): 329–336. doi:10.1193/1.2101807.