Introducing PEGI: A Usability Process for the Practical
Evaluation of Geographic Information
BROWN, M*., SHARPLES S. †, AND HARDING J. ‡ *Corresponding Author:
Horizon Digital Economy Research, University of Nottingham Innovation Park, Triumph Road, Nottingham, NG7 2TU, UK
+44 0115 8232554
†Human Factors Research group, Innovative Technology Research Centre
Department of Mechanical, Materials and Manufacturing Engineering, University of Nottingham,
University Park, Nottingham, NG7 2RD, UK
‡
User and User Needs Research Group, Ordnance Survey, Adanac Drive, Southampton,
SO16 0AS, UK
ABSTRACT
As the use of Geographic Information (GI) is becoming more widespread, the usability of GI is being recognised as an important issue. However, exploring the usability of information products brings with it a range of problems that are not easily handled by traditional user centred design methods. This paper describes the Practical Evaluation of Geographic Information (PEGI) process, which consists of a series of usability research methods that have been modified for use with GI. Two case studies are also presented, describing the application of PEGI within a commercial product development process. The advantages and disadvantages of the PEGI process are discussed as well as plans for future research in this area. The potential value of this approach is also described in terms of Cost-Benefit, concluding that a £3,000 evaluation process could help produce benefits of over £40,000 a year in cost savings and increased sales.
Keywords
Usability, Geographic Information, Expert Evaluation, User Centred Design.
1 INTRODUCTION
This paper describes outcomes from a Knowledge Transfer Partnership project between the University of Nottingham and Ordnance Survey (the national mapping agency of Great Britain). The aim of this project was to adapt, develop and implement a range of usability research methods across Ordnance Survey’s data products. The project work stemmed from the previously identified challenge (Harding et al, 2009) that conventional usability research methods do not directly transfer to data or information products and in particular, Geographic Information (GI). ‘Data’ refers to the underlying information that populates a computer system, that is usually created/view/manipulated via an interface of some sort. The files themselves are not designed to be directly viewed by users, and should not be evaluated as such, but their design directly influences the way in which that data can eventually be used.
Recent years have seen a rapid increase in the use of GI (Blake, 2011). Users are no longer all experts who have dedicated years to the study of GI and its applications. Innovations such as web mapping tools and personal satellite navigation systems mean that most people are now exposed to GI on a regular basis. In the past, it was reasonable to assume that a GI user would have formal training in Geographic Information Systems (GIS) and a sufficient mental model of the structure and form of underlying data. Such a mental model allows users’ interactions with an interface and the underlying GI to be informed both by the interface design and their fundamental understanding of the nature of GI. However for new, non-expert user any mental model that they have is likely to be based on paper products such as maps and not fit for purpose.
When interacting with GIS a poor user experience could be the results of that poorly designed data presented via a well designed and easy to use interface, or that well designed data could be presented via an low usability interface. Traditionally usability focuses only on the interface, in effect only dealing with half the issue. This paper highlights the importance of considering data usability and its impact on GIS interactions.
underlying data suggests that many of these areas actually had lower than average levels of crime. The representation and aggregation methods used to present that data had distorted it and produced misleading results. Media reports suggested that the “data was flawed”, but the authors of this paper suggest that the crime data itself was not wrong, as all the underlying data sets were correct. Instead we suggest that it was a lack of data usability and a misleading communication of its properties that led to the incorrect interpretation of the data.
The expanding GI user base means that it is now more important that ever for GI applications to be usable. Most people simply do not have the time or patience to allow for overly complex, inefficient GI applications. This need for usability has been recognised by many in the industry and work has already begun in the design and development of usable GIS interfaces (Haklay and Zafiri, 2008). However, user focused design has yet to influence the design of the GI behind the interfaces in a systematic or holistic way (Harding et al, 2009).
1.1 Data is Different
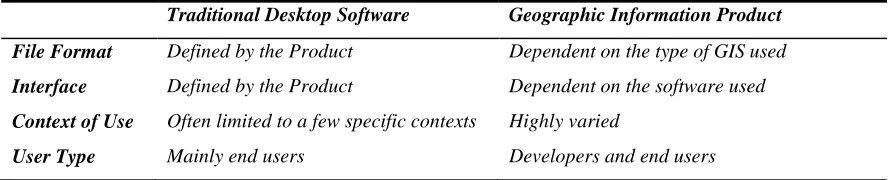
Unfortunately user centred design of GI is not simply a matter of using the tried and tested methods that have been developed for software and website design. Applying user centred design with GI is different from software design in a number of key ways, as summarised in table 1.
Traditional Desktop Software Geographic Information Product
File Format Defined by the Product Dependent on the type of GIS used
Interface Defined by the Product Dependent on the software used
Context of Use Often limited to a few specific contexts Highly varied
[image:2.612.84.529.232.322.2]User Type Mainly end users Developers and end users
Table 1. Key differences between applying user centred design to Software and to Geographic Information
First is the issue of file format. Within software design the types of data format which can be imported/exported are self-defined, but with a data product the designer must ensure that files are available in, or easily translatable into, which ever format the user wants. In the domain of GI, data files can be stored in forms specific to GI such as ESRI™ Shapefile, Geographic Markup Language (GML) and Autodesk™ Spatial Data File, or more common data formats such as JPEG, TIFF and CSV (depending on the type of data; vector or raster1). These files can be worked with individually or more commonly used together in complex databases.
Secondly, a huge range of Geographic Information Systems (GIS) exist for the presentation, analysis and manipulation of GI, each with its own unique interface. This level of choice means that GI designers have minimal control over the interface through which their product will be interacted with and consequently the efficiency, effectiveness and satisfaction of the user’s interaction. Many traditional usability measures, such as task completion and time on task, are largely dependent on the interface and thus provide little useful information about the underlying GI. Similarly user feedback often focuses on problems caused by the interface rather than the underlying data, making it difficult to identify which comments are useful and relevant.
It is also important to remember that the same data will be used for multiple tasks by multiple users, in multiple environments – the same original data could be used by one user on their mobile device to plan their daily journey to work, and by another user to plan road maintenance for an entire county with a high specification dedicated workstation. This diversity of use affects a number of key design decisions for GI include data simplicity, data file size and meaningfulness of data labels, to name but a few. In terms of expertise, it can be difficult to allow for novice users when designing GI. It is, by its nature contained within a database that can be freely explored by a user. Yet, we know within standard interface design, through the use of tools such as Wizards, that an effective method to guide a novice user through a task is by presenting a clearly signaled sequence of activities, with opportunities to move forwards and backwards along the task path. This type of guide is rarely useful to GI users as the sequence and nature of the steps performed is highly dependent on the interface being use.
Finally, the wide range of potential user types and experience presents a design challenge. While it is known for user-developers to occasionally alter software products before they reach the end users, translation and modification are common practice with GI. This situation means that both developers and end users must be considered when designing GI.
1 In vector GI products data is stored as points lines and polygons with associated attributes. Raster GI stores data as a grid of
All of these points show that nature of GI presents some major complications for user centred design that make the many traditional usability research methods inefficient or inappropriate. In order to address this issue, a range of methods have been adapted for use with GI and a framework has been designed in order to apply them efficiently in an industrial setting.
1.2 Research to Date
Some of the first research in this area was carried out by the U.S. National Centre for Geographic Information and Analysis (NCGIA) and the European GISDATA foundation in the early 1990s (NCGIA, 1993). While these agencies did not explicitly state that they were exploring GI usability, they did explore some important issues in this area, such as barriers to the effective use of GI and GIS. They concluded that quality and usability of GI has a major impact on how it can be used and ultimately its value to society as a whole. About a decade later De Bruin and Bregt (2001), and Hunter, Wachowicz, and Bregt (2003) were some of the first to explicitly explore this area, identifying the lack of research and presenting an extensive list of nearly 40 elements of GI usability that need to be understood; these included terms such as metadata, searchability, trust and completeness.
More recently Harding et al (2009) reviewed some GI case studies that highlight usability issues and propose eleven key research considerations relating to GI usability within three themes:
Interfaces
GI Content, Quality, Structure and Formats
Trust and Value
The more general area of data usability has been researched in more depth. Usability and user centred design have been investigated and applied in areas such as digital libraries (Blandford and Buchanan, 2003), medical data (Prins et al, 2002) and multi-modal interaction (Coutaz et al, 1995). Key issues that have been highlighted include the difficulty of allowing for multiple interfaces, the value of metadata and the importance of consistent language and terminology.
2 METHOD DEVELOPMENT
As part of this research project a number of user centred design methods have been developed and adapted for use with GI design and development. These methods were then group under the umbrella title of PEGI and applied in two case studies described later in this paper. The following section describes methods, explains their advantages when working with GI and gives details of how they have been specifically adapted for this domain.
2.1 Context of Use Analysis
In all user centred product development it is important to understand the context in which the product will be used. Thomas and Bevan (1996) originally suggested an in-depth method for identifying and understanding the Context of Use for a software product.
This method is very important to the design of GI, as context can be extremely varied between user groups and impacts important design decisions. Also, as a method that does not involve direct interaction with the product, it has less potential for analysis to be confounded by issues associated with the interface used for data presentation.
In order to refine this method for GI it has been streamlined and the types of information collected have been focused on topics relevant to GI. These alterations were made in response feedback from a series of case studies in which Thomas and Bevan’s method was applied to two GI products2
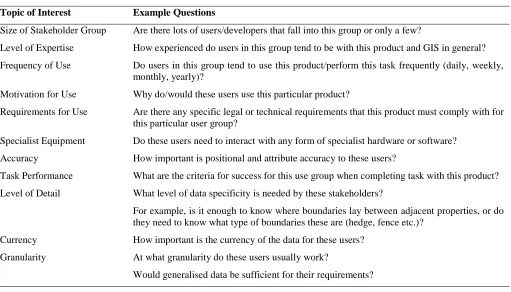
; OS MasterMap® Topography Layer and a prototype land cover product. The revised method involves first identifying all the key user groups for the target product then collecting context of use information for each of these groups. Internal meetings with product and user specialists are used to establish the list of user groups and collect initial context information. It was found that it is more useful to classify user groups in terms of how they use a product, rather than the organisation or sector in which they work. For example, when evaluating a product instead of forming user groups such as ‘central government’ and ‘utility providers’, we use more task-focused classification, such as ‘large area analysis’ or ‘building planning’. Once the groups have been established, customers in each of the user groups are consulted though interviews and/or focus groups in order to obtain more in-depth information. This information is collected for each user group, covering the topics described in table 2.
Topic of Interest Example Questions
Size of Stakeholder Group Are there lots of users/developers that fall into this group or only a few?
Level of Expertise How experienced do users in this group tend to be with this product and GIS in general? Frequency of Use Do users in this group tend to use this product/perform this task frequently (daily, weekly,
monthly, yearly)?
Motivation for Use Why do/would these users use this particular product?
Requirements for Use Are there any specific legal or technical requirements that this product must comply with for this particular user group?
Specialist Equipment Do these users need to interact with any form of specialist hardware or software? Accuracy How important is positional and attribute accuracy to these users?
Task Performance What are the criteria for success for this use group when completing task with this product? Level of Detail What level of data specificity is needed by these stakeholders?
For example, is it enough to know where boundaries lay between adjacent properties, or do they need to know what type of boundaries these are (hedge, fence etc.)?
Currency How important is the currency of the data for these users? Granularity At what granularity do these users usually work?
[image:4.612.54.565.117.409.2]Would generalised data be sufficient for their requirements?
Table 2: Context of use Analysis, Topics of Interest
2.2 Scenarios of Use
This method involves creating example scenarios of how users carry out specific tasks, in order to guide product development. It does not involve direct interaction with the product, so is not restricted by the interface issues that can interfere with other methods. The main advantage of applying Scenarios of Use with GI is that it allows you to gain a greater understanding of the possible contexts in which the product could be applied.
The scenarios are created by a group of product stakeholders within the organisation using previously collected customer information. Each scenario is described in as much detail as possible, with a minimum of the following information:
User Description: the exemplar user for each scenario is described including a name, age, gender and technical competencies.
Task Description: what exactly do they want to do with the product?
Environmental Factors: did the context of use analysis reveal any environmental factors that could influence how they would complete this task?
Criteria for Success: what are the key factors that determine successful completion of the task (time, accuracy etc.)? Having created the Scenarios they can be used to guide product development and inform product evaluations.
2.3 Cognitive Walkthrough
As it is an expert evaluation this method does not rely on user input about the target product. In the context of GI, this method allows the experts to focus on issues that are caused by the GI itself rather than those that are artifacts of the system that is being used for the evaluation.
Therefore, the changes necessary to allow for the application of this method to GI usability were to adopt the streamlined approach suggested by Spencer (2000) and develop a method of selecting tasks for the evaluation that would allow for the highly varied contexts of use.
While the original version of the method involves asking four key questions at each sub-task (Wharton et al, 1994), Spencer’s version merges three of the questions, leaving only two3:
1. Will the user know what to do next?
2. If they have done the right thing, is it obvious that they have done the right thing?
In addition he suggests a pre-evaluation briefing with the expert group in order to defuse any defensiveness from designers and set the scene for the evaluation. The issue of identifying appropriate tasks was resolved by adapting the ‘Scenarios of Use’ method, as described below.
2.4 Heuristic Evaluation
This evaluation method involves a group of experts evaluating a product in relation to a list of previously created usability rules of thumb or heuristics.
Similar to Cognitive Walkthrough, heuristic evaluation is an expert method and thus it is easier to avoid bias from the impact of the interface on the evaluation of underlying GI. In addition it is not linked to specific tasks, so the range of contexts in which GI is used does not affect this type of evaluation.
However, the nature of GI means that traditional usability heuristics such as those developed by Nielson (Nielsen , 1994a) for the evaluation of software and websites are not appropriate. Therefore a new list of usability heuristics was developed specifically for the evaluation of GI. These heuristics were based on previous work exploring the key usability issues with GI (Brown et al, 2010).
In the development of these heuristics a series of studies were performed to identify usability issues with OS MasterMap4. Each of these studies collected information from users with a wide variety of GIS experiences, in terms of expertise and types of use.
First, the following sources of previously collected data about users were manually searched by a team of human factors experts with between 5 and 25 years of experience for usability issues relating to OS MasterMap products
• A series of 55 interviews with users.
• Six market research reports relating to OS MasterMap.
• Reports produced as the result of two usability workshops with customer support staff. • A list of technical Frequently Asked Questions (FAQs) collected by customer support staff. • Three databases containing customer input concerning products.
Next, a evaluation of OS MasterMap was performed using a cognitive walkthrough technique. Finally a diary study was carried out with four OS MasterMap users. Each user was asked to complete a diary of any issues encountered relating to the product over a two week period. Once completed the diaries were content analysed in order to discover any usability issues encountered.
A total of 124 unique usability issues were identified by these three methods covering a range of topics from licensing and data delivery to meta data and data quality.
3
“Will the user try to achieve the effect that the subtask has?”, “Will the user notice that the correct action is available?” and “Will the user associate the correct action with the effect that user is trying to achieve?” are merged into “Will the user know what to do next?”
A thematic analysis was performed with these issues, based on the guidelines proposed by Corbin and Strauss (2008) and Charmaz (2006). The initial 124 issues produced 64 unique codes and from these codes eleven categories were identified. These categories were formed into heuristics based on consultation with usability and GI experts. Some categories were found to describe more than one important issue; where this was the case multiple heuristics were derived. As a result eighteen heuristics were identified:5
1. Is the data file structure easy to understand? 2. Are the data files easy to find?
3. Are the data file labels clear and easy to understand? 4. Is text placement relative to features logical and consistent? 5. Are map features easy to see and understand?
6. Are map symbols provided with the data easy to see and understand? 7. Is there enough data for the user?
8. Is the data detailed enough for the user? 9. Is it clear when the data files were last updated?
10. If data has been updated, is it clear why this has happened? 11. Is the product description sufficient and accurate?
12. Is the data all of acceptable quality and detail? 13. Is language use appropriate?
14. Are abbreviations and technical language explained?
The last four heuristics were noted as only being applicable to vector type products, but important enough to include in the final set.
15. Are attributes classified and organised logically?
16. Is it clear when data points/lines/polygons were last updated? 17. If attributes have been updated, is it clear why this has happened?
18. Is consistent wording used to describe attributes and labels within the product?
3 PEGI
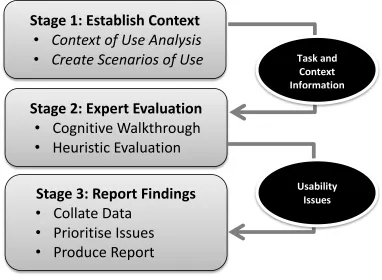
Having developed these methods the Practical Evaluation of Geographic Information (PEGI) process has been designed as a way of applying them in a time efficient and flexible manor that yields practical feedback to the design team. See figure 1 for an overview of this process.
3.1 Establish Context
The first step of the process is to establish the context in which the GI is likely to be used and evaluated. This involves first performing a Context of Use analysis as described above, then using the results of this method to inform the creation of Scenarios of Use. For each user group identified in the Context of Use analysis at least one scenario should be created. If a user group has a wide range of uses for the target product it may be useful to create multiple scenarios in order to allow for the range of uses.
3.2 Expert Evaluation
Having explored how the product is used and described some examples of use, the next stage is evaluation. This process involves gathering an expert group together to perform a Cognitive Walkthrough, then a Heuristic Evaluation.
The group should include at a minimum a GI expert, a usability expert, a customer representative and a product manager. This composition should ensure that the expertise and decision making power in the room allows issues to be both correctly
5 These heuristics are presented as questions in order to make the m easily understandable for those not familiar with heuristic
identified and acted upon. It is important that the group try to focus on issues created by the GI itself, only noting non-data issues if they are persistent and/or highly disruptive.
3.3 Report Findings
Having evaluated the products, the results must be collated, prioritised and then communicated appropriately. The results from stages 1 and 2 are typed up into a single document. In order to prioritise the issues identified the severity of each is established using a slightly simplified version of Nielsen’s severity rating system (Nielsen, 1994b). For each issue the following three questions are considered:
Does the problem occur when performing frequent or critical tasks?
Is the problem difficult to overcome?
Once the problem has been overcome for the first time, will it continue to bother the user?
[image:7.612.122.504.263.543.2]The issue is given 1 point for each answer ‘Yes’ to any of these questions, giving a score of between 0 (minor problem) and 3 (critical problem) for each issue that has been identified.
Figure 1. Overview of the PEGI process
Finally a report is created to be communicated within the organisation. This report should not just list the issues discovered, but also prioritize them by considering severity ratings, underlying cause of the issue and how difficult it would be to correct. Each issue is placed in one of four levels of priority:
1. Show Stoppers: these are critical usability issues that must be dealt with as soon as possible. 2. Quick Wins: these issues are not as severe, but do offer a high benefit to cost ratio.
3. Nice to Have: dealing with these issues would definitely improve the product, but should only be addressed once priority 1 and 2 issues have been tackled.
4. Low Priority: due to minimal impact on users and/or high cost to fix, these issues are considered to be of lowest priority.
Stage 1: Establish Context
•
Context of Use Analysis
•
Create Scenarios of Use
Stage 2: Expert Evaluation
•
Cognitive Walkthrough
•
Heuristic Evaluation
Stage 3: Report Findings
•
Collate Data
•
Prioritise Issues
•
Produce Report
Task and
Context
Information
4 CASE STUDY 1
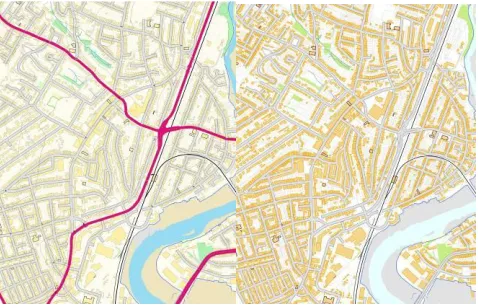
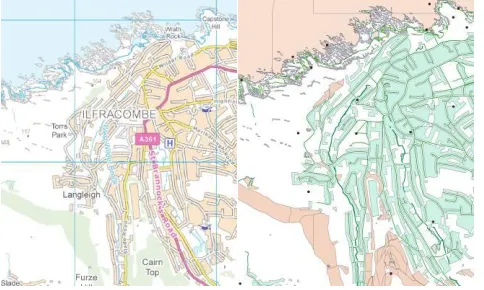
As part of a programme of continuous improvement, the PEGI process was used to evaluate OS VectorMap® Local. This product is a mid-scale6 vector product, designed to provide an alternative to traditional raster mapping products, allowing users to completely customise the content, style and colour of the mapping to meet their own needs as shown in figure 2. The evaluation process itself took place over the course of four weeks and required approximately 80 person hours of work to complete.
4.1 Context of Use
[image:8.612.188.427.178.332.2]Two scenarios of use were created. The first related to Contextual Mapping, using a map to provide environmental context for a localised event, such as a proposed building development or festival. The second focused on Backdrop Mapping, when another data set is overlaid on top of a map.
Figure 2. Example OS VectorMap® Local data in two different styles, demonstrating the flexibility of vector type GI.
Further interviews with users from both of these groups were used to complete the context of use analysis and understand the different user requirements for each of them.
4.2 Scenarios of Use
Two scenarios of use were created, the first relating to Contextual Mapping and the second to Backdrop Mapping.
1. Creating a map for a planning application: this describes a user with minimal GIS experience that wants to create a map of a small area in order to support an application for planning permission.
2. Present Carbon Monoxide data for a suburb: this describes a user with moderate GIS experience who is interested overlaying some air pollution data on OS VectorMap Local as a backdrop map.
4.3 Evaluation
A group of experts was gathered to perform the Cognitive Walkthrough and Heuristic Evaluation. This group consisted of a facilitator, a usability expert, a GI expert, a customer services representative and a technical product manager. A total of 29 usability issues were identified, of these 14 related directly to OS VectorMap Local, 11 to the GIS used and 4 to the interaction between the two.
4.4 Results
Collating and prioritising the results from the evaluations revealed the following high priority issues
Show Stoppers
No show stopping issues relating directly to OS VectorMap Local were discovered, however application of Cognitive Walkthrough revealed that the translator used did not fully translate road networks. This issue was subsequently raised and resolved with the data translator provider. This issue was identified as a direct result of the usability expert and GI expert collaborating during the cognitive walkthrough. Participation in the task required the GI expert to complete the interaction with the data in a different manner to that which he would normally use, and as a result the usability expert queried the omission of a specific road type in the translation. The active questioning
6 Mid-scale in this context means that the product is designed for viewed at a district/borough level. As opposed to small
scale products which are optimised for county/regional level views and large scale products which are designed to be viewed at a street/building level.
and discussion that was promoted by the cognitive walkthrough, along with the change in interaction strategy, resulted in the GI expert noticing the problem with the translator software that otherwise would have been unlikely to be detected until product launch, with associated increase in correction costs and the negative repercussions for the data producer. It was estimated that this discovery alone resulted in a saving in the region of £100,000 to the organisation. The reason for this value is that the translator is now commonly used and if this issue had not been identified it would have resulted in a significant negative effect on both brand image and sales for Ordnance Survey.
Quick Wins
A total of four ‘Quick Win’ issues were identified.
1. Information on when features in the data were last updated, known as currency data, was not easily accessible within the data. This problem makes it difficult to assess the reliability of the data in terms of how up to date it is.
2. Not all abbreviations were fully explained in the documentation. For example it was not clear that ‘des’ was used to mean ‘description’.
3. Some technical terms were not always used consistently. For example the terms ‘cline’, ‘roadcline’ and ‘centreline’ were used interchangeably to refer to road centre lines.
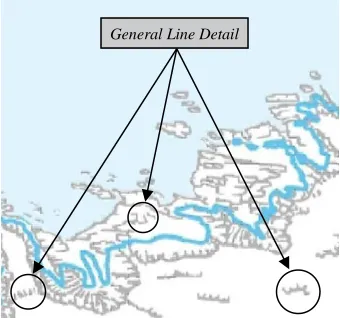
4. The description attribute ‘general line detail’ was found to be unclear. It was used as a catch-all term for a wide variety of physical and cartographic features, see figure 3. It should be changed or clearly described in documentation.
Nice to Have
Five issues fell into the ‘nice to have category. For example:
[image:9.612.221.391.373.532.2] The organisation of the data into only four layers should be reconsidered, as a more granular split would allow for more layer titles. One of the problems caused by this issue is the fact that road text is confusingly found in the ‘Road Centre Line’ layer, rather than the ‘Text’ layer as would be expected.
Figure 3. Example of Issue 4: It was not always clear what physical features ‘General Line Detail’ refers to.
Low Priority
The final 14 issues were identified as Low Priority, as they had minimal impact on the interaction and/or would be difficult to fix. For example:
Upon initial loading the product looks extremely complex, see figure 4. This issue could be intimidating to new users, but fixing it would be extremely difficult as it is created by the interaction between the product, translator and GIS being used.
Figure 4. Demonstration of issue 6: upon initial loading the data looks crowded.
5 CASE STUDY 2
The second case study describes the use of PEGI with OS VectorMap® District. This product is closely related to OS VectorMap Local, but aimed to be used at smaller scales in cartographic terms and therefore is generalized to a greater extend, see figure 5. The main difference with this evaluation was that it took place before the product was released and within an extremely short timescale. The entire PEGI procedure took place over a three day period and required approximately 20 person hours to complete.
Figure 5. Example OS VectorMap® District data in two different styles.
5.1 Context and Scenarios of Use
Given the similarities between the products and the short time scale it was decided to use the Context of Use and Scenarios of Use from the OS VectorMap Local evaluation as a baseline. Instead of starting from scratch, internal experts were consulted on the appropriateness and specific details of these previously identified user groups and scenarios. It was found that only minor adjustments were necessary to make the information relevant to OS VectorMapDistrict.
5.2 Evaluation
A slightly smaller expert group was used for the evaluation methods consisting of a facilitator, a usability expert, a customer services representative and a technical product manager. A total of 17 issues were discovered. This lower number was to be expected as many of the issues identified in the evaluation of OS VectorMap Local were considered in the design of OS VectorMapDistrict.
5.3 Results
Collating and prioritising the results revealed the following high priority issues:
Show Stoppers
No show stopping issues were discovered.
Quick Wins
[image:10.612.187.429.330.475.2]1. Some of the symbology for ‘features of interest’ provided with the product was not intuitive. Specifically it was not obvious what the symbols for ‘police station’ and ‘educational institute’ were meant to represent, see figure 6. 2. Some differences in terminology use between the product and user guide. For example the user guide used the term
[image:11.612.198.437.132.308.2]woodland, while the product referred to the same elements as woods.
Figure 6. Example of Issue 1: The meaning of symbols for ‘Police Station’ and ‘Educational Institute’ was not always clear.
3. When downloading files it is not obvious how to select the appropriate files for the area in which a user is interested. The large number of files and an unclear naming convention made it unclear which files relate to which areas.
Nice to Have
Five issues fell into the ‘nice to have’ category. For example:
The number of icons placed for a single point of interest is not consistent. Some hospitals have multiple symbols for different buildings, while others have only one.
Low Priority
The final nine issues were identified as Low Priority, as they had minimal impact on the interaction and/or would be difficult to fix. For example
Use of abbreviation in file names means that novice users may have to constantly refer to the product guide. This problem is caused by file name length restrictions in the file format used.
6 CONCLUSIONS
The development and application of the PEGI process within these two case studies has revealed information about its strengths and weakness.
6.1 Flexibility
An important advantage of this process is its flexibility. As shown in the case studies it can be performed in a very short space of time (as little as 20 hours of effort) or in more depth when time is not as critical. This flexibility is due to the methods used. Both Context of Use and Scenarios of Use can be performed very quickly or investigated in more depth to get a fuller understanding. The same is true of the Cognitive Walkthrough; the fewer tasks that are explored, the faster the methods. Heuristic evaluation is flexible in how many experts are involved in the evaluation; more experts will require more time to explore the product, but produce a more complete evaluation.
The downside of this flexibility is that the process must be closely monitored to ensure that each method is employed at the correct level of detail for the current project.
6.2 User Contact
However, the lack of direct user evaluation does mean a reliance on expert methods. This can call into question the validity of any findings, as they can be heavily influenced by evaluator bias. For this reason it is recommended to supplement this process with user based evaluation in order to validate results, whenever possible.
This recommendation was followed for Case Study 1. A series of interviews and a Critical Incident Technique analysis was carried out with users after the PEGI analysis. This confirmed the findings, as the issues reported by both methods were similar.
6.3 Suitability for Geographic Information
The methods in the PEGI process were chosen specifically for their appropriateness for the evaluation of GI. But, the process does not fully overcome the unique difficulties presented by data issues.
The issue of varied context of use is dealt with quite well, as the creation of Scenarios of Use for each user group means that their individual needs will be allowed for. However, the nature of the expert evaluation methods, especially the cognitive walkthrough means that they are influenced by the type of GIS used. In order to minimise this effect it is recommended to repeat the cognitive walkthrough with different GIS if time allows. This re-evaluation will give a better understanding of the issues caused by interaction with a specific GIS and those that are rooted in the underlying data.
6.4 Efficiency
A major benefit of applying this process is the efficient use of time. The results of each method feed into the next one, allowing a range of usability research methods to be applied with minimal effort. The results of the Context of Use analysis are used to create Scenarios of Use. The Scenarios of Use are used as example tasks for the Cognitive Walkthrough. The expert group uses the experience of the product they gain in the Cognitive Walkthrough when performing the Heuristic Evaluation.
This level of efficiency is especially valuable when performing the expert evaluations, as gathering together a suitable group of experts for either the Cognitive Walkthrough or Heuristic Evaluation can be difficult and expensive. With this procedure, the evaluations can be performed one after another in a single session, making maximum use out of this group while the experts/stakeholders are gathered.
6.5 Cost Benefit
Following the first case study a cost benefit analysis was performed to evaluate the organisational value of applying the PEGI process. The cost of applying the methods was calculated at £3,000, including overheads but excluding the costs of initially developing the PEGI process. In terms of benefits, the organisational value of the discovery of the translation issue mentioned earlier was estimated at £100,000. The value of each usability issue discovered was conservatively estimated based on the severity of the issues, sales levels, current product support cost and previous research into cost-justification of usability research methods (Bias and Mayhew, 2006). It was calculated that correcting each of the issues discovered could save the organisational between £40 and £400 in annual support cost and potentially increase sales by between £1,000 and £10,000 every year for the lifetime of the product. Considering all of the issues discovered, it was concluded that an annual reduction of £3,000 in support cost and increase of £40,000 in sales could be achieved. This process was not applied during case study two, but this example highlights the potential economic benefit of applying this process within an industrial setting.
7 DISCUSSION
This paper has introduced the PEGI usability evaluation process and given two examples of its successful implementation within a design/development process. This process represents a structured framework that allow for some of the issues involved in applying usability research methods to information products, such as lack of control over interface and varied context of use.
7.1 The Value of Multiple Evaluation Methods
By examining the number of issues discovered by each evaluation method we can examine the value of applying multiple methods. Table 3 shows combined numbers for issues discovered during the two case studies described above. It reveals that relying on only one method would have meant that between 19% and 25% fewer issues would have been identified, highlighting the benefit of applying two different usability evaluation methods.
Type of Issue Identified
Unique to Cognitive Walkthrough
Unique to Heuristic Evaluation
Identified by Both Methods
Show Stoppers 0 0 0
Nice to Have 1 3 6 Low Priority 5 5 11
[image:13.612.135.479.71.125.2]Total 7 9 22
Table 3: Breakdown of Usability Issues Discovered during Study 1 & 2 by each Evaluation Method
7.2 Interface Independent Usability
One of the most important issues that these methods address is the need for data products that are usable independent of the hardware and software interface they are used with. This need is not unique to GI. The majority of the PEGI process could in theory be applied to other non-GI data products, with two important provisos. Firstly the methods involved have been validated with GI specifically and should be re-assessed if the process is to be generalised to other types of data. Secondly many of the heuristics developed are specific to GI, so a set of general heuristics would have to be adopted or new heuristics developed in order to complete an effective Heuristic evaluation.
7.3 Future Work
Two separate streams of future work are currently planned. Firstly to further test and refine these methods, by implementation with more and larger product design/development projects. Secondly to create a similar evaluation process focusing on user based evaluation, in order to create a more complete toolkit for those wishing to evaluate the usability of geographic information.
Also, the wider implications of Interface Independent Usability need to be explored. While it is not possible to develop data products that are always usable regardless of interface, it is important that we understand how to evaluate and improve usability in products which will be used with a wide range of use interfaces. This issue is becoming more and more important with the constant diversification of interface hardware and software technology.
ACHKNOWLEDGEMENTS
This work was carried out in collaboration with Horizon Digital Economy Research, through the support of RCUK grant EP/G065802/1 and the Knowledge Transfer Partnership scheme (KTP070110) through the support of the Technology Strategy Board and Ordnance Survey.
REFERENCES
Bias, R., Mayhew, D., 2006. Cost-Justifying Usability: An Update for the Internet Age (2nd Edition), Elsevier, Calafornia. Blake, V. GIS/Geospatial Market Grew 17% in 2005 to Top $3.3 Billion. http://www10.giscafe.com/nbc/articles/view_article.php?section=corpnews&articleid=286234 accessed on 20th January 2011 Blandford, A., Buchanan, G., 2003. Usability of digital libraries: a source of creative tension with technical developments. IEEE Technical Committee on Digital Libraries Bulletin, University College London , London.
Brown, M., Harding, J., Sharples, S., 2010. Exploring the usability of geographic information: a grounded Theory analysis. Proceedings of the GIS Research UK 18th Annual Conference, University College London, 417-422.
Charmaz, K., 2006. Constructing Grounded Theory. Sage Publications Ltd., London.
Corbin, J., Strauss, A., 2008. Basics of Qualitative Research, (3rd Edition) Sage Publications Ltd., London.
Coutaz, J., Nigay, L., Salber, D., Blandford, A., May, J., Young, R., 1995. Four Easy pieces for assessing the usability of multimodal interaction: the care properties. Proceedings of INTERACT, Springer, 1-7.
De Bruin, S., Bregt, A., 2001. Assessing fitness for use: the expected value for spatial data sets. Geographic Information Science, 15, 5, 457-471.
Haklay, M., Zafiri, A., 2008. Usability engineering for GIS: learning from a screenshot. The Cartographic Journal. 45, 2 , 87-97.
Harding, J., Sharples, S., Haklay, M., Burnett, G., Dadashi, Y., Forrest, D., Maguire, M., Parker, C., Ratcliffe, L., 2009. Usable geographic information - what does it mean? Proceedings of the AGI GeoCommunity 2009, http://www.agi.org.uk/storage/events/AGI2009Papers/JennyHarding.pdf
Hunter, J., Wachowicz, M., Bregt A., 2003. Understanding Spatial Data Usability. Data Science Journal: Special Data Usability Special Section, 2, 79-89.
National Centre for Geographic Information and Analysis (NCGIA), 1993. Use and Value of Geographic Information: Final Report. University of California, Santa Barbara.
Nielsen, J., 1994a. Usability inspection methods. Conference on Human Factors in Computing Systems, ACM, 413-414. Nielsen, J., 1994b. Enhancing the explanatory power of usability heuristics. Proceedings of the SIGCHI Conference on Human Factors in Computing Systems. ACM , 152-158.
Prins, H., Kruisinga, F., Büller, H., Zwetsloot-Schonk, J., 2002. Availability and usability of data for medical practice assessment. International Journal for Quality in Health Care. 14, 2, 127-137.
Spencer, R., 2000. The streamlined cognitive walkthrough method, working around social constraints encountered in a software development company. Proceedings of the SIGCHI Conference on Human Factors in Computing Systems, ACM, 353-359.