DocLite: A Docker-Based Lightweight Cloud
Benchmarking Tool
Blesson Varghese
School of EEECS
Queen’s University Belfast, UK
[email protected]
Lawan Thamsuhang Subba
Department of Computer Science
Aalborg University, Denmark
[email protected]
Long Thai and Adam Barker
School of Computer Science
University of St Andrews, UK
{
ltt2, adam.barker
}
@st-andrews.ac.uk
Abstract—Existing benchmarking methods are time consuming processes as they typically benchmark the entire Virtual Machine (VM) in order to generate accurate performance data, making them less suitable for real-time analytics. The research in this paper is aimed to surmount the above challenge by presenting DocLite - Docker Container-based Lightweight benchmarking tool. DocLite explores lightweight cloud benchmarking methods for rapidly executing benchmarks in near real-time. DocLite is built on the Docker container technology, which allows a user-defined memory size and number of CPU cores of the VM to be benchmarked. The tool incorporates two benchmarking methods - the first referred to as the native method employs containers to benchmark a small portion of the VM and generate performance ranks, and the second uses historic benchmark data along with the native method as a hybrid to generate VM ranks. The proposed methods are evaluated on three use-cases and are observed to be up to 91 times faster than benchmarking the entire VM. In both methods, small containers provide the same quality of rankings as a large container. The native method generates ranks with over 90% and 86% accuracy for sequential and parallel execution of an application compared against benchmarking the whole VM. The hybrid method did not improve the quality of the rankings significantly.
Index Terms—lightweight benchmark; Docker; cloud bench-marking; containers; hybrid benchmark
I. INTRODUCTION
Cloud Virtual Machines (VMs) can be benchmarked to gather, compare and rank performance [1], [2], [3], [4]. Bench-marking cloud VMs can expose the underlying performance properties across the large number of different cloud providers and instance types. This enables a user to make a more informed choice about which VM(s) would be appropriate for a given computational workload.
The majority of cloud benchmarking methods are time consuming processes as they benchmark an entire VM and incur significant monetary costs [3]. For example, a VM with 256GB RAM will require a few hours for the memory to be benchmarked. This time consuming process results in significant costs even before an application is deployed on the VM, and means that services which utilise this data (for example, cloud service brokerages [5], [6] or cloud/cluster management systems) rely on historic data, rather than near real-time data sets.
We explore methods which execute quickly and can be used in near real-time to collect metrics from cloud providers and VMs, which we have referred to as lightweight cloud benchmarking in this paper. We present DocLite - Docker
Container-based Lightweight Benchmarking: a tool to simplify the exploration of lightweight benchmarking methods. Two key research questions are addressed in this paper. Firstly, how fast can lightweight methods execute compared to benchmark-ing the entire VM? Secondly, how accurate will the generated benchmarks be?
The Docker1container technology [7], [8], [9], [10], which allows a user-defined portion (such as memory size and the number of CPU cores) of a VM to be benchmarked is integral to DocLite. The benefit is that containers can be used to benchmark, for example, only 1GB RAM of a VM that has 256GB RAM without benchmarking the entire memory of the VM. This facilitates rapid benchmarking of VMs for use in real-time, which in turn helps to reduce benchmarking costs for the purposes of comparison.
DocLite organises the benchmark data into four groups, namely memory and process, local communication, compu-tation and storage. A user of DocLite provides as input a set of four weights (ranging from 0 to 5), which indicate how important each of the groups are to the application that needs to be deployed on the cloud. The weights are mapped onto the four benchmark groups and are used to generate a score for ranking the VMs according to performance. Two container-based benchmarking methods are incorporated in DocLite. In the first method, referred to as thenative method, containers are used to benchmark a small portion of a VM to generate the performance ranks of VMs. In the second approach, historic benchmark data obtained from benchmarking an entire VM or from previous executions of the native method are used as a hybrid methodin order to generate VM ranks.
Three case study applications are used to validate the benchmarking methods. The experiments highlight that the lightweight methods are up to 91 times faster than bench-marking the entire VM. The rankings generated by lightweight methods are over 90% and 86% accurate for sequential and parallel execution of applications when compared to bench-marking the whole VM. The quality of rankings when using the hybrid method is not significantly improved over the native method.
This paper makes five research contributions. Firstly, the de-velopment of DocLite, a tool that incorporates container-based cloud benchmarking methods. Secondly, the development of
lightweight cloud benchmarking methods that can benchmark VMs in near real-time for generating performance ranks. Thirdly, an evaluation of the time taken by lightweight bench-marking methods in comparison to methods which benchmark an entire VM. Fourthly, an evaluation using containers of varying sizes of VM memory against the whole VM. Fifthly, an evaluation of the accuracy of the benchmarks generated by DocLite on three case studies.
The remainder of this paper is organised as follows. Section II considers the implementation of DocLite that is devel-oped to explore container-based cloud. Section III presents two container-based benchmarking methods incorporated in DocLite. Section IV is an experimental evaluation of the proposed methods using three case study applications. Section V considers related research. Section VI concludes this paper by reporting future work.
II. DOCLITETOOL
In this section, we consider the building blocks and the sys-tem design of DocLite - Docker Container-based Lightweight Benchmarking tool, which is developed to explore container-based benchmarking methods on the cloud. DocLite is avail-able from https://github.com/lawansubba/DoCLite.
A. Building Blocks
DocLite is built on (1) the Docker container technology, (2) container-based benchmarking methods, (3) standard bench-marking tools, and (4) a cloud test-bed.
1) Docker container technology: Docker is a portable and lightweight tool that facilitates the execution of distributed applications. It is advantageous in that container images re-quire less storage space and consequentially deployment of containers is quick. Another useful feature of containers is resource isolation - the resources of a VM can be restricted to a specified amount of memory or number of cores (virtual CPUs) for benchmarking. The experiments were performed on 100MB, 500MB and 1000MB of RAM and on a single and on all vCPUs of the VM. In our approach Docker containers are used on top of the VMs and the resulting overhead is negligible as reported by industry experts [11] [12].
2) Container-based benchmarking methods: DocLite in-corporates two container-based benchmarking methods which will be considered in the next section. In the first method, referred to as the native method, a user-defined portion (such as memory size and the number of CPU cores) of a VM can be rapidly benchmarked thereby obtaining benchmark data in real-time. DocLite then organises the benchmark data into four groups, namely memory and process, local communication, computation and storage. A DocLite user provides as input a set of four weights (ranging from 0 to 5), which indicate how important each of the groups are to the application that needs to be deployed on the cloud. The weights are mapped onto the four benchmark groups to generate a score for ranking the VMs according to performance. In the second method, historic benchmark data is used along with the native method as a hybrid in order to generate VM ranks.
3) Benchmarking tools: The benchmarking tool employed in this paper is lmbench [13]. It was selected since (i) it is a single tool and can be easily deployed on the cloud, (ii) it provides a wide variety of benchmarks related to memory and process, computation, local communication and file related operations that capture the performance characteristics of the VM, and (iii) it has been previously employed for modelling the performance of cloud VMs [1], [3], [14]. In addition to the execution oflmbench, other benchmarking tools can be executed independently or in any preferred combination on DocLite.
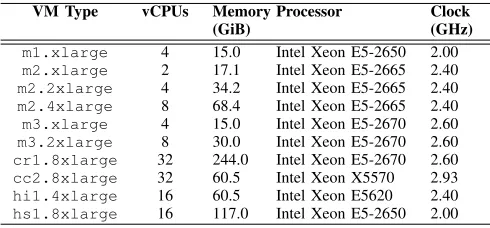
[image:2.612.314.559.273.387.2]4) Cloud test-bed: The cloud test-bed used in this research is the Amazon Web Services (AWS) Elastic Compute Cloud (EC2)2. The previous generation VMs, shown in Table I, which have varying performance and have become popular in the scientific community due to their longevity are chosen.
TABLE I: Amazon EC2 VMs employed for benchmarking
VM Type vCPUs Memory (GiB)
Processor Clock (GHz)
m1.xlarge 4 15.0 Intel Xeon E5-2650 2.00
m2.xlarge 2 17.1 Intel Xeon E5-2665 2.40
m2.2xlarge 4 34.2 Intel Xeon E5-2665 2.40
m2.4xlarge 8 68.4 Intel Xeon E5-2665 2.40
m3.xlarge 4 15.0 Intel Xeon E5-2670 2.60
m3.2xlarge 8 30.0 Intel Xeon E5-2670 2.60
cr1.8xlarge 32 244.0 Intel Xeon E5-2670 2.60
cc2.8xlarge 32 60.5 Intel Xeon X5570 2.93
hi1.4xlarge 16 60.5 Intel Xeon E5620 2.40
hs1.8xlarge 16 117.0 Intel Xeon E5-2650 2.00
B. System Design
DocLite has three main components, namely (1) a web portal, (2) middleware and (3) a benchmark repository as shown in Figure 1.
1) Web Portal: This user facing component is developed using MVC.NET and Bootstrap. A user provides as input a set of four weights W = {W1, W2, W3, W4} that characterises
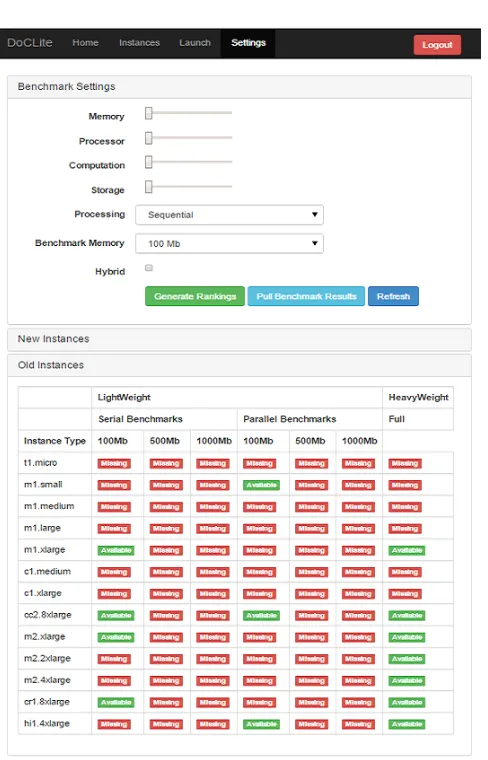
the application to be deployed on the cloud; the amount of memory and number of cores to be benchmarked along with preferences of whether the benchmark needs to be executed sequentially or in parallel. The portal is also responsible for displaying the status of the cloud VMs that are used and the ranks generated from the benchmarks. A screenshot of DocLite is shown in Figure 2.
2) Middleware: This component comprises a Benchmark
Controller and a Cloud Controller. The Benchmark Controller (i) incorporates the algorithms for container-based benchmark-ing methods considered in Section III, (ii) pulls benchmark data from the repository for grouping and normalising the data, and (iii) generates the score for each VM based on the weights provided by the user.
The Cloud Controller comprises of a Cloud Manager and a Cloud Monitor. The manager initiates cloud VMs and main-tains them by executing the appropriate scripts for installing
Fig. 1: Architecture of DocLite
Fig. 2: DocLite screenshot; top shows the sliders for providing weights, bottom shows list of Amazon instances benchmarked (‘Available’ indicates benchmarking data is in the repository, and ‘Missing’ shows instances that need to be benchmarked)
necessary packages and setting up Docker on the VM. The Docker images that are used are retrieved from the Docker Hub3 by the manager. The benchmarked data is deposited by the manager into the repository.
The monitor keeps track of the benchmarks that have started
3https://hub.docker.com/
on the cloud VMs and reports the status of the VM to the portal. Monitoring is important to the Benchmark Controller to retrieve data from the repository after benchmarking.
3) Benchmark Repository: The benchmark data obtained from the cloud is stored in a repository used by the Benchmark Controller for generating scores. Both historic and current benchmark data are stored in the repository. If the native method is chosen, then the current benchmark data is used, where as if the hybrid method is chosen, then the historic data is used along with the current data.
III. CONTAINER-BASEDBENCHMARKINGMETHODS
In this section, two container-based cloud benchmarking methods are proposed and presented. The first is referred to as a native method that employs Docker container technology to benchmark cloud VMs in real-time. The second method, combines the use of benchmarks from the first along with historic benchmarks generated by benchmarking the entire VM as a hybrid. The aim of both methods is to generate a ranking of cloud VMs based on performance. The benefit of using containers is that the amount of VM resources benchmarked, such as memory size and the number of CPU cores, can be limited. This benefit is leveraged such that only a small amount of resources available to a VM are benchmarked in comparison to benchmarking the entire resource of a VM.
A user can opt for either the native or hybrid method. A set of user defined weights, W (considered later in this section), and historic benchmark data, HB, obtained from benchmarking the entire VM or from previous ex-ecutions of the lightweight methods can be provided as input. The lightweight benchmarks are obtained from
Obtain-Benchmark, considered in Algorithm 1, which is represented as B.Native-Method (Algorithm 2) takes as input W andB and Hybrid-Method(Algorithm 3) takes
HB as additional input.
Algorithm 1 gathers benchmarks from different cloud VMs. Consider there arei= 1,2,· · ·, mdifferent VM types, and a VM of type i is represented as vmi as shown in Line 2. A containerciis created on each VM inLine 3. In the context of
cloud benchmarking, containers are used to facilitate bench-marking on different types of VMs by restricting the amount of resources used.
In Line 4, standard tools are executed using the container
[image:3.612.55.299.180.560.2]Algorithm 1 Obtain cloud benchmarks
1: procedureOBTAIN–BENCHMARK(mem,CP U cores) 2: foreach virtual machine vmi∈V M do
3: Create containerci ofmemsize andCP U cores
onvmi
4: Execute standard benchmark tool onci
5: Store benchmarks asB
6: end for 7: end procedure
VMs shown in Table I were benchmarked using DocLite by executing lmbench. The latency and bandwidth information for a wide range of memory and process, computation, local communication and file related operations are collected. In Line 5, the benchmarks obtained for eachvmi are stored in a file, B, for use by Algorithm 2 and Algorithm 3.
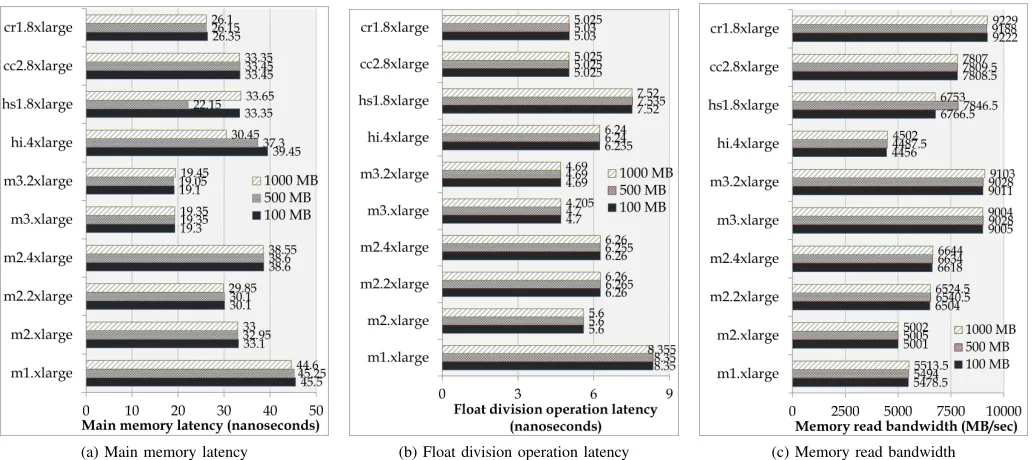
Benchmarks for over fifty attributes related to memory and process, local communication, computation, and storage were obtained using containers of 100MB, 500MB and 1000MB. It is not within the scope of this paper to present all benchmarks. Therefore, a sample of three benchmarks is presented as shown in Figure 3.
Figure 3a shows the main memory latency for all VMs. It is immediately inferred that with the exception of hs1.8xlarge and hi1.4xlarge the main memory latencies are comparable for different container sizes. The exceptions are artefacts of measurements over networks. The best main memory performance is for them3instances. Figure 3b shows the latency for a float division operation on each VM. Again, similar results are obtained for different container sizes. The bandwidth of memory read operations on all VMs are shown in Figure 3c. Maximum memory bandwidth is available on cr1.8xlarge.
The key observation from the above three samples (also observed in the entire benchmarked data) is that there is a minimal difference on average of less than 2% between the data points when a container of 100MB, 500MB or 1000MB is used. Given this small difference for different container sizes and the time taken to benchmark a VM using a small container is lower than a larger container, we hypothesise that (i) the benchmarking methods incorporated in DocLite can be employed in real-time, and (ii) VM rankings generated using the lightweight benchmarking methods will be comparable to methods that benchmark the entire VM. This hypothesis will be evaluated in Section IV using three case study applications.
A. Native Method
The native method for generating ranks of VMs based on performance is shown in Algorithm 2. Historic benchmark data is not employed in this method. The benchmark data obtained from using containers, B, is used as shown inLine 1.
Consider there are j = 1,2,· · ·, nattributes of a VM that are benchmarked, and ri,j is the value associated with each jth attribute on theith VM. In Line 2, the attributes can be
grouped asGi,k={ri,1, ri,2,· · ·}, where i= 1,2,· · ·m,k=
Algorithm 2 Cloud ranking using native method
1: procedure NATIVE–METHOD(W,B)
2: FromB, organise benchmarks into groups, G
3: Normalise groups,G¯
4: ScoreV M using G.W¯
5: Generate performance ranksRp
6: end procedure
1,2,· · ·, p, and p is the number of attribute groups. In this paper, four attribute groups are considered.
Firstly,Memory and Process Group, denoted asG1captures
the performance and latencies of the processor. Main memory and random memory latencies of the VMs and L1 and L2 cache latencies are considered in this group.
Secondly,Local Communication Groupin which the band-width of both memory communications and interprocess communications are captured under the local communica-tion group, denoted as G2. Memory communication metrics,
namely the rate (MB/sec) at which data can be read from and written to memory, and interprocess communication metrics, namely the rate of data transfer between Unix pipes, AF Unix sockets and TCP are considered in this group.
Thirdly,Computation Group, denoted asG3which captures
the performance of integer, float and double operations such as addition, multiplication and division and modulus.
Fourthly, Storage Group in which the file I/O related at-tributes are grouped together and denoted as G4. Sequential
create, read and delete and random create, read and delete operations are considered in this group.
In Line 3, the attributes of each group are normalised as
¯
ri,j= ri,j−µj
σj , whereµjis the mean value of attributeri,jover
m VMs andσj is the standard deviation of the attribute ri,j
over m VMs. The normalised groups are denoted as Gi,k¯ =
{ri,¯ 1,ri,¯ 2,· · ·}, where i = 1,2,· · ·m, k= 1,2,· · ·, p, and p
is the number of groups.
One input to Algorithm 2 is W, which is a set of weights that correspond to each group (for the four groups
G1, G2, G3, G4, the weights are W = {W1, W2, W3, W4}).
For a given application, a few groups may be more important than the others. For example, if there are a large number of file read and write operations in a simulation, the Storage group represented asG4 is important. The weights are provided by
the user based on domain expertise and the understanding of the importance of each group to the application. Each weight,
Wk, wherek= 1,2,3,4 takes value between 0 and 5, where
0 indicates that the group is not relevant to the application and 5 indicates the importance of the group for the application.
In Line 4, each VM is scored as Si = ¯Gi,k.Wk. In Line 5, the scores are ordered in a descending order for generating
Rpi which is the ranking of VMs based on performance.
B. Hybrid Method
(a) Main memory latency (b) Float division operation latency (c) Memory read bandwidth
Fig. 3: Sample lmbench benchmarks obtained from DocLite for 100MB, 500MB and 1000MB containers
execution of the native method as shown in Algorithm 3 which is shown inLine 1. This method accounts for past and current performance of a VM for generating ranks.
Algorithm 3 Cloud ranking using hybrid method
1: procedureHYBRID–METHOD(W,B,HB) 2: From B, organise benchmarks into groups,G
3: Normalise groups,G¯
4: From HB, organise historic benchmarks into groups,
HG
5: Normalise groups,HG¯
6: Score V M using G.W¯ + ¯HG.W
7: Generate performance ranks Rp
8: end procedure
Grouping attributes and normalising them inLines 2-3 are similar to those followed in Algorithm 2. The four groups used in the native method are used here and the attributes are normalised using the mean and standard deviation values of each attribute.
When historic benchmarks are used, the method for group-ing the attributes and normalisgroup-ing them are similar to what was followed previously. In Line 4, the attributes from his-toric benchmark data, hr, can be grouped as HGi,k =
{hri,1, hri,2,· · ·}, where i = 1,2,· · ·m for m VM types, k= 1,2,· · ·, p, andpis the number of groups. Four groups,
HG1,HG2,HG3 andHG4, are obtained.
In Line 5, the attributes of each group are normalised as
¯
hri,j = hri,j−hµj
hσj , where hµj is the mean value of attribute
hri,j over m VMs and hσj is the standard deviation of
the attribute hri,j over m VMs. The normalised groups are
denoted asHG¯ i,k={hr¯i,1,hr¯i,2,· · ·}, wherei= 1,2,· · ·m, k= 1,2,· · ·, p, andpis the number of groups.
The set of weights supplied to the hybrid method are same as the native method. Based on the weights each VM is scored as Si = ¯Gi,k.Wk +HG¯ i,k.Wk in Line 6. The scores take
the most current and historic benchmarks into account and are ordered in descending order for generatingRpi inLine 7 which is the performance ranking of the VMs.
Both the native and hybrid methods are incorporated in DocLite and they are further evaluated against real world applications in the next section.
IV. EXPERIMENTALSTUDIES
In this section, three case study applications are used to evaluate the benchmarking methods. The initial hypotheses of this research are: (i) lightweight benchmarking can be employed in real-time, and (ii) VM rankings generated from lightweight benchmarking methods will be comparable to the rankings obtained from benchmarking the entire VM. The evaluation to validate the hypotheses firstly compares the time taken to execute the benchmarks using containers on the VMs and on the entire VM. Secondly, the validation compares VM rankings generated by the native and hybrid lightweight benchmarking methods, we refer to benchmarked ranks, and the ranks obtained by execution on the entire VM, referred to as the empirical ranks.
A. Case Study Applications
Size
Average time (minutes)
m1.xlarge m2.xlarge m2.2xlarge m2.4xlarge m3.xlarge m3.2xlarge hi1.4xlarge hs1.4xlarge cc2.8xlarge cr1.8xlarge
Container
100MB 8 8 9 8 7 7 8 9 8 8
500MB 13 12 13 12 11 11 14 12 13 12
1000MB 19 19 18 21 15 16 18 17 18 18
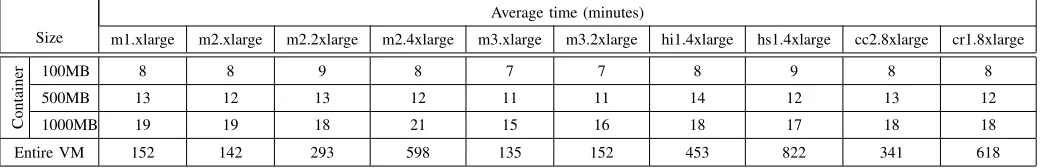
[image:6.612.49.570.48.132.2]Entire VM 152 142 293 598 135 152 453 822 341 618
TABLE II: Average time for executing benchmarks using 100MB, 500MB and 1000MB containers and on the whole VM
for different time steps. The simulation is memory intensive with numerous read and write operations and computationally intensive requiring a large number of float operations. Local communication between processes are less relevant and the application does not require file operations.
The second case study is a risk simulation that generates probable maximum losses due to catastrophic events [16]. The simulation considers over a million alternate views of a given year and a number of financial terms to estimate losses. The simulation is memory intensive with numerous read and write operations and at the same time computationally intensive requiring a large number of float operations to be performed both to compute the risk metrics. The local communication between processes are less relevant and the application does not require file operations.
The third case study is a block triagonal solver, which is a NASA Parallel Benchmark (NPB), version 3.3.1 4 [17]. This mathematical solver is used on a grid size of 162×162×
162for 200 iterations. The solver is numerically intensive and memory and processor related operations are relevant, but does not take precedence over computations. Local communications and file operations have little effect on the solver.
B. Evaluation
The aims of the experimental evaluation are to address two important research questions related to lightweight bench-marking. They are: 1) how fast can lightweight benchmarking execute compared to benchmarking the entire VM? and 2) how accurate will the benchmarked data generated from lightweight methods be?
1) Execution Time of Benchmarks: The first question re-lated to speed is addressed by demonstrating the feasibility of the proposed lightweight benchmarking methods in real-time on the cloud. For this, the time taken to execute the lightweight benchmarking methods are compared against the time taken to benchmark the entire VM as shown in Table II. On an average the 100 MB, 500 MB, and 1000 MB containers take 8 minutes, 13 minutes and 18 minutes to complete benchmarking on all the VMs. Benchmarking the whole VM takes up to 822 minutes for hs1.4xlarge. It is immediately evident that container-based benchmarking is between 19-91 times faster than the benchmarking the entire VM.
2) Accuracy of Benchmarks: The second question related to accuracy is addressed by evaluating the lightweight methods
4https://www.nas.nasa.gov/publications/npb.html
against three real-world case study applications. For this, ranks obtained from DocLite by benchmarking the application based on a user’s input weights that describe an application are compared against actual ranks of VMs when the application is executed on the VM. The following five steps are used to evaluate the accuracy of the benchmarks:
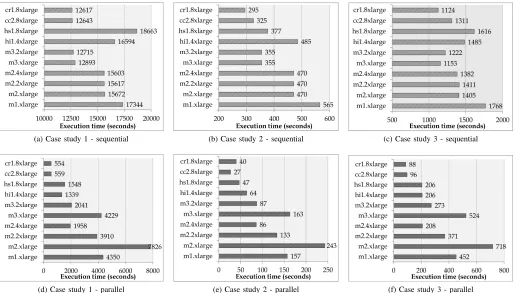
Step 1 - Execute the three case study application on all VMs. The time taken to execute the applications sequentially is presented in Figure 4a to Figure 4c and to execute the ap-plications in parallel using all available vCPUs is presented in Figure 4d to Figure 4e. In all case studies, thecr1.8xlarge
andcc2.8xlargehave best performance; these VMs show good performance in memory and process and computation groups. The m3 VMs are close competitors for sequential execution and hi1.4xlarge and hs1.8xlargeperform well for parallel execution. The results from parallel execution depend on the number of vCPUs available on the VM.
Step 2 - Generate empirical ranks for the case study.The empirical ranks are generated using the standard competition ranking approach. The lowest time translates to the highest rank. If there are two VMs with the same program execution time they get the same rank and the ranking is continued with a gap. For example, in Figure 4a, m3.2xlarge and
m3.xlarge have the same program execution time. Both VMs have third rank and the next best performing VM,
hs1.8xlargeobtains the fifth rank.
Step 3 - Provide weights of the application to DocLite.To generate the rankings from DocLite, a user provides the set of weightsW that characterise the case study applications which was considered in Section III-A. In consultation with domain scientists and practitioners, the weights for the three case stud-ies are{4,3,5,0},{5,3,5,0}and{2,0,5,0}respectively. The above ranks were provided as input to the two benchmarking methods.
Step 4 - Obtain benchmark ranks for the application.The empirical and benchmarking ranks for the three case studies using the native and hybrid methods are obtained (Tables III to V show the ranks for the native approach. Tables VI to VIII show the ranks for the case studies using the hybrid method in which data from the native method along with data obtained previously from benchmarking the entire VM were considered).
(a) Case study 1 - sequential (b) Case study 2 - sequential (c) Case study 3 - sequential
[image:7.612.50.566.58.351.2](d) Case study 1 - parallel (e) Case study 2 - parallel (f) Case study 3 - parallel
Fig. 4: Sequential and parallel execution times for the case study applications
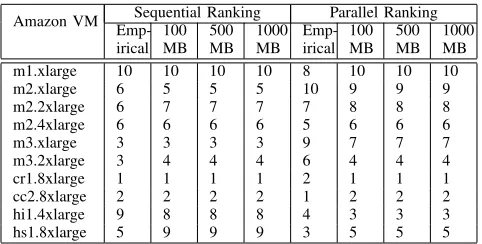
Amazon VM Sequential Ranking Parallel Ranking
Emp-irical 100 MB
500 MB
1000 MB
Emp-irical
100 MB
500 MB
[image:7.612.317.559.391.515.2]1000 MB m1.xlarge 9 10 10 10 9 10 10 10 m2.xlarge 7 4 4 5 10 8 8 8 m2.2xlarge 6 7 6 7 7 9 9 9 m2.4xlarge 5 6 7 6 5 6 6 6 m3.xlarge 4 3 3 3 8 7 7 7 m3.2xlarge 3 5 5 5 6 4 3 4 cr1.8xlarge 1 1 1 1 1 1 1 1 cc2.8xlarge 2 2 2 2 2 2 2 2 hi1.4xlarge 8 8 8 8 3 3 4 3 hs1.8xlarge 10 9 9 9 4 5 5 5
TABLE III: Case Study 1: Empirical and benchmark rankings for the native benchmarking method
Amazon VM Emp-Sequential Ranking Parallel Ranking
irical 100 MB
500 MB
1000 MB
Emp-irical
100 MB
500 MB
[image:7.612.57.297.392.515.2]1000 MB m1.xlarge 10 10 10 10 8 10 10 10 m2.xlarge 6 5 5 4 10 8 8 8 m2.2xlarge 6 7 6 7 7 9 9 9 m2.4xlarge 6 6 7 6 5 6 6 6 m3.xlarge 3 3 3 3 9 7 7 7 m3.2xlarge 3 4 4 5 6 4 4 4 cr1.8xlarge 1 1 1 1 2 1 1 1 cc2.8xlarge 2 2 2 2 1 2 2 2 hi1.4xlarge 9 8 8 8 4 3 3 3 hs1.8xlarge 5 9 9 9 3 5 5 5
TABLE IV: Case Study 2: Empirical and benchmark rankings for the native benchmarking method
Amazon VM Sequential Ranking Parallel Ranking
Emp-irical 100 MB
500 MB
1000 MB
Emp-irical
100 MB
500 MB
[image:7.612.320.560.561.682.2]1000 MB m1.xlarge 10 10 10 10 8 10 10 10 m2.xlarge 6 5 5 5 10 8 8 8 m2.2xlarge 7 7 7 7 7 9 9 9 m2.4xlarge 5 6 6 6 5 6 6 6 m3.xlarge 2 3 3 3 9 7 7 7 m3.2xlarge 3 4 4 4 6 5 5 5 cr1.8xlarge 1 1 1 1 1 2 2 2 cc2.8xlarge 4 2 2 2 2 1 1 1 hi1.4xlarge 8 8 8 8 3 3 3 3 hs1.8xlarge 9 9 9 9 3 4 4 4
TABLE V: Case Study 3: Empirical and benchmark rankings for the native benchmarking method
Amazon VM Emp-Sequential Ranking Parallel Ranking
irical 100 MB
500 MB
1000 MB
Emp-irical
100 MB
500 MB
1000 MB m1.xlarge 9 10 10 10 9 10 10 10 m2.xlarge 7 5 5 5 10 9 9 9 m2.2xlarge 6 7 7 7 7 8 8 8 m2.4xlarge 5 6 6 6 5 6 6 6 m3.xlarge 4 3 3 3 8 7 7 7 m3.2xlarge 3 4 4 4 6 4 4 4 cr1.8xlarge 1 1 1 1 1 1 1 1 cc2.8xlarge 2 2 2 2 2 2 2 2 hi1.4xlarge 8 8 8 8 3 3 3 3 hs1.8xlarge 10 9 9 9 4 5 5 5
[image:7.612.55.296.561.683.2]Amazon VM Sequential Ranking Parallel Ranking Emp-irical 100 MB 500 MB 1000 MB Emp-irical 100 MB 500 MB 1000 MB m1.xlarge 10 10 10 10 8 10 10 10 m2.xlarge 6 5 5 5 10 9 9 9 m2.2xlarge 6 7 7 7 7 8 8 8 m2.4xlarge 6 6 6 6 5 6 6 6 m3.xlarge 3 3 3 3 9 7 7 7 m3.2xlarge 3 4 4 4 6 4 4 4 cr1.8xlarge 1 1 1 1 2 1 1 1 cc2.8xlarge 2 2 2 2 1 2 2 2 hi1.4xlarge 9 8 8 8 4 3 3 3 hs1.8xlarge 5 9 9 9 3 5 5 5
TABLE VII: Case Study 2: Empirical and benchmark rankings for the hybrid benchmarking method
[image:8.612.324.552.84.191.2]Amazon VM Sequential Ranking Parallel Ranking Emp-irical 100 MB 500 MB 1000 MB Emp-irical 100 MB 500 MB 1000 MB m1.xlarge 10 10 10 10 8 10 10 10 m2.xlarge 6 5 5 5 10 9 9 9 m2.2xlarge 7 7 7 7 7 8 8 8 m2.4xlarge 5 6 6 6 5 6 6 6 m3.xlarge 2 3 3 3 9 7 7 7 m3.2xlarge 3 4 4 4 6 4 4 4 cr1.8xlarge 1 1 1 1 1 1 1 1 cc2.8xlarge 4 2 2 2 2 2 2 2 hi1.4xlarge 8 8 8 8 3 3 3 3 hs1.8xlarge 9 9 9 9 3 5 5 5
TABLE VIII: Case Study 3: Empirical and benchmark rank-ings for the hybrid benchmarking method
As mentioned in Section III, if there are i = 1,2,· · ·, m
different VMs, and each VM is represented as vmi, then the performance rank obtained from each VM is Rpi. If the empirical rank of each VM by executing the case study application is Rei, then the absolute distance between the ranks is d = |Rpi −Rei|. The sum of distances can be
represented asds=
m
P
i=1
|Rpi−Rei|.
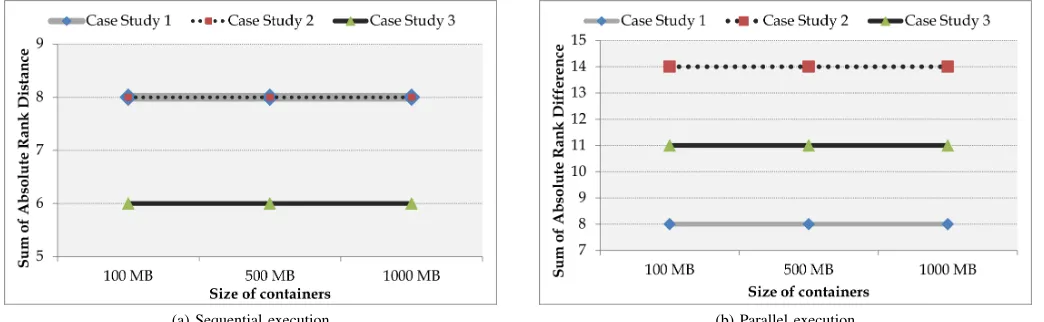
Figure 5 and Figure 6 shows the sum of rank distances of sequential and parallel executions of each case study using 100 MB, 500 MB and 1000 MB containers using the native and hybrid methods respectively. The sum of rank distances provide one view for comparing the ranks obtained from using different container sizes; lower values of the sum of rank dis-tances translate to a higher correlation between empirical and benchmark ranks. Consider the plot of sequential execution of Case Study 3 for example in Figure 5a. It is inferred that using a large container does not reduce the sum of rank distances. Different size of containers produce the same sum of rank distances. With the exception of sequential execution for Case Study 1 in Figure 5a and Figure 5b, a larger size container does not produce better results than a 100 MB container. This inference is again confirmed by the plots in Figure 6.
Step 5 - Find correlation of benchmark and empirical ranks. Given the rank tables for each case study it is important to determine the accuracy (or quality) of the ranks. In this paper, the accuracy of results is the correlation between the empirical ranks and the benchmark ranks. This quality measure validates
the feasibility of using lightweight benchmarks and guarantees results obtained from benchmarking correspond to reality.
Case study Sequential Ranking Parallel Ranking 100 MB 500 MB 1000 MB 100 MB 500 MB 1000 MB Native method
1 89.1 87.9 92.1 90.3 86.7 90.3 2 88.5 88.5 84.7 83.0 83.0 83.0 3 95.2 95.2 95.2 87.6 87.6 87.6 Hybrid method
[image:8.612.48.292.208.332.2]1 93.9 93.9 93.9 93.9 93.9 93.9 2 88.5 88.5 88.5 86.7 86.7 86.7 3 95.2 95.2 95.2 88.8 88.8 88.8
TABLE IX: Correlation (in %) between empirical and bench-marking ranks for the native and hybrid benchbench-marking meth-ods
InStep 5, the correlation of the benchmark ranks using dif-ferent containers and the empirical ranks for benchmarking is determined and shown in Table IX; the percentage value shows the degree of correlation. Higher the correlation value the more robust is the benchmarking method since it corresponds more closely to the empirical ranks.
There is on an average there is over 90% and 86% cor-relation between the empirical and benchmarked sequential and parallel ranks respectively for the native method. It is observed that increasing the size of the container does not generally increase the correlation between the ranks. The smallest container of 100 MB performs as well as the other containers. There is an average improvement of 1%-2% in the correlation between the ranks for the hybrid method. While the hybrid method can improve the ranks, it is observed that the position of the top three ranks are not affected. Again, using smaller containers do not change the quality of results.
C. Summary
Three key observations are summarised from the exper-imental studies. Firstly, small containers using lightweight benchmarks perform similar to large containers. There is no significant improvement in the quality of results with larger containers. On average, there is over 90% and 86% correlation when comparing ranks obtained from the empirical analysis and the 100 MB container.
Secondly, the hybrid method slightly improves the quality of the benchmark rankings, although the position of the top three ranks do not change. The lightweight method is sufficient to maximise the performance of an application on the cloud. Implementing hybrid methods will require the storage of historic benchmark data and its maintenance over time. Efficient methods for assigning weights to data based on how recent it is will need to be developed.
(a) Sequential execution (b) Parallel execution
Fig. 5: Sum of absolute distances for the native benchmarking method
(a) Sequential execution (b) Parallel execution
Fig. 6: Sum of absolute distances for the hybrid benchmarking method
V. RELATEDWORK
Benchmarking can capture the performance of a computing system [18]. Standard benchmarks such as Linpack are used for ranking the top supercomputers [19]. However, there are fewer standards for benchmarking methods that are accepted by the cloud community. Currently, there are a number of ongoing efforts to develop standard methods applicable on the cloud [4], [20]. Benchmarking is usually performed directly on a VM by using all resources available to the entire VM. This is done in order to generate accurate benchmarks and takes a few hours to complete on large VMs. Such time consuming benchmarking methods cannot be used in real-time although they can generate accurate and detailed benchmark data.
Benchmarking methods need to be (i) employed in near real-time and (ii) produce accurate benchmarks to facilitate cloud performance benchmarking in a meaningful way. This is important because VMs have different performance char-acteristics over time and sometimes even during small time periods. For example, a real-time benchmarking method is used for selecting VMs that match application requirements
by Netflix [21]. Alternate virtualisation technology, such as containers with low boot up times and a high degree of resource isolation are likely to be the way forward to achieve lightweight methods that are not only fast but also produce reliable benchmark data [22], [10].
There is preliminary research that highlights the lower overheads of containers when compared to existing virtualisa-tion technologies both for both high-performance computing systems as well as for the cloud [23], [24]. Containers on the cloud as a research topic is gaining momentum and there is recent research reporting the benefit of containers for distributed storage [25], reproducibility of research [26], and in the context of security [27]. However, container technology has not yet been adopted for benchmarking. In this paper, we developed lightweight benchmarking methods for VMs that can be used in near real-time to produce reliable benchmarks.
VI. CONCLUSIONS
[image:9.612.47.569.267.428.2]since they benchmark an entire VM for obtaining accurate benchmarks, thereby limiting their real-time use. In this paper, we explored an alternative to existing benchmarking methods to generate accurate benchmarks in near real-time by using containers as a means to achieve lightweight benchmarking.
In the research presented in this paper, Docker Container-based Lightweight Benchmarking tool, referred to as ‘DocLite’ was developed to facilitate lightweight benchmarking. Do-cLite organises the benchmark data into four groups, namely memory and process, local communication, computation and storage. A user of DocLite provides as input a set of four weights (ranging from 0 to 5), which indicate how important each of the groups are to the application that needs to be deployed on the cloud. The weights are mapped onto the four benchmark groups and are used to generate a score for ranking the VMs according to performance. DocLite incorporates two benchmarking methods. In the first mode, referred to as the na-tive method, containers are used to benchmark a portion of the VM to generate ranks of cloud VMs, and the second in which data obtained from the first method is used in conjunction with historic data as a hybrid. DocLite is available to download from https://github.com/lawansubba/DoCLite. Benchmarking using DocLite is between 19-91 times faster than benchmark-ing the entire VM makbenchmark-ing lightweight methods suitable for use in real-time. The experimental results highlight that the benchmarks obtained from container-based methods are on an average over 90% accurate making them as reliable as benchmarking an entire VM. Container-based technology is useful for benchmarking on the cloud and can be used for developing fast and reliable benchmarking methods.
The native and hybrid approaches only considers local communication and do not take network communication into account. In the future, we aim to extend the tool for includ-ing network communications to benchmark applications that execute on multiple VMs and data centres.
ACKNOWLEDGMENT
This research was pursued under the EPSRC grant, EP/K015745/1, a Royal Society Industry Fellowship, an Eras-mus Mundus Master’s scholarship and an AWS Education Research grant.
REFERENCES
[1] A. Iosup, S. Ostermann, N. Yigitbasi, R. Prodan, T. Fahringer and D. Epema, “Performance Analysis of Cloud Computing Services for Many-Tasks Scientific Computing,” IEEE Transactions on Parallel and Distributed Systems, Vol. 22, Issue 6, 2011, pp. 931-945.
[2] B. F. Cooper, A. Silberstein, E. Tam, R. Ramakrishnan and R. Sears, “Benchmarking Cloud Serving Systems with YCSB,” Proceedings of the 1st ACM Symposium on Cloud Computing, 2010, pp. 143-154. [3] B. Varghese, O. Akgun, I. Miguel, L. Thai and A. Barker, “Cloud
Bench-marking for Performance,” Proceedings of the 6th IEEE International Conference on Cloud Computing Technology and Science, 2014, pp. 535-540.
[4] E. Folkerts, A. Alexandrov, K. Sachs, A. Iosup, V. Markl and C. Tosun, “Benchmarking in the Cloud: What it Should, Can, and Cannot Be,” Selected Topics in Performance Evaluation and Benchmarking (Editors: R. Nambiar and M. Poess), Lecture Notes in Computer Science, 2013. [5] A. Barker, B. Varghese and L. Thai, “Cloud Services Brokerage: A Sur-vey and Research Roadmap,” Proceedings of the 8th IEEE International Conference on Cloud Computing, 2015, pp. 1029-1032.
[6] A. Barker, B. Varghese, J. S. Ward and I. Sommerville “Academic Cloud Computing Research: Five Pitfalls and Five Opportunities,” 6th USENIX Workshop on Hot Topics in Cloud Computing, 2014.
[7] C. Anderson, “Docker [Software Engineering],” IEEE Software, Vol.32, No.3, 2015, pp. 102-105.
[8] J. Bottomley and P. Emelyanov, “Containers,” USENIX ;login:, Vol. 39, No. 5, 2014, pp. 6-10.
[9] W. Felter, A. Ferreira, R. Rajamony and J. Rubio, “An Updated Per-formance Comparison of Virtual Machines and Linux Containers,” IBM Research Report, RC25482 (AUS1407-001), 2014.
[10] D. Bernstein, “Containers and Cloud: From LXC to Docker to Kuber-netes,” IEEE Cloud Computing, Vol. 1, Issue 3, 2014, pp. 81-84. [11] VMWare Blogs, “Docker Containers Performance in VMware
vSphere,” https://blogs.vmware.com/performance/2014/10/docker-containers-performance-vmware-vsphere.html [Last accessed: 01 February 2016]
[12] VMWare Blogs, “Running Transactional Work-loads Using Docker Containers on vSphere 6.0,” https://blogs.vmware.com/performance/2015/05/running-transactional-workloads-using-docker-containers-vsphere-6-0.html [Last accessed: 01 February 2016]
[13] C. Staelin, “lmbench - An Extensible Micro-benchmark Suite,” Software - Practice and Experience, Vol. 35, Issue 11, 2005, pp. 1079-1105. [14] S. Ostermann, A. Iosup, R. Prodan, T. Fahringer and D. Epema, “A
Performance Analysis of EC2 Cloud Computing Services for Scientific Computing,” Lecture Notes of the Institute for Computer Sciences, Social-Informatics and Telecommunications Engineering, Vol. 34, 2010, pp 115-131.
[15] K. J. Bowers, E. Chow, H. Xu, R. O. Dror, M. P. Eastwood, B. A. Gregersen, J. L. Klepeis, I. Kolossvary, M. A. Moraes, F. D. Sacerdoti, J. K. Salmon, Y. Shan and D. E. Shaw, “Scalable Algorithms for Molecular Dynamics Simulations on Commodity Clusters,” Proceedings of the ACM/IEEE Conference on Supercomputing, Article No. 84, 2006. [16] A. K. Bahl, O. Baltzer, A. Rau-Chaplin, and B. Varghese, “Parallel
Simulations for Analysing Portfolios of Catastrophic Event Risk,” SC Companion in International Conference of High Performance Comput-ing, NetworkComput-ing, Storage and Analysis, 2012, pp. 1176-1184. [17] D. H. Bailey, E. Barszcz, J. T. Barton, D. S. Browning, R. L. Carter,
L. Dagum, R. A. Fatoohi, P. O. Frederickson, T. A. Lasinski, R. S. Schreiber, H. D. Simon, V. Venkatakrishnan, S. K. Weeratunga, “The NAS Parallel Benchmarks - Summary and Preliminary Results,” Proceedings of the ACM/IEEE Conference on Supercomputing, 1991, pp. 158-165.
[18] D. Kaeli and K. Sachs, “Computer Performance Evaluation and Bench-marking,” Lecture Notes on Computer Science 5419, Springer, 2009. [19] J. J. Dongarra, P. Luszczek and A. Petitet, “The LINPACK Benchmark:
Past, Present and Future,” Concurrency and Computation: Practice and Experience, Vol. 15, 2013, pp. 803-820.
[20] Z. Li, L. O’Brien, H. Zhang and R. Cai, “On a Catalogue of Metrics for Evaluating Commercial Cloud Services,” Proceedings of the 13th International Conference on Grid Computing, 2012, pp.164-173. [21] Brendan Gregg’s Blog, “Performance Tuning Linux Instances
on EC2,” http://www.brendangregg.com/blog/2015-03-03/performance-tuning-linux-instances-on-ec2.html [Last accessed: 01 February 2016] [22] S. Soltesz, H. Potzl, M. E. Fiuczynski, A. Bavier and L. Peterson,
“Container-based Operating System Virtualization: A Scalable, High-performance Alternative to Hypervisors ,” Proceedings of the 2nd ACM SIGOPS/EuroSys European Conference on Computer Systems, 2007, pp. 275-287.
[23] M. G. Xavier, M. V. Neves, F. D. Rossi, T. C. Ferreto, T. Lange, C. A. F. De Rose, “Performance Evaluation of Container-Based Virtualization for High Performance Computing Environments,” Proceedings of the 21st Euromicro International Conference on Parallel, Distributed and Network-Based Processing, 2013, pp. 233-240.
[24] W. Li, A. Kanso and A. Gherbi, “Leveraging Linux Containers to Achieve High Availability for Cloud Services,” Proceedings of the IEEE International Conference on Cloud Engineering, 2015, pp. 76-83. [25] H. Yoon, M. Ravichandran and K. Schwan, “Distributed Cloud Storage
Services with FleCS Containers,” Open Cirrus Summit, 2011. [26] C. Boettiger, “An Introduction to Docker for Reproducible Research,”
ACM SIGOPS Operating Systems Review - Special Issue on Repeata-bility and Sharing of Experimental Artifacts, Vol. 49, Issue 1, 2015, pp. 71-79.