University of Twente
4th July 2013
Characterization of needle-free injection into soft
matter and skin with continuous jets
Authors:
Boris BOOM Hille GROENDIJK
Graduation committee:
Summary
For the pharmaceutical industry needle-free injection methods of liquids are of great im-portance. Despite the potential there are still many problems that need to be investigated before needle-free injection can be succesfully used. It is still unknown how much air is entrained with injection and not much is known about the shape of liquid impacts in skin.
In this report, a high-pressure pump will be used to inject controllable liquid jets with constant velocity into 5 mass percent gelatin as a model for soft human tissue. The pen-etration depth, amount of entrained air and impact characteristics are investigated by recording the impacts with high-speed imaging.
The temporal evolution of the impact shape has been studied and two distinct regimes can be distinguished. In the first regime the penetration can be modelled by a viscous shear stress model and the cylindrical shape of the jet is maintained. During the second penetration regime a spheroidal crater is formed at the end of the cylindrical cavity that was formed in the first regime.
The final depth of the impact is strongly dependent on the jet velocity and increases for higher jet velocity. At a certain jet velocity, v0, the morphology of the final impact
changes. This velocity is 56 m s−1for a 20µm capillary and 27 m s−1for a 50µm
capil-lary for 5 mass percent gelatine.
The crater volume of the impact is also strongly dependent on the jet velocity. Again two regimes can be seen that are related to the shape of the final impact crater. For high jet velocities the ratio Vai r/Vl iquid can increase up to 6. Measurements with artificially
Contents
Summary I
Contents III
1 Introduction 1
2 Theoretical aspects 3
2.1 Impact Models . . . 3
2.1.1 Shear Stress Model . . . 3
2.1.2 Spheroid Model . . . 3
2.2 Jets . . . 4
2.2.1 Types Of Liquid Jets . . . 4
2.2.2 Rayleigh- and wind-induced breakup . . . 5
2.2.3 Jet velocity . . . 5
3 Experimental aspects 7 3.1 Setup . . . 7
3.1.1 Jetting device . . . 7
3.1.2 Sample preparation . . . 7
3.1.3 Breakup . . . 8
4 Results and discussion 9 4.1 Temporal evolution of jet impact in gelatin . . . 9
4.1.1 Gelatin instability . . . 9
4.1.2 Two different penetration regimes . . . 10
4.1.3 Comparison to models . . . 12
4.2 Final depth of jet impact in gelatin . . . 13
4.3 Air entrainment . . . 15
4.4 Different gelatin compositions . . . 16
4.5 Jet impact through human skin . . . 17
5 Conclusion 21
A Materials 25
A.1 Pump . . . 25
A.2 Water . . . 25
A.3 Timings . . . 25
A.4 Nozzles and tubings . . . 25
A.5 Cameras . . . 26
A.6 Lenses . . . 26
A.7 Gelatine preparation . . . 26
A.8 Penetration Across Human Skin In Vitro . . . 26
1
Introduction
Transferring liquids through the skin without physical intrusion of instruments is in de-mand in the pharmaceutical industry. It is essential in countering the spread of dis-eases[4]-[2], inhibiting needlestick injuries[3,5], reducing painful injections and redu-cing the adverse effects of needle phobia[6]. Previous multi-use nozzle jet injectors were designed as early as 1866[11]and became commercially avaiable in the 1940s-1950s, but they appeared to be easily exposed to contamination in the 1980s[12].
Recently, injection methods became safer and cleaner but there are still a lot of properties and phenomena to investigate. Different studies investigated new methods of needle-free injection. However, these previous studies paid no attention to the amount of entrained air in jet impacts and the transition from cylindrically shaped impacts to spheroidically shaped impacts.
To address these subjects of interest a more repeatable method for fluid injection was put forward: the use of a high-pressure pump. Jet velocities up to 80 m s−1can be reached using this setup and due to excellent jetflow control, the amount of entrained air can be measured. The available jet velocity range is relatively small compared to previous single-shot microject injection methods which can reach up to 850 m s−1 [8, 9], but is more than enough to penetrate soft gelatin samples and human skin.
2
Theoretical aspects
2.1
Impact Models
2.1.1 Shear Stress Model
During jet impact two clearly different crater formation regimes can be distinguished. In the first regime the crater has an elongated cylindrical shape as seen in Figure 2.1a. During the second part of the impact the impact crater is spheroidically shaped as will be discussed in Section 2.1.2. This crater formation regime will be modelled as a cylindrical column of water slowing down under the shear stress introduced by the gelatin crater wall. This shear stress model was introduced by Tagawa et al[9]. The viscous shearτw
at the wall is equal to µ∂v/∂r, where µis the dynamic viscosity of the liquid,v is the liquid velocity component in the direction parallel to the wall and r distance from the axis of the cylinder.
In the viscous regime the following relationship between the drag force per unit mass and the velocity holds:
FD=−cv·v, (2.1)
wherecv is a fitting parameter with units s−1. It can be observed that for small jet
velo-cities no penetration of the gelatin occurs. The penetration starts when the jet velocity
vjet reaches the critical velocityvc. Forvjet ≥vcthe temporal evolution of the maximum
depth point is described by
Dma x =
vjet−vc
cv
(1−e−cvt). (2.2)
The final depth of the impact in the shear stress regime can therefore be described by
Dma x =
vjet−vc
cv
. (2.3)
This model is compared to experimental results in Sections 4.1 and 4.2.
2.1.2 Spheroid Model
Air Gelatin
vjet
τw τw
djet
Dma x
(a) Cylinder model
h
w
Air Gelatin
vjet
Dma x
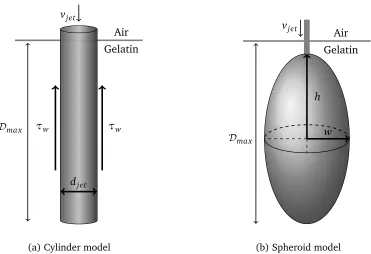
[image:10.595.114.485.97.351.2](b) Spheroid model
Figure 2.1: The impact morphology models for the two different temporal impact re-gimes. The short first regime is given by the cylindrical model in figure (a). The longer second regime is modelled with a growing spheroid as in figure (b).
V =4π
3 ·w
2
·h, (2.4)
wherewis half the width of the spheroid and h is half the height of the spheroid. These dimensions are shown in Figure 2.1b. The volume will grow in time with:
V(t) =V0+α·t, (2.5)
whereαis the effective inflow rate, t is the time andV0is a certain starting volume. By filling in Equation (2.4) we get an expression relating the dimensionsw(t)andh(t) to the volumeV(t):
V(t) = 4π
3 (w(t)
2
·h(t)) =α·t+V0, (2.6)
2.2
Jets
2.2.1 Types Of Liquid Jets
Essentially there are two types of fast, liquid jets available for needle-free injection: single-shot jets and continuous jets. The first kind was used in research by Tagawa et
al[9]where laser pulses were used to generate single-shot microjets. Using this method very high jet velocities can be reached, but only small volumes can be injected. The re-productibity off the amount of liquid injected is low and the jet has an unknown velocity profile as will be explained in section 2.2.3.
In this research continuous jets generated by a high-pressure pump are used. This pump produces jets with a constant volume flow and constant velocity profile. Using this method, the amount of injected volume can be easily controled. Also larger volumes can be injected than with the use of single-shots.
2.2.2 Rayleigh- and wind-induced breakup
At high velocities liquid jets can break up either due to Rayleigh-instability or due to wind-induced break up, depending on jet diameter and jet velocity[10]. With a Rayleigh breakup a small disturbance in the surface of the jet caused by mechanical vibrations or thermal fluctuations will grow when its wavelength exceeds the circumference of the jet. The optimum wavelength for this growth isλopt =
p
2πdjet, which eventually
determ-ines the size of the droplets that the jet will break up in. When the jet velocity is increased the air resistance on the jet due to the relative velocity becomes dominant. Because of the air resistance the fluid and the edge of the jet will slow down, but because the flow is constant, the jet will get an increased diameter and will start to show ridges. Because of this the jet will experience extra air resistance and this will immediately ensure the jet to break up as is shown in Figure 2.2.
The transition from the Rayleigh breakup regime to the wind-induced breakup regime will take place when the inertia force of the air is comparable to the surface tension. This is the case when the Weber number in gas
Weg=
ρg
ρλ·Weλ>0.2, (2.7)
whereρg is the density of the gas, ρλ is the density of the fluid andWeλ is the Weber
number of the fluid.
The jet velocities will fluctuate between approximately 20 m s−1and 80 m s−1and the jet diameters will be 20µm and 50µm. For the 20µmjet the regime transition is 35 m s−1,
this implies that any breakup that occurs above this velocity will be due to air resistance. Jet breakup below 35 m s−1 is due to Rayleigh breakup. With the 50µm jet the
wind-induced breakup will occur above 22 m s−1 and the Rayleigh breakup below 22 m s−1. Section 2.2.3 treats the calculation of the jet velocity. The velocity is not constant for the entire jet, therefore the transition from Rayleigh to wind induced breakup is difficult to determine. In Section 3.1.3 the importance of the jet breakup is treated for this setup.
2.2.3 Jet velocity
Figure 2.2: Wind induced breakup of a 50µm liquid jet traveling from right to left with
an average velocity 34.4 m s−1captured at 1Mfps.
relative error of 2%, the calculated average jet velocityvav g should be very accurate:
vav g=
Qpump
Ajet
=4·Qpump
π·d2jet , (2.8)
whereQpump is the pumpflow in m3s−1,Ajet is the area of a cross section of the jet in
m2 and djet is the jet diameter in m. Observing the flow as a laminar pipe flow, it’s a
known fact that the maximum centerline velocityvcis actually twice as big as the average
velocity in the pipe:
vc=2·vav g, (2.9)
The length of the nozzle is of the same magnitude as the entrance regime. It can be assumed that the flow in the nozzle is a fully developed laminar flow. However, due to air resistance outside the nozzle and the lack of a no-slip boundary condition at the egde of the jet, the jet will return to an approximately homogeneous flow profile before it reaches the sample. It is therefore a good assumption to approximate the jet velocity withvav g.
3
Experimental aspects
3.1
Setup
3.1.1 Jetting device
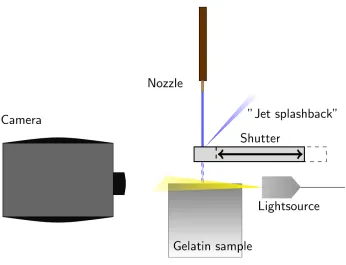
Providing the basis of the setup is a high-pressure Shimadzu pump, which can reach a pressure up to 40MPa or provide a maximum flowrate of 10mL/min. Because of the high pressures the pump requires a certain amount of time to attain the set flow or pressure. In order to shield the sample from the jet before the required jet velocity is reached, an optical shutter with a 200µm thick piece of glass is put in between the nozzle and the
sample. The fluid used is distilled water dyed with a red food dye to increase visibility. The nozzles used have an inner diameter of 20µm and 50µm and were glued to tubings
with a thicker outer diameter to make the nozzle suitable for the setup.
In order to manage the timings of the setup a pulse/delay generator was used, which was connected to the shutter, the camera and the pump. It receives a signal from the pump when it is starting pumping and the pulse/delay generator (PDG) sends a signal to the shutter and the camera after a certain amount of (adjustable) time to open the shutter and start filming respectively.
High-speed cameras (HPV-1, Shimadzu Corporation, Japan, and FAST-CAM SA-7, Photron, USA) were used for the high-speed imaging of the jet impacts. From these images the penetration depth, volume injection and time required to penetrate the skin can be determined. In order for the cameras to get a good view of the microsopic events a long distance microscope (Navigator long distance microscope, 0.5 to 12x magnifica-tion) is used. It can both be mounted on the Shimadzu HPV-1 and the Photron FAST-CAM SA-7.
A schematic overview of the setup is shown in 3.1. Details of the components used in the setup can be found in Appendix A.
3.1.2 Sample preparation
Figure 3.1: Top view of measuring setup
the gelatin samples were placed in the refrigerator (4 °C) for 24 hours.
3.1.3 Breakup
The amount of air entrained in the impact will depend on the form of the jet impacting in the sample. More air will be entrained if the jet has already broken up before impact on the sample. Because it is unknown at which distance from the nozzle the jet will break up due to air resistance or Rayleigh breakup, the distance from the nozzle to the gelatine sample was held constant during all measurements:(1.50±0.25)mm. The deviations in this distance were due to aligment incertainties of the gelatine and the shutter. In some cases the gelatine is flat and all surface is perpendicual to the shutter surface. In other cases the gelatine might be crooked due to cutting errors and therefore gets in touch with the shutter more easily. In these cases the gelatine was positioned at a slightly further distance.
4
Results and discussion
4.1
Temporal evolution of jet impact in gelatin
4.1.1 Gelatin instability
During one continuous jet impact, the characteristics of the crater in the gelatin change over time. In Figure 4.1b the change of the crater shape is shown at different moments during jet impact. In Figure 4.1a the temporal evolution of the maximum depth point,
Dma x, is shown. The red points correspond to the pictures in Figure 4.1b.
Time (ms)
Dm
a
x
(t
)
(m
m
)
0 5 10 15 20 25
0 0.5 1 1.5 2 2.5 3 3.5
(a) Maximum depth point of jet impact
Air
Gelatin 1 mm
0.25 ms 2 ms 7 ms 13.25 ms
14 ms 14.75 ms 17 ms 21.5 ms
[image:15.595.316.507.363.542.2](b) Shape of jet impact
Figure 4.1: Temporal evolution of the shape and maximum depth point of continuous jet impact in 5 mass percent gelatin. The red points in figure (a) correspond to the pictures in figure (b). Jet velocity is(60±10)m s−1and the jet diameter is 20µm
Time (ms) Dm a x (t ) (m m )
0 2 4 6 8 10
0 0.5 1 1.5 2
(a) Linear axes
Time (ms) Dm a x (t ) (m m )
t0=625µs
D0=1.23mm
B
A
10−1 100 101 10−0.3
100 100.3
[image:16.595.84.493.110.305.2](b) Double-logarithmic axes
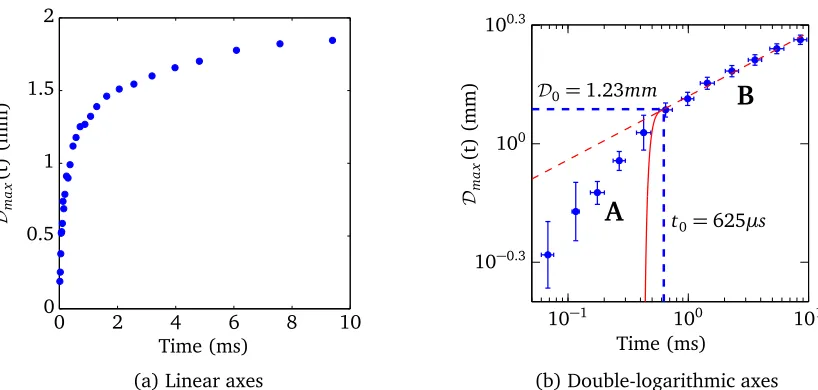
Figure 4.2: Position of maximum depth point of continuous jet impact in 5 mass per-cent gelatin as function of time. Jet velocity is(60±10)m s−1 and the jet diameter is
20µm. The data is averaged from 6 measurements with different time resolutions
ran-ging from 1kfps to 64kfps. Two regimes, A andB, can clearly be distinguished in the double-logarithmic plot.
spread. For the sake of reproducability of the measurements, attention was focused on the first 10 milliseconds of impact.
4.1.2 Two different penetration regimes
In Figure 4.2 the penetration depth during the first 10 milliseconds of the impact of an
(60±10)m s−1, 20µm wide jet is plotted versus time. This penetration corresponds to
the first 10 milliseconds of the impact shown in Figure 4.1 where the fluid forms a single spheroidal crater.
Figure 4.2b shows that there are two different penetration regimes. During the first 625µs in Figure 4.2b the slope of the penetration depth versus time is larger than in the
rest of the plot. The shape of the crater here is cylincrical and approximately 0.5 mm wide. In regime B the slope of the penetration depth versus time has decreased. The shape of the crater becomes spheroidal in this regime.
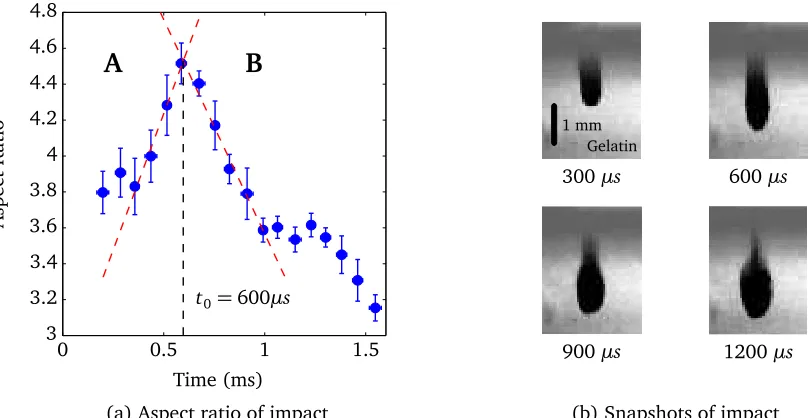
To study the transition between the regimes the aspect ratio of the impact is shown in Figure 4.3a. The aspect ratio is calculated by dividing the maximum depth of the impact by the maximum width. In regime A the aspect ratio increases. This means that the depth is increasing faster than the width of the crater. In this regime the crater has an elongated cylindrical shape as can be seen in Figure 4.3b.
After 600µs the crater width starts growing faster than the depth and the aspect ratio
A
sp
e
ct
R
a
tio
Time (ms) t0=600µs
B
A
0 0.5 1 1.5
3 3.2 3.4 3.6 3.8 4 4.2 4.4 4.6 4.8
(a) Aspect ratio of impact
Gelatin 1 mm
300µs 600µs
900µs 1200µs
[image:17.595.85.489.251.460.2](b) Snapshots of impact
w(t) h(t) L e n g th (m m )
t−t0(ms)
0 2 4 6 8 10
0 0.1 0.2 0.3 0.4 0.5
(a)handwas function of time
Vto ta l ( t ) ( µ L )
t−t0(ms)
0 2 4 6 8 10
0 0.05 0.1 0.15 0.2 0.25 0.3 0.35 0.4 0.45 0.5
[image:18.595.87.490.109.299.2](b) Crater volume as function of time
Figure 4.4: In figure (a) the measured dimensionsh(t) andw(t) from Equation (2.6) for a 20µm,(60±10)m s−1jet impact on 5 mass percent gelatin are shown. In figure (b) the
calculated crater volume is plotted along with the theoretical curve from Equation (2.6) (red) and the pumpvolume (black). The effective inflow was measured to be 44µL and
V0 was measured to be 0.05µL. The pumpflow was 19µL s−1 The errorbars represent
the standard deviation of at least 8 measurements.
therefore decreases. The crater shape becomes spheroidal as can be seen in Figure 4.3b. The moment of transition between the two shapes at 600µs corresponds very well with
the moment of the sudden decrease in penetrating speed in Figure 4.1a (at 625µs).
4.1.3 Comparison to models
The first penetration regime can not be linked to the shear stress model for this jet velo-city. The cylindrical impact crater from Figure 4.3b has a width of 0.5 mm which is 25 times as wide as the original jet. Also the initial penetration velocity is way lower than the jet velocity. This is not what was expected from the shear stress model where the penetrating cylinder has the same diameter as the jet and initially also the same velocity. The solid red line in Figure 4.2b shows the expected result from the shear stress model in (2.2) if regime B was to be entered at t0. The measured temporal evolution of the penetration depth does not correspond to this expected result.
It turned out that the gelatin sample used for these measurements was dried out at the surface. The relatively wide eroded cylindrical hole observed in these measurements is very similar to those observed in samples with a higher density of 11 mass percent gelatin. When the dried out surface layer is eventually penetrated, the penetration does enter the second regime modelled by the growing spheroid.
To check the validity of the model introduced in section 2.1.2 for the axial symmetry
Gelatin
1 mm
Air
[image:19.595.119.476.99.286.2]0µs <250µs 550µs 850µs 3400µs
Figure 4.5: Snapshots of a 20µm jet impacting on a 5 mass percent gelatin sample with
velocity(62.0±1.2)m s−1.
of penetration regimeB, the dimensions w and hfrom Figure 2.1b were measured as function of time. The results are shown in Figure 4.4a. The volumes calculated with Equation (2.6) are plotted in Figure 4.4b along with the straight line predicted by Equa-tion (2.6) (red). The experimental results correspond excellently to the model in this second regime. Also the volume exerted by the pump is plotted as a black dashed line. The difference between the two is due to entrained air that increases the effective inflow. Because the surface of the gelatin was dried out the jet did not penetrate as fast as was expected from the shear stress model but had to erode the hardened surface before the crater could be formed. This is unfortunate but some hints for the validity of the expected penetration from the shear stress model can be found in other measurements. In Figure 4.5 measurements with proper gelatin samples are shown for a comparable jet velocity of(62.0±1.2)m s−1. This figure shows that the jet diameter does remain con-stant during the first moments of impact. After this the spheroidal crater starts growing at the maximum depth point. Unfortunately, no high-speed recordings are available of these measurements. More research is needed to validate the first temporal regime of the jet impact.
4.2
Final depth of jet impact in gelatin
For the measurements of the final crater depth a constant volume of 0.4µL was injected
20µmJet 50µmJet
56m/s v0=
Dm a x (m m )
vjet (m/s)
B
A
10 20 30 40 50 60 70 0 0.5 1 1.5 2 2.5 3 3.5 4 4.5
(a) Detailed results for 20µmjet
50µmJet
v0=27m/s
Dm a x (m m )
vjet (m/s)
B
A
15 20 25 30 35 40 0 0.5 1 1.5 2 2.5 3 3.5 4 4.5
[image:20.595.160.488.111.296.2](b) Detailed results for 50µmjet
Figure 4.6: Maximum depth point after injection of a constant volume of 0.4 µL for different jet velocities and two different jet diameters. In figure (a) the two different regimes for the 20 µm jet are indicated withAandB. Here v0 is the velocity at which
the transition occurs in the crater morphology. This change is shown in Figure 4.7. The results for the 50µmjet are added for comparison. In figure (b) these results are shown in more detail.
was measured after impact has finished, for example the research by Tagawa et al [9]. The results of the final crater depth as function of jet velocity are shown in Figure 4.6 for two different jet diameters.
Again there are two different regimes to be distinguished in these results, indicated withA andB. The jet velocity v0 indicated in the plots is the velocity at which a clear transition was observed between two different morphologies of the final crater. These two different crater morphologies are shown in Figure 4.7. The change in impact mor-phology corresponds fairly to the transition from regimeAto regimeBin Figure 4.6.
The final depth of the crater is determined by two factors. As is treated in Section 4.1.2 there are two impact regimes. In the first regime the inital cylindrical hole is formed to a maximum depth determined by the shear stress model introduced in Section 2.1.1. This maximum depth is velocity dependent and determines the depth at which the sper-oid is going to be created. The second influence on the final depth is the dimension of this spheroid. As will be seen in Section 4.3 the crater volume also depends on jet velo-city. This influence is marginal for vjet < v0but for vjet > v0the crater volume rapidly
increases. This explains the sudden change in slope in Figure 4.6.
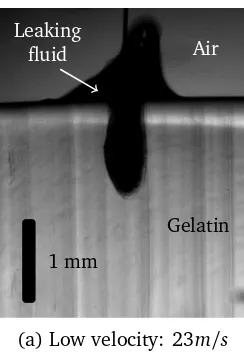
The extra air entrainment that causes the change in slope in Figure 4.6 can also be related to the change in crater morphology. Figure 4.7 shows that for low jet velocity the top of the crater is open. This means that injected fluid and, more importantly, entrained
Air
Gelatin
1 mm Leaking
fluid
(a) Low velocity: 23m/s
Air
Gelatin
[image:21.595.132.254.98.274.2](b) High velocity: 33m/s
Figure 4.7: Morphology of 50µmjet impact of 0.4µL in 5 mass percent gelatin for two different regimes. The morphology in figure (a) is characteristic for impacts in regimeA in Figure 4.6b, impacts in regimeBresemble figure (b). Results for 20µmjet are similar, only the transition takes place at higher velocity.
air can escape during impact. For jet velocities larger than v0 the top of the crater is
closed off by gelatin. This means that all injected fluid and entrained air stays in the crater during impact. This higher effective inflow means that the air entrainment and therefore the final depth of the crater is larger than for jet velocities belowv0.
4.3
Air entrainment
The fluid in the crater during impact seems black on the pictures in this report, even though it is clear water with a little red dye. Water has almost the same index of refrac-tion as gelatin and therefore the crater was expected to appear on the camera with low contrast. That it appears black can only be explained by the presence of air in the crater. In this section the amount of entrained air is quantified.
The volume of all impact craters was calculated assuming axial symmetry. That this assumption is valid can be concluded from Figure 4.4b where the calculated volume grows linear with time as is expected of a spheroid symmetric about the jet axis.
In Figure 4.8a the calculated volume for all the impact craters is plotted versus jet velocity. This figure shows that the total crater volume increases with jet velocity. This in itself says nothing about the amount of entrained air because at low jet velocity fluid leaks out of the crater and the total volume is even less than the injected volume,V0=0.4µL.
For measurements with sufficient jet velocity the ratio of air and liquid in the crater could be obtained. The results are shown in Figure 4.8b.
56m/s v0= 27m/s
vo=
0.4µL V0=
Vto ta l ( µ L )
vjet (m/s)
10 20 30 40 50 60 70 0 0.5 1 1.5 2 2.5 3
(a) Total crater volume
20µmJet 50µmJet
56m/s v0=
27m/s v0=
Va ir / Vli q u id ( µ L )
vjet (m/s)
20 30 40 50 60 70 0 1 2 3 4 5 6 7
[image:22.595.86.489.112.328.2](b) Air volume/Liquid volume
Figure 4.8: In figure (a) the total crater volume is shown as function of jet velocity for two different jet diameters. For each measurement 0.4µL of water was injected into 5 mass percent gelatin. The datapoints in figure (b) correspond to the datapoints in (a) where no leaking from the crater was observed during impact.
of unity. For jet velocities above v0 the top of the crater is closed off by gelatin and a
sudden increase in the amount of entrained is seen. The amount of entrained air grows strongly with jet velocity in this regime. For a 20µm jet that impacts with a velicty of
70 m s−1the crater contains 5 times more air than liquid. This observation could be of
relevance for medical application of such jets.
4.4
Different gelatin compositions
The influence of the gelatin composition on the final crater depth and final crater volume was investigated. Five different gelatin samples of compositions ranging from 3 to 11 mass percent were tested for comparison. In each measurement 0.4µL of fluid was shot
at the gelatin sample with a (57.0±1.2)m s−1, 20
µm jet. The results are shown in
Figure 4.9.
The change in slope in Figure 4.9a again corresponds to the change in morphology from Figure 4.7. The change in morphology of the crater occurs at lower jet velocity for less dense gelatin samples. The position of the change in slope (between 5 and 7 mass percent gelatin) is also consistent with the data in Figure 4.6a where a jet velocity of 57 m s−1lies in regimeB.
The final crater volume in Figure 4.9b decreases with increasing gelatin density. In
Dm a x (m m )
Mass percentage gelatin
2 4 6 8 10 12
0 0.5 1 1.5 2 2.5 3 3.5 4
(a) Final depth
Vto
ta
l
Mass percentage gelatin
2 4 6 8 10 12
0 0.5 1 1.5
[image:23.595.88.494.108.308.2](b) Crater volume
Figure 4.9: Results for jet impact in gelatin samples of various composition. vjet =
57 m s−1and jet diameter is 20
µm. In all measurements 0.4µL of fluid was shot at the
gelatin. The errors represent the standard deviation of at least 3 measurements.
the three most dense samples this says nothing about the air entrainment because these impacts resemble the morphology of regimeAin Figure 4.7a and fluid leaks out during impact. The less dense two samples however resemble the morphology of regimeB in Figure 4.7b and the injected fluid is in both cases 0.4µL. This means that for the 3 mass
percent gelatin sample almost 2.5 times as much air is entrained as in the 5 mass percent sample. Two datapoints is too little to determine the dependence but the amount of entrained air depends strongly on gelatin density.
4.5
Jet impact through human skin
The 5 mass percent gelatin is a good model for soft human tissue, but not for skin. To model needle-free injection into real humans, 700µm thick artificially grown human skin
was positioned on top of the gelatin. This changed the impact dynamics significantly. In Figure 4.10b three different situations are shown during 50µm, 66 m s−1jet impact
on skin. The first picture shows the situation just before the impact starts and the last picture shows the situation where 0.4µL of water has penetrated through the skin. This
last situation resembles the situation without skin in Figure 4.7b although the crater shape is more irregular due to the relatively high jet velocity.
large spread for jet velocities between 60 and 70 m s−1 as can be seen in Figure 4.10a. As is to be expected, the average rupture time decreases strongly with jet velocity.
This extra unpredictable regime at relatively low jet velocities makes these velocities not usable for precise volume injections. A solution to this problem was already proposed by Stachowiak et al[7]. They used a short high-velocity jet for fast penetration of the skin and for control over penetration depth and then lowered the jet velocity for controlled dose injection.
Because of the irregularity of the impact at the high jet velocities needed to penet-rate the human skin the final depths and cpenet-rater volumes were not reproducible. The gelatin already became unstable as in Figure 4.1 before 0.4µL of fluid was injected. The
measurements of the final depth and volume with human skin did only produce three usable datapoints. These datapoints are plotted in Figure 4.11a. The results from the measurements without skin are added for comparison.
The crater is significantly less deep when skin is added on top of the gelatin. This means that even when the skin has ruptured it slows down the jet before it reaches the gelatin by∆v= (18±2)m s−1. The research by Tagawa et al. proposes a repulsive force model for the extra layer of skin. No conclusions can be drawn from this data.
The amount of entrained air is slightly less on samples with skin on top. This could be due to the small tear in the skin reducing the effective diameter of the jet. More research is needed on this subject.
R u p tu re tim e (m s)
vjet (m/s)
55 60 65 70 75 80 0 10 20 30 40 50 60 70 80 90
(a) Skin rupture time
Skin Gelatin 1 mm Before impact Before rupture After rupture
[image:25.595.81.505.110.304.2](b) Pictures of impact on skin
Figure 4.10: In figure (a) the time between first jet impact and skin rupture is plotted as function of jet velocity. The errorbars are determined by taking the standard deviation of at least 3 measurements. For velocities lower than 60 m s−1no rupture of the skin was
observed within 100 ms. In figure (b) three pictures are shown of 66 m s−1, 50
µm jet
impact on artificially grown human skin. The last picture was taken when 0.4µL of fluid
was injected into the gelatin.
With skin Without skin
56m/s v0=
Dm a x (m m )
vjet (m/s)
∆v
B
A
10 20 30 40 50 60 70 80 0 0.5 1 1.5 2 2.5 3 3.5 4 4.5
(a) Depth measurements with skin
With Skin Without skin 56m/s
v0=
Va ir / Vli q u id ( µ L )
vjet (m/s)
45 50 55 60 65 70 75 80 0 1 2 3 4 5 6 7
[image:25.595.316.493.429.606.2](b) Volume measurements with skin
Figure 4.11: Results for measurements with artificially grown human skin on top of 5 mass percent gelatin. A constant volume of 0.4µL is injected in every measurement. In
5
Conclusion
With jet impact on 5 mass percent gelatin two distinct temporal regimes can be distin-guished. During the first short penetration regime the jet maintains its cylindrical shape as it enters the gelatin. The mechanism that slows down the jet is the viscous shear stress model introduced in Section 2.1.1. During the second penetration regime a spheroidal crater is formed at the end of the cylindrical cavity that was formed in the first regime.
The final maximum depth point after an injection of a constant volume of 0.4µL
is strongly dependent on the jet velocity. At a certain jet velocity v0 the morphology of the final impact changes. This change in morphology is shown in Figure 4.7. The threshold velocity v0is 56 m s−1for a 20µm wide jet and 27 m s−1 for a 50µm wide jet
impacting on 5 mass percent gelatin. The threshold velocity also depends on the density of the gelatin sample. The threshold velocity, v0, increases with gelatin density. For jet velocities below v0 the final depth is adequately explained by the viscous shear stress model. For jet velocities abovev0the amount of entrained air starts to play a role in the final depth. The measured depth in this velocity range is larger than predicted by the viscous shear stress model.
The crater volume increases with jet velocity. For jet velocities belowv0air and water can leak out of the impact crater at the top and the increase of the crater volume with jet velocity is relatively slow. For jet velocities above v0 all fluid and entrained air is captured inside the crater and the crater volume increases strongly with jet velocity. From these crater volumes the amount of entrained air was calculated. The ratio Vai r/Vl iquid
increases with jet velocity and can be as high as 6 for a 20µm wide jet impacting with
70 m s−1on 5 mass percent gelatin.
With an additional layer of artificially grown human skin on top of the gelatin the im-pact dynamics change. A certain amount of time is needed for the jet to rupture the skin. This rupture time shows a very large spread but on average decreases with increasing jet velocity. No rupture of the skin was observed for jet velocities below 60 m s−1 with
50µm jet diameter. For precision volume injections high initial jet velocities are needed
Bibliography
[1] A. El Ghalbzouri, R. Siamari, R. Willemze, and M. Ponec. Leiden reconstructed hu-man epidermal model as a tool for the evaluation of the skin corrosion and irritation potential according to the{ECVAM} guidelines. Toxicology in Vitro, 22(5):1311 – 1320, 2008. Proceedings of the Scandinavian Society of Cell Toxicology 2007 Work-shop.
[2] Anja M Hauri, Gregory L Armstrong, and Yvan J F Hutin. The global burden of disease attributable to contaminated injections given in health care settings. Inter-national Journal of STD & AIDS, 15(1):7–16, 2004.
[3] Janine Jagger, Ella H. Hunt, Jessica Brand-Elnaggar, and Richard D. Pearson. Rates of needle-stick injury caused by various devices in a university hospital. New Eng-land Journal of Medicine, 319(5):284–288, 1988. PMID: 3393183.
[4] A. Kane, J. Lloyd, M. Zaffran, L. Simonsen, and M. Kane. Transmission of hepatitis b, hepatitis c and human immun- odeficiency viruses through unsafe injections in the developing world: model-based regional estimates. Bull. World Health, 1999.
[5] M. Kermode. Unsafe injections in low-income country healty settings: need for injection safety promotion to prevent the spread of blood-borne viruses. Health promotions international, 2004.
[6] Y. Nir and A. Paz. Fear of injection in young adults: Prevalence and associations.
American Journal of Tropical Medicine and Hygiene, 2003.
[7] Jeanne C. Stachowiak, Thomas H. Li, Anubhav Arora, Samir Mitragotri, and Daniel A. Fletcher. Dynamic control of needle-free jet injection. Journal of Con-trolled Release, 135(2):104 – 112, 2009.
[8] A. Taberner, N.C. Hogan, and I.W. Hunter. Needle-free jet injection using real-time controlled linear lorentz-force actuators. Medical Engineering & Physics, 2012.
[9] Y. Tagawa, N. Oudalov, A. El Ghalbzouri, C. Sun, and D. Lohse, editors. Needle-free injection into skin and soft matter with highely focused microjets, 2012.
[11] B.G. Weniger and M.J. Papania. Vaccines, page 1365. Elsevier Inc., 2008.
[12] B.G. Weniger and M.J. Papania. Vaccines, page 1370. Elsevier Inc., 2008.
Appendix A
Materials
A.1
Pump
Providing the basis of the setup is a high pressure pump (Shimadzu LC-20D), which can reach a pressure up to 40MPa or provide a maximum flowrate of 10mL/min. The pump provides one intake tube with filter, a stainless steel output tube that will be connected to a nozzle and two plastic output tubes for the drain. Because of the high pressures the pump requires a certain amount of time to attain the set pressure. These "waitings" would get longer for higher set pressures and a shutter was posted to keep the waterbeam from hitting the sample before the required pressure was reached.
A.2
Water
The fluid used is distilled water with a food dye (JO-LA Red). The food dye was added to add more visibility for the camera, and to inspect the impacts afterwards.
A.3
Timings
In order to manage the timings a pulse/delay generator (BNC model 575 pulse/delay generator) was used. It was connected to the shutter, the camera and the pump. It receives a signal from the pump when it starts pumping and the pulse/delay generator (PDG) sends a signal to the shutter and the camera after a certain amount of (adjustable) time to open the shutter and start filming respectively.
A.4
Nozzles and tubings
The nozzles used have an inner diameter of 20µm and 50µm. The small diameter
nozzles were constructed using a cutter (Shortix capillary columm cutter). With a small amount of glue (RS quickset epoxy adhesive 850-940 glue) the nozzle was glued into an outer tubing (outer diameter 360µm ), which had an outer diameter thick enough to be
A.5
Cameras
High-speed cameras (HPV-1, Shimadzu Corporation, Japan, and FAST-CAM SA-7, Pho-tron, USA) were used for the recordings of the highspeed impacts. From these recordings we could determine the penetration depth, volume injection and time required to pen-etrate the skin.
A.6
Lenses
In order for the cameras to get a good view of the microsopic events a long distance microscope (Navigator long distance microscope, 0.5 to 12x magnification) is used. It can both be mounted on the Shimadzu HPV-1 and the Photron FAST-CAM SA-7.
A.7
Gelatine preparation
Gelatin mixures were used to be able to study the injection pattern into a solid substrate. In order to simulate a human-body-like substrate, 5 mass percent of gelatin was dissolved in demineralized water. After heating the mixture for dissolving the gelatin the mixture was poured into petri dishes of either 50 mL or 250 mL which were prepared with a thin layer of vaseline which prevented the gelatine from sticking to the petri dishes. Finally the gelatin samples were placed in the refrigerator (4 °C) for 24 hours.
A.8
Penetration Across Human Skin In Vitro
The artificial skin was cultured by the Department of Dermatology of the Leiden Univer-sity Medical Center. The Leiden Human Epidermal (LHE) skin model used in this study has been fully characterized and shows very high similarities with native skin[1]. The LHE represents a full-thickness model (epidermis gener- ated onto a dermal matrix). The skin was supplied in patches of 2.4 cm in diameter and 700µm and was kept in an incub-ator prior to experiments. For the penetration experiments, the skin layers were placed on the top and the side of the gelatin mixtures on a coverslip, which could be placed in the setup.