ORIGINAL RESEARCH
BRAIN
Differential Diagnosis of Normal Pressure Hydrocephalus by
MRI Mean Diffusivity Histogram Analysis
M. Ivkovic, B. Liu, F. Ahmed, D. Moore, C. Huang, A. Raj, I. Kovanlikaya, L. Heier, and N. Relkin
ABSTRACT
BACKGROUND AND PURPOSE: Accurate diagnosis of normal pressure hydrocephalus is challenging because the clinical symptoms and radiographic appearance of NPH often overlap those of other conditions, including age-related neurodegenerative disorders such as Alzheimer and Parkinson diseases. We hypothesized that radiologic differences between NPH and AD/PD can be characterized by a robust and objective MR imaging DTI technique that does not require intersubject image registration or operator-defined regions of interest, thus avoiding many pitfalls common in DTI methods.
MATERIALS AND METHODS: We collected 3T DTI data from 15 patients with probable NPH and 25 controls with AD, PD, or dementia with Lewy bodies. We developed a parametric model for the shape of intracranial mean diffusivity histograms that separates brain and ventricular components from a third component composed mostly of partial volume voxels. To accurately fit the shape of the third component, we constructed a parametric function named the generalized Voss-Dyke function. We then examined the use of the fitting parameters for the differential diagnosis of NPH from AD, PD, and DLB.
RESULTS:Using parameters for the MD histogram shape, we distinguished clinically probable NPH from the 3 other disorders with 86% sensitivity and 96% specificity. The technique yielded 86% sensitivity and 88% specificity when differentiating NPH from AD only.
CONCLUSIONS: An adequate parametric model for the shape of intracranial MD histograms can distinguish NPH from AD, PD, or DLB with high sensitivity and specificity.
ABBREVIATIONS:AD⫽Alzheimer disease; DLB⫽dementia with Lewy bodies; NPH⫽normal pressure hydrocephalus; MD⫽mean diffusivity; PD⫽Parkinson disease
N
ormal pressure hydrocephalus is a reversible cause of de-mentia, incontinence, and gait disturbance in the elderly.1Accurate and timely diagnosis is essential to its successful treat-ment.2Diagnosis of NPH can be difficult because the clinical
symptoms associated with NPH are common in the elderly and can overlap those of age-related neurodegenerative disorders such as Alzheimer and Parkinson diseases.2Nonobstructive
enlarge-ment of the cerebral ventricles in NPH can be difficult to distin-guish from age- and disease-related ex-vacuo ventricular enlarge-ment by conventional CT and MR imaging techniques. Expert
clinical evaluations performed in specialized centers can achieve up to 90% accuracy in identifying shunt-responsive patients with NPH3; however, diagnosis of NPH in general practice is much less
successful. It has been estimated recently that only 10%–20% of patients with NPH get the appropriate specialized treatment.4
Recognition of NPH in general practice could be improved if more objective and quantitative imaging methods were available for differential diagnostic and prognostic purposes.5-9
Brain imaging is an integral part of NPH diagnosis. To meet the criteria for probable NPH by international consensus guide-lines, one must use brain imaging to document an Evans index (the ratio of the widest diameter of the anterior horn of the lateral ventricle to the transverse intracranial diameter) ofⱖ0.3.2
An-other imaging sign that has been validated recently as an adjunct to the diagnosis of NPH is disproportionate enlargement of the inferior subarachnoid spaces with tight high-convexity subarach-noid spaces.9A number of quantitative imaging biomarkers have
also been proposed as aids to NPH diagnosis, such as phase-con-trast aqueductal flow measurements,10aqueductal stroke volume
measurements,11 the ratios of ventricular volume to cortical Received June 22, 2012; accepted after revision August 8.
From Weill Cornell Medical College, New York, New York.
Please address correspondence to Norman Relkin, MD, Weill Cornell Medical Col-lege, 428 East 72nd St, Suite 500, New York, NY 10021; e-mail: nrelkin@med. cornell.edu
Indicates open access to non-subscribers at www.ajnr.org
Indicates article with supplemental on-line tables
Indicates article with supplemental on-line figure
thickness,7increased DTI fractional anisotropy of periventricular
white matter and the basal ganglia,12CSF and blood flow,13and
temporal changes in the apparent diffusion coefficient during the cardiac cycle.14The use of these techniques has largely been
con-fined to research studies in specialty centers, and none have been proved to improve the diagnosis of NPH in routine clinical practice.
Alterations in brain-water diffusivity in NPH were first re-ported nearly 20 years ago.15It has been recently reported that
region-of-interest-based DTI techniques can distinguish shunt-responsive NPH from other dementias with higher specificity than the Evans index (95% versus 80%).6Tract-based spatial
sta-tistics methods were reported to achieve sensitivity for NPH clas-sification of⬎90% with a specificity between 80% and 85%.16
However, these methods require operator-defined regions of in-terest, which are subjective and prone to inter-rater variability issues and/or require image registration to normative images. Identifying all registration errors is almost impossible,17and
reg-istration is especially problematic for conditions with large ana-tomic deformations such as NPH. Problems with registration of patients with NPH have already been reported.18
We hypothesized that radiologic differences between NPH and AD/PD can be captured by a robust and objective DTI tech-nique that does not require intersubject image registration or op-erator-defined regions of interest. To that end, we developed a parametric fitting model for the shape of a whole-brain mean diffusivity histogram applicable in the differential diagnosis of NPH. Histogram approaches are attractive, compared with other diffusion MR imaging analysis methods because of their robust-ness and reproducibility.19These approaches typically do not
de-pend on intersubject registration of images or tissue segmentation and smoothing. Consequently, they are not susceptible to many of the common pitfalls of DTI analysis.17NPH is well-suited for MD
histogram analysis because transependymal fluid shifts in NPH affect a large number of brain voxels in a way that is directly detectable by MD. Ulug et al20were the first to apply an MD
histogram approach to hydrocephalus and reported that MD of periventricular brain-water was increased in obstructive hydro-cephalus. Our method is a generalization of the modeling approach developed by Dyke et al21for analyzing MD histograms in late
infan-tile neuronal lipofuscinosis. The generalization captures distinctive features present in the MD histograms of patients with NPH.
MATERIALS AND METHODS
Subjects
This research protocol was approved by the Weill Cornell Insti-tutional Review Board and informed consent was obtained from all the subjects. The subjects were accrued consecutively, from the Weill Cornell Memory Disorders Program clinical service. The clinical diagnoses were established by 2 neurologists (N.R. and M.L. with 21 and 16 years of experience, respectively). Probable idiopathic NPH was diagnosed in accordance with the interna-tional consensus guidelines.2 AD,22 PD,23 and dementia with
Lewy bodies24were diagnosed in accordance with published
cri-teria. The subjects of this retrospective study included 15 patients with probable idiopathic NPH (7 women and 8 men; mean age, 77.0 years; age range, 63– 89 years), 9 patients with AD (5 women
and 4 men; mean age, 77.2 years; age range, 63– 85 years), and 16 patients with either PD or DLB (7 women and 9 men; mean age, 73.6 years; age range, 51– 86 years). Two additional subjects diag-nosed with a combination of NPH and AD were also included (women, ages 77 and 78 years). All patients with NPH had an Evans index ofⱖ0.3. All except 2 patients with AD also had an Evans index ofⱖ0.3. Five of 16 non-NPH non-AD patients had an Evans index of⬎0.3.
Subjects with secondary NPH, obstructive hydrocephalus, or shunts were not considered. Five patients with infarcts of⬎1 cm in major vascular territories were excluded. Lacunes and smaller infarcts were not exclusionary because this comorbidity is fre-quently present in patients with suspected NPH.
Image Acquisition and Preprocessing
DWI was acquired on a 3T Signa Excite scanner (GE Healthcare, Milwaukee, Wisconsin) by using 33-direction echo-planar diffu-sion-weighted scans atb⫽1000 s/mm2and 1 atb⫽0 s/mm2. TE
was 70 – 80 ms; TR, 8.2 seconds. The whole brain was covered with sixty 2.5-mm-thick sections with no gap between sections. The voxel size was 1.8⫻1.8⫻2.5 mm3.
Eddy current correction and motion correction were per-formed by linear registration of the gradient volumes to low gra-dient (B0) volume,25followed by corresponding adjustment of
the encoding vectors. The automatic skull stripping26was
fol-lowed by manual corrections when needed. DTI fitting and MD calculations were performed with the FMRIB Software Library (http://fsl.fmrib.ox.ac.uk/fsl).27MD values were placed in the 250
bins of normalized histograms with unit area.
The major feature of the DTI histograms is a peak below 1E-3 mm2/s, consisting primarily of voxels in the brain parenchyma.28
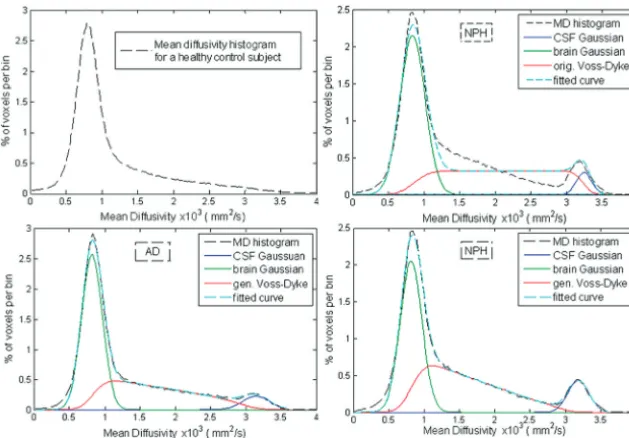
In subjects with enlarged ventricles, a distinctive second peak ap-pears in the MD region above 3E-3 mm2/s (Fig 1, upper right). We
observed that the region between 1E-3 mm2/s and 3E-3 mm2/s
frequently has a steeper slope in subjects with NPH compared with patients with NPH. This is a consequence of extracellular water accumulated within white matter of patients with NPH (Fig 2). For the overall MD distribution, see On-line Fig 1. The para-metric histogram fitting presented in this article is designed to quantify this difference in the histogram slope.
Analysis Methods
The parametric model for fitting of the histograms is a modification of the multicomponent model developed by Dyke et al21for
analyz-ing pediatric DTI data. The normalized histograms were fitted by a weighted sum of 3 functions representing the brain, CSF, and the brain-CSF partial volume voxels together with brain voxels with high MD:
P共MD兲⫽fbrainPbrain共MD兲⫹fCSFPCSF共MD兲⫹fmixPVD共MD兲,
where
Pbrain共MD兲⫽
冑
12brain
exp
冋
⫺12
冉
MD⫺brain
brain
冊
2册
,PCSF共MD兲⫽
冑
1 2CSFexp
冋
⫺12
冉
MD⫺CSF
CSF
冊
2册
,and, here introduced, the generalized Voss-Dyke function:
PVD共MD兲⫽
冕
0
1 1
冑
2共t兲exp冋
⫺12
冉
MD⫺共t兲
共t兲
冊
2册
dt, where共t兲⫽tbrain⫹共1⫺t兲CSFand共t兲⫽
冑
t2brain
2 ⫹共1⫺t兲2 CSF 2 .
Herefbrain,fCSFandfmix, correspond to histogram fractions of
brain parenchyma, CSF, and mixed voxels respectively;brainand
brain(CSF,CSF) are the mean and SD of the brain (CSF)
Gauss-ian. The parameterdid not exist in the original Voss-Dyke equa-tion17and is introduced here. This parameter encodes the slope of
the generalized Voss-Dyke function, as explained below. The integral on the unit interval in the definition of the gen-eralized Voss-Dyke function,PVD(MD), was approximated by a
Gaussian quadrature on 100 points. This integral can be thought of as a sum of 100 Gaussian distributions representing a homo-topy from the Gaussian functionPCSF(MD) to the Gaussian
func-tionPbrain(MD). Smaller values ofindicate a higher percentage
of voxels with MD values close to those of the brain. This parameter creates the pos-sibility of achieving unequal partial vol-ume voxel distributions. In the original Voss-Dyke function, all fractions of par-tial volume voxels are necessarily equally likely (Fig 3).
Note that patients with NPH have a disproportionally high number of voxels with elevated MD values (but lower than that of the free water in the CSF compart-ment).6,18,20Patients with AD and PD, on
the other hand, have an increased number of partial volume voxels (higherfmix) and
a more proportional distribution of those voxels (higher).This results in a steeper slope of the middle part of the histogram fit for patients with NPH compared with those with AD and PD (Fig 1) and makes it possible to distinguish patients with NPH from those with AD and PD.
The form of the function PVD(MD)
was chosen so that the functionP(MD) is differentiable with respect to, because it is with the respect to the other fitting pa-rameters, so the Jacobian is defined. The total number of optimization parameters was 8:fbrain, fCSF, fmix,brain,CSF,CSF
and. Histogram fitting was performed by in-house-developed software based on the Levenberg-Marquardt algorithm im-plemented in C.29 The
Levenberg-Mar-quardt algorithm was iterated until the difference in fitted curves between 2 con-secutive iterations was⬍0.1%, and it con-sidered fitting adequate (successful) if the absolute difference between a subject’s measured histogram and fitted curve was⬍5% of the total mea-sured data. We initially experimented with modeling the MD his-togram by a 9-parameter model consisting of 3 Gaussian func-tions (one component for brain parenchyma, a second for partial volume voxels, and a third for the CSF compartment),20,30but
this model failed to adequately model the partial volume compo-nent in most patients with NPH. The original Voss-Dyke model21
improves over the 3-Gaussian model but does not fully capture the shape of the partial volume voxels in adults with NPH (Fig 1, upper right). The effects of the generalization of the Voss-Dyke fitting method in a subject with NPH is shown in the bottom right of Fig 1.
Classifying Methods
Fitting parametersandfmixwere used to construct 2D linear
classifiers, one comparing NPH with AD only (group 1: NPH; group 2: AD) and another comparing NPH with all other condi-tions (group 1: NPH; group 2: AD, PD, DLB). Receiver operating characteristic analysis was performed with a publically available Matlab package (MathWorks, Natick, Massachusetts).31The re-FIG 1. The MD histograms of a healthy subject (top left), a patient with AD (bottom left), and a
patient with NPH (top and bottom right). MD histogram of the same patient with NPH was fitted with the original Voss-Dyke function (top right) and with the proposed generalized Voss-Dyke function (bottom right).
[image:3.594.55.370.47.266.2] [image:3.594.52.370.324.425.2]ported sensitivity and specificity values are those that maximize the Youden index.
For the sake of completeness, binary classifiers based on all 8 fitting parameters and average MD over the whole brain were also considered. In On-line Tables 1 and 2, we also report negative and positive predictive values, calculated on the basis of disease prev-alence in our patient population, which may not be representative of any other clinical population.
RESULTS
Generalized Voss-Dyke fitting was successful for all subjects (ie, the absolute difference between the subject’s measured histogram and fitted curve was⬍5% of the total measured histogram). The basic statistics on all of the fitting parameters and average MD (over the whole histograms) are shown in Table 1.
Classification Power
We compared 2 variants of binary classifiers: comparing patients with NPH with patients with AD only,1and comparing patients
with NPH with all other patient groups jointly (group 1: NPH;
group 2: AD, PD, DLB).2The 2 patients diagnosed both with NPH
and AD were excluded from the classification analysis.
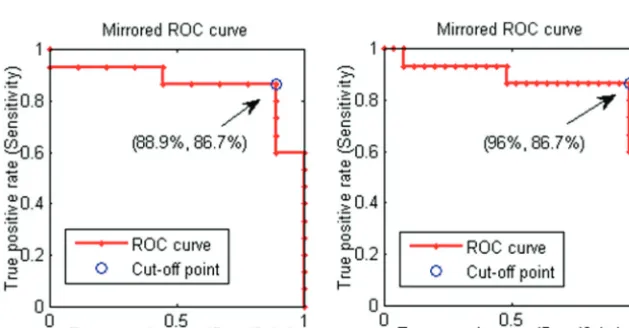
The classification power for the best one 1D and the best three 2D classifiers are shown in Tables 2 and 3. Overall, the best differ-entiation of NPH from the control groups, in both classifier vari-ants, was achieved with the combination of parametersfmixand
(Fig 4). Estimates on achievable specificity and sensitivity for the best classifier are given by receiver operating characteristic curves in Fig 5. Complete tables of all 1D classifiers are in On-line Tables 1 and 2. Similar tables for thirty-six 2D classifiers are omitted for brevity.
The 2 patients with both NPH and AD appear at the top right corner of Fig 4. These patients have a relatively flat distribution of MD values, coming from a combined effect of cerebral atrophy and high MD within the brain parenchyma.
Outliers
[image:4.594.58.530.57.185.2]The patient with NPH in the top left corner of the Fig 3, mis-classified by our method, is an 82-year-old man with a small
Table 2: Three 1D classifiers and three 2D classifiers with the highest Youden index, for the binary classification with group 1: NPH; and group 2: ADa
fCSF fbrain (fCSF,) (brain,) (fmix,)
Sensitivity 0.73 (11/15) 1.00 (15/15) 0.73 (11/15) 0.73 (11/15) 0.73 0.87 (13/15)
Specificity 0.56 (5/9) 0.33 (3/9) 0.78 (7/9) 0.89 (8/9) 0.92 0.89 (8/9)
Y-index 1.29 1.33 1.51 1.62 1.65 1.76
a
The numbers in parentheses represent the numerators and denominators for the given fractional values.
Table 3: Three 1D classifiers and three 2D classifiers with the highest Youden index, for the binary classification with group 1: NPH; group 2: AD, PD, DLBa
fCSF fbrain (fCSF,) (brain,) (fmix,)
Sensitivity 0.87 (13/15) 0.73 (11/15) 0.87 (13/15) 0.80 (12/15) 0.87 (13/15) 0.87 (13/15)
Specificity 0.52 (13/25) 0.80 (20/25) 0.68 (17/25) 0.84 (21/25) 0.88 (22/25) 0.96 (23/25)
Y-index 1.39 1.53 1.55 1.64 1.75 1.83
aThe numbers in parentheses represent numerators and denominators for the given fractional values.
FIG 3. The original Voss-Dyke function is in blue; the generalized function is in red. In the center is homotopy mapping(t)⫽tbrain⫹(1⫺
t)CSF. Right, for the original Voss-Dyke function, case⫽1. The intermediate Gaussian distributions are equally betweenPCSF(MD) and
[image:4.594.52.534.252.308.2]Pbrain(MD). Left, in the case⫽0.4, the intermediate distributions are skewed towardPbrain(MD), giving the slope to the generalized Voss-Dyke function. The inserts on the left and right represent the Voss-Dyke functions resulting as the sum of the corresponding Gaussians.
Table 1: Mean values for all fitting parameters and average MD
fbrain
brain
(×e-4 mm2/s) (×e-4 mmbrain2/s) f CSF
CSF
(×e-3mm2/s) (×e-4mmCSF2/s) f
mix
Average MD NPH 0.436⫾0.043 7.87⫾0.24 1.5⫾0.29 0.086⫾0.022 3.2⫾0.1 1.9⫾0.16 0.478⫾0.061 0.57⫾0.16 1.4⫾0.12 AD 0.435⫾0.071 7.88⫾0.25 1.5⫾0.21 0.080⫾0.023 3.2⫾0.3 1.5⫾0.29 0.484⫾0.068 0.71⫾0.14 1.5⫾0.14 PD, DLB 0.501⫾0.062 8.08⫾0.35 1.6⫾0.18 0.051⫾0.039 3.1⫾0.2 2.1⫾0.17 0.446⫾0.044 0.70⫾0.12 1.3⫾0.13
[image:4.594.60.532.339.385.2] [image:4.594.55.533.425.472.2]hemorrhagic infarct in the left thalamus and an atrophic left hippocampus. The other misclassified patient with NPH was a relatively young (63 years of age) female patient with extensive microvascular ischemic disease. The patient with AD within the NPH region in Fig 4 is the oldest one in the patients with AD cohort: an 85-year-old woman with comorbid cerebrovascular disease.
Other Fitting Parameters
The most conspicuous parameter of the MD histograms, location of the raw data histogram peak, was, on average, at the same po-sition for the patients with NPH (mean, 8.05E-4⫾2.5E-5 mm2/
s), AD (mean, 8.02E-4⫾3.0E-5 mm2/s), and PD⫹DLB (mean,
8.08E-4⫾3.5E-5 mm2/s) and did not yield specificity in
distin-guishing NPH.
ParameterfCSFwas elevated in NPH and AD compared with patients with PD⫹DLB (Table 1). This parameter alone yielded relatively good results in differentiating NPH from all the other conditions (sensitivity, 87%; specificity, 68%) but was not a
par-ticularly good indicator of NPH compared with AD (sensitivity, 73%; specificity, 56%). This is in line with results reported in Klassen and Ahlskog,5in which a more detailed analysis of
tricle size was performed, and it was argued that the ratio of ven-tricular volume to cortical thickness is required to distinguish ventricular enlargement in NPH from ex-vacuo expansion in AD.
ParameterCSFhad a mean value of 3.1E-3⫾1.6E-4 mm 2/s
over the entire subject population. This corresponds to the well-known MD value for unrestricted water.27We found no
relation-ship between the patient diagnoses andCSF(Table 1).
DISCUSSION
The pathophysiology of NPH includes alterations in the distri-bution of water between and within the brain parenchymal and CSF compartments. Increased transependymal movement of CSF from the ventricles into the interstitial spaces of the brain may account for the alterations of white matter MD previously reported,16,18,20,30as well as the changes in the MD histogram
observed in the present study. Other contributors may include increased intraparenchymal CSF production and decreased ce-rebral perfusion or physical distortion of brain tissue second-ary to ventriculomegaly. Further studies are needed to better understand the origins of altered intracerebral water diffusiv-ity in NPH.
MD Histogram Fitting
An often-cited downside of the MD histogram approaches is CSF “contamination,”17(ie, inadvertent inclusion into histograms of
partial volume voxels with variable amounts of parenchymal and CSF contributions). However, this is actually valuable informa-tion for NPH diagnostics because cerebral atrophy and the abnor-mal intermingling of free water and brain parenchyma occurs to a pathologic degree in NPH. This can be readily appreciated from a comparison of the MD histograms of a healthy control, a patient with NPH, and a patient with AD (Fig 1).
As explained in the “Materials and Methods” section, the orig-inal Voss-Dyke method operates under the assumption that all partial volume fractions are possible and equally likely. This ade-quately modeled MD data from children with late infantile neuronal lipofuscino-sis,21 in whom ventricle size is actually
larger (relative to the brain size) than that in the NPH population. Furthermore, in the case of patients with NPH, there are voxels fully within white matter with ele-vated MD values6,18,20but still closer to
the MD values for the rest of parenchyma than to the MD values of unrestricted wa-ter (Fig 2). This situation is betwa-ter mod-eled with the generalized form of the Voss-Dyke function.
Classification
The misclassified patients were at the ex-tremes of their patient group age range, suggesting that age should be considered
FIG 4. Fraction of the midrange MD voxels (fmix) versus. Lower
values ofmean a higher number of voxels, with MD values closer to parenchyma MD values and a lower number of the voxels with MD values closer to CSF. The classification line presented on the graph is
out⫽ ⫺0.4⫹2.1ⴱfmix.
FIG 5. The receiver operating characteristic curves for the patients with NPH classification against patients with AD only (left) and the joint AD, PD, and LBD group (right). The receiver operating characteristic points presented are for the cutoff lines of the formout⫽ ⫺0.4⫹
[image:5.594.55.284.47.221.2] [image:5.594.54.369.523.687.2]as a predictor variable. It has been argued recently, in several large studies,31,32that effects of aging on MD obey a quadratic law
(MD⬃␣⫹1ⴱage⫹2ⴱage
2), with MD decreasing from birth
to approximately 40 years of age and then increasing after 40 years of age. Although our data sample was too small for a rigorous age-and sex-matched analysis, we performed multivariate first order est⫽␣⫹1ⴱfmix⫹2ⴱageand second-orderest⫽␣⫹1ⴱ fmix⫹2ⴱage⫹3ⴱage
2regression analysis to test for possible
dependence ofon patient ages andfmixas independent
predic-tors. As expected, these models did not achieve the necessaryP
value (.05) to justify introduction of age and age2as predictor
variables. With linear regression, the coefficients for the NPH group wereMPH⫽ ⫺0.25⫹1.37ⴱfVD⫹0.002ⴱage, and for AD
AD⫽ ⫺0.68⫹1.91ⴱfmix⫹0.006ⴱage, indicating potentially
stronger dependence on age in patients with AD.
One limitation of this study is that it did not include age-matched healthy subjects or patients with certain other disorders that could affect MD (stroke, uncontrolled hypertension, chronic kidney disease, and so forth). Studying a larger set of healthy and disease controls will allow developing a regression model for the effects of aging. A prospective validation study is needed to rigor-ously determine the positive and negative predictive values of this method. The effects of different magnetic field strengths and other acquisition parameters remain to be studied but are unlikely to alter the fundamental findings.
It is quite likely that method accuracy can be further improved with a more sophisticated classification model that would include other proposed NPH biomarkers obtainable from diffusion MR imaging and T1 MR imaging data.6-12,14-16,18,32-36 However,
higher model sophistication also leads to higher probability of undetected processing errors. Note that the proposed method is fully programmable and does not require user intervention. Most of the previously proposed quantitative NPH imaging biomarkers are operator-dependent and/or have less classification power than is obtained with the generalized Voss-Dyke function.
CONCLUSIONS
We developed a novel parametric model for the DTI MD histo-gram fitting, named the generalized Voss-Dyke function, which is highly successful in segregating patients with NPH from potential confounders without reliance on operator-dependent region-of-interest analyses or intersubject registration. While additional prospective validation is needed and some of the important con-founders such as advanced vascular disease have to be considered separately, the presented results provide considerable cause for optimism that this technique can be used to summarize diffusivity changes in NPH and help distinguish NPH from neurodegenera-tive disorders and other potential diagnostic confounders.
Disclosures: Milos Ivkovic—RELATED:Grant: National Institutes of Health, National Institute of Neurological Disorders and Stroke,Comments: F32 fellowship. Fayeza Ahmed—RELATED:Grant: Leon Levy Foundation.* Dana Moore—RELATED:Grant: Hydrocephalus Association Young Mentored Investigator Award,*Comments: I am the primary investigator on this grant. Norman Relkin—RELATED: The Leon Levy Foundation,*Comments: I was principal investigator on a grant from the Leon Levy Foundation for development of new biologic and imaging-based markers of normal pressure hydrocephalus. The work described in this article was supported by that grant,UNRELATED:Consultancy: I am advisor to Eisai Research and Kyowa Kirin Pharma,Comments: My consultancies are unrelated to this manuscript;Grants/ Grants Pending: Baxter,* National Institute on Aging,*Payment for Lectures
(includ-ing service on Speakers Bureaus): American Austria Foundation, European College of Neuropsychopharmacology.Comments: I have received payment for invited lec-tures unrelated to the present manuscript. *Money paid to the institution.
REFERENCES
1. Adams R, Fisher CM, Hakim S, et al.Symptomatic occult hydro-cephalus with normal cerebrospinal-fluid pressure: a treatable syn-drome.N Eng J Med1965;273:117–26
2. Relkin N, Marmarou A, Klinge P, et al.INPH guidelines. Part II. Diagnosing idiopathic normal-pressure hydrocephalus. Neurosur-gery2005;57:S4 –16
3. Marmarou A, Bergsneider M, Klinge P, et al.The value of supple-mental prognostic tests for the preoperative assessment of idio-pathic normal-pressure hydrocephalus. Neurosurgery 2005;57(3 suppl):S17–28
4. Kiefer M, Unterberg A.The differential diagnosis and treatment of normal-pressure hydrocephalus.Dtsch Arztebl Int2012;109:15–25, quiz 26
5. Klassen BT, Ahlskog JE.Normal pressure hydrocephalus: how often does the diagnosis hold water?Neurology2011;77:1119 –25 6. Kim MJ, Seo SW, Lee KM, et al.Differential diagnosis of idiopathic
normal pressure hydrocephalus from other dementias using diffu-sion tensor imaging.AJNR Am J Neuroradiol2011;32:1496 –503 7. Moore DW, Kovanlikaya I, Heier L, et al.A pilot study of
quantita-tive MRI measurements of ventricular volume and cortical atrophy for the differential diagnosis of normal pressure hydrocephalus. Neurol Res Int2012;2012:718150
8. Kitagaki H, Mori E, Ishii K, et al.CSF spaces in idiopathic normal pressure hydrocephalus: morphology and volumetry.AJNR Am J Neuroradiol1998;19:1277– 84
9. Hashimoto M, Ishikawa M, Mori E, et al.Diagnosis of idiopathic normal pressure hydrocephalus is supported by MRI-based scheme: a prospective cohort study. Cerebrospinal Fluid Res
2010;7:18
10. Bradley WG. Scalzo D, Queralt J, et al. Normal-pressure hydrocephalus: evaluation with cerebrospinal fluid flow measure-ments at MR imaging.Radiology1996;198:523–29
11. Scollatto A, Tenenbaum R, Bahl G, et al.Changes in aqueductal CSF stroke volume and progression of symptoms in patients with uns-hunted idiopathic normal pressure hydrocephalus.AJNR Am J Neuroradiol2008;29:192–97
12. Hattingen E, Jurcoane A, Melber J, et.al.Diffusion tensor imaging in patients with adult chronic idiopathic hydrocephalus.Neurosurgery
2010;66:917–24
13. El Sankari S, Gondry-Jouet C, Fichten A, et al.Cerebrospinal fluid and blood flow in mild cognitive impairment and Alzheimer’s disease: a differential diagnosis from idiopathic normal pressure hydrocephalus.Fluids Barriers CNS2011;8:12
14. Ohno N, Miyati T, Mase M, et al. Idiopathic normal-pressure hydrocephalus: temporal changes in ADC during cardiac cycle. Ra-diology2011;261:560 – 65
15. Gideon P, Stahlberg F, Thomsen C, et. al.Cerebrospinal fluid flow and production in patients with normal pressure hydrocephalus studied by MRI.Neuroradiology1994;36:210 –15
16. Hattori T, Yuasa T, Aoki S, et al.Altered microstructure in cortico-spinal tract in idiopathic normal pressure hydrocephalus: compar-ison with Alzheimer disease and Parkinson disease with dementia. AJNR Am J Neuroradiol2011;32:1681– 87
17. Jones DK, Cercignani M.Twenty-five pitfalls in the analysis of dif-fusion MRI data.NMR Biomed2010;23:803–20
18. Hattori T, Ito K, Aoki S, et al.White matter alteration in idiopathic normal pressure hydrocephalus: tract-based spatial statistics study.AJNR Am J Neuroradiol2012;33:97–103
19. Steens SC, Admiraal-Behloul F, Schaap JA, et al.Reproducibility of brain ADC histograms.Eur Radiol2004;14:425–30
20. Ulug AM, Relkin N, Zimmerman RD.Diagnosis of normal pressure hydrocephalus using diffusion imaging.In:Proceedings of the 30th
Annual Meeting of the American Aging Association, Madison, Wiscon-sin. June 1– 4, 2001
21. Dyke JP, Voss HU, Sondhi D, et al.Assessing disease severity in late infantile neuronal ceroid lipofuscinosis using quantitative MR dif-fusion-weighted imaging.AJNR Am J Neuroradiol2007;28:1232–36 22. McKhann G, Drachman D, Folstein M, et al.Clinical diagnosis of Alzheimer’s disease: report of the NINCDS-ADRDA-Work Group under the auspices of Department of Health and Human Services, Task Force on Alzheimer’s disease.Neurology1984;34:939 – 44 23. Gelb DJ, Oliver E, Gilman S.Diagnostic criteria for Parkinson
dis-ease.Arch Neurol1999;56:33–39
24. McKeith IG, Dickson DW, Lowe J, et al.Diagnosis and management of dementia with Lewy bodies: third report of the DLB Consortium. Neurology2005;65:1863–72
25. Jenkinson M, Smith S.A global optimisation method for robust affine registration of brain images. Medical Image Anal2001;5: 143–56
26. Smith SM.Fast robust automated brain extraction.Human Brain Mapp2002;17:143–55
27. Smith SM, Jenkinson M, Woolrich MW, et al.Advances in functional and structural MR image analysis and implementation as FSL. Neu-roimage2004;23:S208 –19
28. Pierpaoli C, Jezzard P, Basser PJ, et al.Diffusion tensor MR imaging of the human brain.Radiology1996;201:637– 48
29. Galassi M, Davies J, Theiler J, et al.GNU Scientific Library Reference
Manual. 3rd ed. Bristol, United Kingdom: Network Theory Limited; 2009
30. Chun T, Filippi CG, Zimmerman RD, et al.Diffusion changes in the aging human brain.AJNR Am J Neuroradiol2000;21:1078 – 83 31. Cardillo G. ROC curve. Compute a ROC curve. http://www.math
works.com/matlabcentral/fileexchange/19950. Accessed June 20, 2012
32. Westlye LT, Walhovd KB, Dale AM.Life-span changes of the human brain white matter: diffusion tensor imaging (DTI) and volumetry. Cereb Cortex2010;20:2055– 68
33. Ishii K, Kawaguchi T, Shimada K, et al.Voxel-based analysis of gray matter and CSF space in idiopathic normal pressure hydrocepha-lus.Dement Geriatr Cogn Disord2008;25:329 –35
34. Hsu JL, Van Hecke W, Bai CH, et al.Microstructural white matter changes in normal aging: a diffusion tensor imaging study with higher-order polynomial regression models.Neuroimage2010;49: 32– 43
35. George AE, Holodny A, Golomb J, et al.The differential diagnosis of Alzheimer’s disease: cerebral atrophy versus normal pressure hy-drocephalus.Neuroimaging Clin N Am1995;19 –31