The Calibration and Evaluation of Speed-Dependent
Automatic Zooming Interfaces
A thesis
submitted in partial fulfilment
of the requirements for the Degree
of
Master of Science in Computer Science
in the
University of Canterbury
by
Josh Savage
University of Canterbury
Examining Committee
Supervisor Associate Professor Andy Cockburn
Abstract
Speed-Dependent Automatic Zooming (SDAZ) is an exciting new navigation
tech-nique that couples the user’s rate of motion through an information space with the
zoom level. The faster a user scrolls in the document, the ‘higher’ they fly above the work surface.
At present, there are few guidelines for the calibration of SDAZ. Previous
work by Igarashi & Hinckley (2000) and Cockburn & Savage (2003) fails to give
values for predefined constants governing their automatic zooming behaviour. The
absence of formal guidelines means that SDAZ implementers are forced to adjust
the properties of the automatic zooming by trial and error.
This thesis aids calibration by identifying the low-level components of SDAZ.
Base calibration settings for these components are then established using a formal
evaluation recording participants’ comfortable scrolling rates at different
magni-fication levels.
To ease our experiments with SDAZ calibration, we implemented a new
sys-tem that provides a comprehensive graphical user interface for customising SDAZ
behaviour. The system was designed to simplify future extensions — for example
new components such as interaction techniques and methods to render
informa-tion can easily be added with little modificainforma-tion to existing code. This system
was used to configure three SDAZ interfaces: a text document browser, a flat map
browser and a multi-scale globe browser.
The three calibrated SDAZ interfaces were evaluated against three equivalent interfaces with rate-based scrolling and manual zooming. The evaluation showed
that SDAZ is 10% faster for acquiring targets in a map than rate-based scrolling
with manual zooming, and SDAZ is 4% faster for acquiring targets in a text
docu-ment. Participants also preferred using automatic zooming over manual zooming.
No difference was found for the globe browser for acquisition time or preference.
However, in all interfaces participants commented that automatic zooming was
Table of Contents
List of Figures v
List of Tables ix
Chapter 1: Introduction 1
Chapter 2: Related Work 9
2.1 Control-Display Gain . . . 9
2.2 Scrolling Techniques . . . 10
2.2.1 Alternative Scroll-bars . . . 10
2.2.2 Rate-based Scrolling . . . 12
2.3 Zooming Interfaces . . . 14
2.4 Speed-Dependent Automatic Zooming . . . 14
2.4.1 Igarashi & Hinckley’s Work . . . 14
2.4.2 Cockburn & Savage’s Work . . . 19
2.4.3 Application of SDAZ on Small Screen Devices . . . 22
2.5 3D Systems . . . 23
2.5.1 Animation . . . 24
2.6 Navigation Analysis . . . 25
2.6.1 Fitts’ Law . . . 25
2.6.2 Space-Time Diagrams and U,W Space Diagrams . . . 26
2.7 Additional Focus Plus Context Techniques . . . 26
2.8 Human Processing of Visual Flow . . . 29
2.8.1 Rapid Serial Visual Presentation . . . 30
Chapter 3: Fundamentals of SDAZ Behaviour 33 3.1 Low Level Behaviour of SDAZ . . . 33
3.1.1 Mapping Constraints . . . 34
3.2 Additional Features Enhancing Usability . . . 36
3.2.2 Zoom Focus . . . 38
3.2.3 Heads-Up-Display . . . 41
3.3 Summary . . . 42
Chapter 4: Visual Flow Theory and Evaluation 47 4.1 Motivation . . . 47
4.2 Approach . . . 47
4.3 Theoretical Analysis of Maximum Visual Flow Rates . . . 48
4.4 Evaluation . . . 52
4.4.1 Goal . . . 52
4.4.2 Apparatus . . . 53
4.4.3 Method and Procedure . . . 56
4.4.4 Experimental Design . . . 58
4.5 Results . . . 60
4.5.1 Document Interface . . . 60
4.5.2 Map Interface . . . 61
4.5.3 Globe Interface . . . 62
4.6 Discussion . . . 62
4.6.1 Theorised vs Recorded Results . . . 64
4.7 Additional Analyses . . . 65
4.7.1 Effects of Gaming Experience . . . 65
4.7.2 Effects of Gender . . . 66
4.7.3 Effects of Direction . . . 67
4.8 Automatic Zooming Recommendations . . . 68
Chapter 5: System Implementation 71 5.1 SDAZ Behavioural Model . . . 71
5.2 System Design and Implementation . . . 72
5.3 Implemented Interfaces . . . 76
Chapter 6: Performance Evaluation 79 6.1 Interfaces . . . 80
6.1.1 Scrolling Techniques . . . 82
6.2 Apparatus . . . 85
6.4 Experimental Design . . . 87
6.5 Results . . . 89
6.5.1 SDAZ vs Rate-based and Manual Zooming Performance . 89 6.5.2 Fitts’ Law Analysis . . . 92
6.5.3 Subjective Workload Measures — NASA-TLX . . . 92
6.5.4 Additional Analyses . . . 93
6.6 Discussion . . . 96
6.6.1 Performance Summary . . . 96
6.6.2 Experimental Concerns . . . 97
Chapter 7: Future Work and Conclusions 99 7.1 Future Work . . . 99
7.1.1 Ecological Validity . . . 99
7.1.2 Final Acquisition . . . 99
7.1.3 Manual Zooming . . . 99
7.1.4 Rate-based Scrolling Mapping for SDAZ . . . 100
7.1.5 SDAZ Rezoom Position . . . 100
7.1.6 3D Globe Browser . . . 101
7.2 Conclusions . . . 101
List of Figures
1.1 Screen-shots from Cockburn & Savage’s Map Browser . . . 3
1.2 The range of zoom-levels in Cockburn et al.’s globe browser. Screen-shots taken as the user effortlessly navigates from a detailed street map of Auckland to the globe overview. . . 5
1.3 Patel et al.’s gesture zoom interface. . . 6
2.1 Alternative Scroll Bars. . . 11
2.2 The Bookmark Scroll Bar. . . 12
2.3 Isometric Joysticks used for rate-based scrolling. Figures taken from Zhai et al.’s paper on improving browsing performance. . . . 13
2.4 Igarashi & Hinckley’s Prototype Web Browser. . . 16
2.5 Igarashi & Hinckley’s Prototype Map Browser. . . 17
2.6 Igarashi & Hinckley’s Prototype Image Viewer. . . 18
2.7 Igarashi & Hinckley’s Prototype Dictionary Viewer. . . 19
2.8 Screen Shots from Cockburn & Savage’s Text Document Browser. 21 2.9 Alley et al.’s proposed control feedback design for the SDAZ map browser. . . 23
2.10 Speed-coupled flying with orbiting. . . 24
2.11 Examples of diagrams used to represent movement in multiscale environments. . . 27
2.12 Common focus plus context techniques. . . 28
2.13 Spence RSVP modes. . . 32
3.1 SDAZ’s core mappings. These graphs are designed for demon-stration only. Recommended relationships are provided in Section 5.3. The current magnification is found from the current scroll speed which is mapped from the cursor’s displacement. . . 35
3.3 Demonstrates zoom-to-centre SDAZ. . . 39
3.4 Demonstrates zoom-to-cursor SDAZ. . . 40
3.5 w,u space diagrams displaying zoom-in trajectories. The cursor
position represents the position the cursor was over when the mouse
button was released. . . 44
3.6 Cockburn and Savage’s Document Viewer. . . 45
3.7 Rate-based scrolling in Microsoft Internet Explorer. . . 45
4.1 Diagram illustrating the theoretical calculation of the maximum
smooth-pursuit velocities in our evaluation setup. . . 49
4.2 Theoretical document scroll rates for processing and recognising
an image or three words of text at different magnifications with an
application size of 27 cm. Also, displays the predicted maximum smooth pursuit rates at different magnifications. . . 52
4.3 Visual flow evaluation systems. . . 54
4.4 Diagram displaying how text was measured in our evaluations. . . 55
4.5 Typical scrolling rates observed during evaluation tasks. The dashed
straight line overlaid on the observed scrolling speed represents
the approximated comfortable scrolling rate for that task. . . 57
4.6 Mean comfortable scrolling rates (pages/cm) in the document viewer
interface. The line of best fit is represented by a dotted line (scrollingRate= 0.7×Mag+4.4,R2=0.864). Note: 1 page = 27 cm. . . 61 4.7 Mean comfortable scrolling rates (cm/sec) in the map viewer
in-terface. The line of best fit is represented by a dotted line (y=
0.1x+13.6,R2=0.019). . . 62 4.8 Mean comfortable scrolling rates (degrees) in the globe viewer
in-terface. The line of best fit is represented by a dotted line (scrollRate=
−5.3×Mag+35.3,R2=0.613). . . 63 4.9 Recorded comfortable scroll rates compared against theorised in
the document and map interfaces. . . 65
4.10 Mean comfortable scrolling rates by direction for the three
inter-faces. . . 67
5.1 A screen shot of the GUI allowing easy calibration of SDAZ
5.2 UML class diagram of system design. . . 78
6.1 Interfaces used in the evaluation. Target direction is indicated by
the short arrow stretching from the centre of the screen. Current
cursor displacement is indicated by the long arrow also stretching
from the centre of the screen. . . 81
6.2 Relationship between displacement and speed for each interface. . 83
6.3 Mean target acquisition times against distance for SDAZ and
rate-based scrolling with manual zooming in the evaluated interfaces. . 91
List of Tables
4.1 Font measures for smallest and target fonts, in each of the
inter-faces, at maximum and minimum magnifications. . . 55
4.2 Summarised participant demographics taken before evaluation.
Turn-based games were classified as games that require little
hand-eye coordination and have low visual flow rates, such as, card
games and computer board games. Real-time games were
classi-fied as games demanding a high level of coordination and
involv-ing fast visual flow rates, such as, first person shooters, strategy games, and car racing games. . . 59
4.3 Comfortable scrolling rates by gaming experience. A significant
difference between means is indicated with a ‘**’. . . 66
4.4 Comfortable scrolling rates by gender for participant’s with little
to no gaming experience. A significant difference between means is indicated with a ‘**’. . . 66
4.5 Summarises comfortable viewing rates and our recommended rates
for automatic zooming. Linear interpolation was used to map magnification between defined scroll speeds. Recommendations
based on a linear mapping between cursor displacement and
doc-ument scroll speed. . . 69
5.1 SDAZ model constraints used in the implemented interfaces.
Val-ues are measured in magnification per second. . . 77
6.1 Rate-based scrolling configuration. In the document interface 27
cm = 1 page. Scroll speeds are expressed in terms of the document
6.2 Recommended and evaluated automatic zooming configuration.
In the document interface 27 cm = 1 page. Scroll speeds are ex-pressed in terms of the document on the screen at 100%
magnifi-cation. . . 84
6.3 Evaluation automatic zooming constraints. Values are measured
in magnifications per second. . . 85
6.4 Summarised participant demographics taken before evaluation. . . 87
6.5 Order of exposure to scrolling techniques and interfaces. . . 88
6.6 Summarised evaluation results for SDAZ and manual zooming in
the text, map and globe interfaces. . . 90 6.7 Equations for lines of best fit and index of performance ratings.
Index of Performance (IoP) is measured in bits per second. . . 93
6.8 NASA-TLX subjective evaluation results. The Wilcoxon’s
statis-tical match-pairs test was used to test for significance. . . 94
6.9 Results from the analysis of gaming experience. Mean and
stan-dard deviation is measured in seconds. . . 94
6.10 Results from the analysis of gender. Mean and standard deviation
Chapter I
Introduction
Today’s computer users must frequently navigate in information spaces that are
too large for the viewing window. Scrolling, panning and zooming are the typical
techniques used to overcome the screen ‘real-estate’ problem in documents such
as text files, maps, spreadsheets and pictures. Document scrolling is commonly provided using vertical and horizontal scrollbars that are manipulated by moving a
scroll handle. This handle controls and indicates the placement of the viewport in
the document. Another common mechanism is panning, which allows the user to
drag the space within the viewport. This directly manipulates the location in any
direction. Zooming increases and decreases the size of the information inside the
viewport and can be used to gain context in a document or to focus in on important
parts.
There are numerous limitations to scrolling, panning and zooming. One
limi-tation identified by Igarashi & Hinckley (2000) is the additional overhead involved
with the user’s attention being drawn back and forth between the scroll-bars and the document. To scroll the user must first acquire the scroll handle, which is
sometimes very small and difficult to target, by moving the mouse cursor to the
handle and clicking the mouse button. The user must then concentrate on the
ef-fect the operation has on the document. Scroll handle manipulation becomes more
difficult in larger documents because a small movement can cause a large jump in
the information space, which can cause disorientation and confusion.
Manipulat-ing the zoom level adds another level of difficulty to navigation. Typically, users
need to move slowly when zoomed in to avoid disorientation and more quickly
when zoomed out to avoid frustration.
The fundamental problem with panning is that constant mouse movement is required to scroll. One solution is a rate-based scrolling interface (Zhai et al.
1993). Rate-based scrolling maps the displacement of the cursor to the scrolling
hold-ing the middle mouse button (or scroll wheel) and movhold-ing in the desired scrollhold-ing
direction. The displacement between the initial clicked point and the current mouse pointer determines the speed of movement in the document. Another type
of input device commonly used in rate-based scrolling is an isometric joystick
which map the force exerted to velocity in the document. The IBM ScrollPoint
IITM is a mouse with a small joystick in place of the scroll wheel that is used for
rate-based scrolling. Rate-based scrolling, however, has a few drawbacks from
scroll bars: users can not quickly leap to a different position in the document and
users are limited by a maximum scrolling speed. Configuring the maximum scroll
rate is difficult in rate-based scrolling. If it is set too fast the user will become dis-orientated by the extreme visual flow, but if it is set too slow the user will become
frustrated at the time it takes to scroll to a distant known location. Frustration will
occur when a user knows the location (s)he wants to go to but is forced to wait as
the document slowly scrolls there.
The lack of smoothness between magnification levels is a major problem with
many zoomable interfaces. ‘Jumpy’ transitions can cause users to lose context
when zooming in and out of a document. Smooth transitions are often not
imple-mented to improve the performance of the browser. However, performance has
now become less of an issue with the current powerful CPUs and video cards, and
the focus has turned more to usability.
Speed-Dependent Automatic Zooming (SDAZ) was first proposed in an
at-tempt to solve the common problems of scrolling, panning and zooming (Igarashi & Hinckley 2000). SDAZ couples automatic zooming with rate-based scrolling.
The system attempts to keep the information flow across the screen constant by
automatically zooming out from the document as scroll speed increases. When
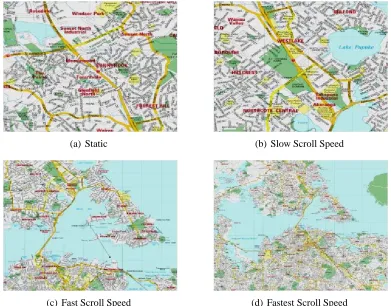
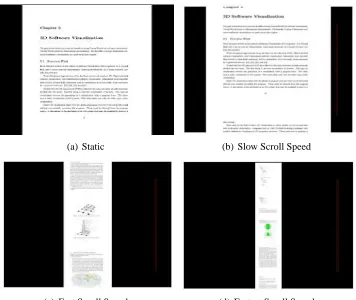
stationary or scrolling slowly the document is zoomed in (see Figure 1.1(a)), and
as the user scrolls more quickly the document is smoothly zoomed out to give an
overview (see Figure 1.1(d)).
An informal preliminary study (n=7) of the technique by Igarashi &
Hinck-ley found that in web and map browsing tasks, the efficiency with SDAZ was,
on average, the same or slightly worse than traditional scrolling methods. Sub-jective preferences were also divided. However, recent studies (n=12) of SDAZ
in similar document and map browsers preformed by Cockburn & Savage (2003)
(a) Static (b) Slow Scroll Speed
[image:21.595.112.503.124.430.2](c) Fast Scroll Speed (d) Fastest Scroll Speed
Figure 1.1: Screen-shots from Cockburn & Savage’s Map Browser
document browsing tasks and 43% faster for map browsing tasks. All participants
except one preferred the SDAZ interfaces. As smoothness is essential for SDAZ
implementations Cockburn & Savage suggest that the contrast in results was
pri-marily due to their smooth openGL implementations compared to Igarashi and
Hinckley’s ‘jumpier’ Java implementations. Other factors that may have lead to the difference in results are discussed in Section 2.4.2.
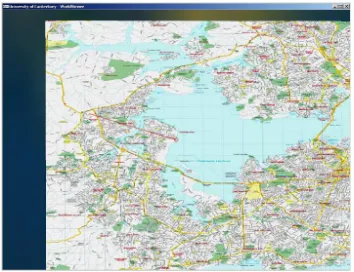
Cockburn et al. (2003) recently implemented a 3D ‘globe browser’ prototype
using SDAZ navigation. The globe browser allows smooth and rapid navigation
between detailed close-ups of city maps and a global overview of the Earth. In the globe browser, images of the Earth’s surface are stitched together to form a
globe, onto which map details of several cities/regions are overlaid (see Figure
region under the cursor moves towards the centre of the display. Displacing the
cursor further from the mouse’s initial clicked position increases the rate of ro-tation, and consequently increases the zoom level. When the user stops over a
region with no underlying detailed map, the zoom level will not fall below the
global overview’s minimum altitude (see Figure 1.2(c)). However, if the user
stops or moves slowly over a city map, then the zoom level will increase to a
street-name level of detail (see Figure 1.2(a)). When moving over a detailed map
or in the global overview, typical SDAZ behaviour is present — faster movement
results in high zoom levels (see Figure 1.2(b)). When the user moves off the edge
of the map, they rapidly ‘fly’ up to the world view (see Figure 1.2(c)). Full-speed motion over the globe zooms out to a level where a full global hemisphere is
vis-ible (see Figure 1.2(d)). The efficiency or usability of the globe browser has not
been evaluated.
The need for efficient navigation is also vital for small screen displays, such as
PDAs and cellphones, because of their inadequate amount of screen space. Jones
et al. (2004) implemented two SDAZ interfaces for small screen displays: a
doc-ument browser and a map browser. These interfaces were evaluated against
inter-faces using standard navigation techniques (scroll-bars, pan and manual zoom).
They found that SDAZ was, on average, 29% slower for browsing text
docu-ments on small screen displays. No significant difference was found for mean
task completion times when map browsing. Participants using SDAZ, however,
were more accurate and performed significantly fewer actions when completing
the tasks. Patel et al. (2004) also conducted research into the efficiency of SDAZ on small screen displays. The focus of their research was the effective browsing
of photograph collections. They evaluated SDAZ against discrete zoom and
ges-ture zoom interfaces. In the discrete zoom interface thumbnails of photographs
are presented ordered by creation time. Users can click/tap the desired photo to
view an enlarged version, and click/tap again to return to the thumbnail view. This
interface is similar to commercial browsers Apple iPhoto (Apple iPhoto 2002) and
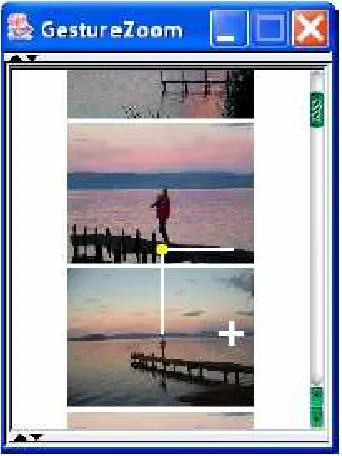
ACDSee Picture Viewer (ACDSee 2001). In the gesture interface, scroll speed is
proportional to vertical mouse displacement (as in rate-based scrolling interfaces) and zooming is proportional to horizontal mouse displacement (see Figure 1.3). A
larger horizontal displacement results in a higher zoom level. They found that the
(a) Slow scrolling in city view. (b) Fast scrolling in the city view.
[image:23.595.325.502.124.260.2](c) Slow scrolling in the globe view. (d) Fast scrolling in the globe view.
Figure 1.2: The range of zoom-levels in Cockburn et al.’s globe browser. Screen-shots taken as the user effortlessly navigates from a detailed street map of Auck-land to the globe overview.
have lower subjective task load levels than the standard discrete zoom interface.
Further work with SDAZ on small screens is discussed in Section 2.4.3.
Visual flow is the quantity of information moving across the screen at any
point in time. The investigation into visual flow rates is a fundamental part of
building SDAZ interfaces because its efficiency relies on automatically zooming out to reduce visual flow to allow faster scroll speeds. There are, however, many
questions that are unanswered regarding visual flow in SDAZ, such as “at what
scroll speed/visual flow rate should the system begin zooming?” and “what is the
relationship between zoom level and scroll speed?”
(a) Moderate scroll speed and small image reduction.
[image:24.595.100.271.127.355.2](b) Maximum speed and minimum size..
Figure 1.3: Patel et al.’s gesture zoom interface.
of SDAZ interfaces. Previous work by Igarashi & Hinckley (2000) and
Cock-burn & Savage (2003) fails to give values for their predefined constants governing
their automatic zooming behaviour. The absence of formal guidelines means that SDAZ implementers are forced to adjust the properties of the automatic zooming
by trial and error.
This thesis focuses on two areas: SDAZ calibration and its performance against
rate-based scrolling and manual zooming interfaces. The issues involved with the
calibration of SDAZ interfaces are discussed in Chapter 3. This is followed by
a psychological evaluation of maximum visual flow rates for the calibration of
SDAZ automatic zooming (see Chapter 4). Using the results from this evaluation
and our discussion of calibration, we designed and implemented new SDAZ
in-terfaces allowing straightforward calibration and testing (see Chapter 5). These interfaces are then evaluated to compare efficiency and user preference with
tra-ditional rate-based scrolling and manual zooming interfaces (see Chapter 6). This
Law (Fitts 1954) bandwidth measurements. This will assist in the comparison
Chapter II
Related Work
This chapter presents past work relating to SDAZ. Since the mouse is the primary
interaction device used in our SDAZ systems, we first discuss the low-level details
of its operation (see Section 2.1). We then discuss previous attempts to improve
scrolling techniques, focusing on alternative scroll-bars and the development of
rate-based scrolling (see Section 2.2). Zooming interfaces are then presented in
Section 2.3. This leads to the development of SDAZ in Section 2.4. In this section,
Igarashi & Hinckley’s work is first presented followed by Cockburn & Savage’s
study and then work applying SDAZ to small-screen displays. Several 3D flying
systems and an animation technique are presented in Section 2.5. This is followed
by the discussion of several techniques proposed to aid in navigation analysis (see Section 2.6). Additional focus plus context techniques are discussed in Section
2.7. Finally, previous work on the processing of visual flow is presented in Section
2.8. This work aids in the theoretical calculations in our visual flow evaluation (see
Chapter 4).
2.1 Control-Display Gain
As the mouse is the primary interaction device used in our SDAZ systems, it is
necessary to summarise the low-level details of the mouse operation and related
work.
The control-display gain determines the mapping between the physical
dis-placement of the pointing device (usually the mouse) and corresponding
move-ment of the cursor on the screen (MacKenzie & Riddersma 1994). The mapping is
typically controlled by one or two user-configurable parameters. These values are generally termed ‘acceleration’ and ‘threshold’. When the mouse moves slowly,
a base mapping between physical mouse motion and cursor movement is applied.
the cursor moves four centimetres for each centimetre of physical mouse motion.
The cursor is accelerated, when the mouse is moved further than a threshold value within the mouse’s sample rate, by multiplying the base movement by the
accel-eration value. Typically, the sample rate is 40Hz to 60Hz, however, some mice
designed for games have higher sample rates (100Hz).
Control-display gain adaptation has previously been used to increase target
acquisition performance. ‘Sticky Icons’ improves target acquisition by decreasing
the mouse acceleration to one while the user is inside the icon. Worden et al.
(1997) conducted an evaluation that found Sticky Icons to be efficient for selecting
small targets. Cockburn & Firth (2003) also found Sticky Icons to be significantly
faster for small target acquisition than normal selection.
Semantic pointing is another selection technique designed to increase target
acquisition through control-display adaptation (Blanch et al. 2004). This
tech-nique adjusts the control-display gain according to cursor distance to nearby
tar-gets making the target feel larger to the user. An evaluation (n=12) conducted by
Blanch et al. found no significant difference in task completion time and error
rates compared to normal selection.
2.2 Scrolling Techniques
2.2.1 Alternative Scroll-bars
The AlphaSlider, first proposed by Osada et al. (1993), is an alternative scrolling technique for precise selection in large lists (see Figure 2.1(a)). The AlphaSlider is
used like a horizontal scroll-bar with an index on the bottom and the text displayed
in the top left. The main advantage of the AlphaSlider interface is that it is very
efficient in its screen space use — it uses only one line of text output. One of
its disadvantages is that it allows less use of context in searching. With a typical
drop-down list-box interface, there are other words in the interface from which the
subject can see where (s)he is in the list and how fast the alphabet is being moved
through.
Ahlberg & Shneiderman (1994) conducted an evaluation investigating the effi-ciency of three different implementations of AlphaSliders against traditional scroll
bars. They found no significant difference between the most efficient AlphaSlider
Two designs that improve upon the AlphaSlider are the FineSlider (Masui et al.
1995) and the Stretch Button Scroll-bar (Smith & Henning 1996). The FineSlider is based upon the AlphaSlider but uses an elastic technique based on a rubber band
metaphor (see Figure 2.1(b)). A control object such as a scroll bar is moved by
pulling the object with a rubber band between the object and the mouse cursor.
An evaluation where participants searched for a movie title from a title list with
10,000 entries showed that on average the FineSlider compared to the AlphaSlider
is faster for novice users and only very slightly slower for expert users. The Stretch
Button Scroll-bar uses a completely different approach (see Figure 2.1(c)). The
scroll handle is modified with two extra buttons, one on either side. These buttons allow fine movement similar to that provided by the arrow movement buttons on
traditional scroll bars. An evaluation designed to compare search performance of
the Stretch Button Scroll-bar, the standard scroll-bars and the Alphaslider found
that stretch button scroll bar was 23% and 16% faster than the Alphaslider and
standard scroll bars, respectively.
(a) The AlphaSlider. (b) The FineSlider. (c) The Stretch Button Scroll-bar.
Figure 2.1: Alternative Scroll Bars.
One of the major drawbacks of scroll bars is that they do not offer adequate
cognitive aids to the user to form a mental model of the material. Many overview
plus detail visualisation techniques have been designed as a solution to this
prob-lem (see Section 2.7). Overview plus detail scroll bars have also been proposed. Two such solutions are the Bookmark Scroll Bar and the Calendar Scroll Bar
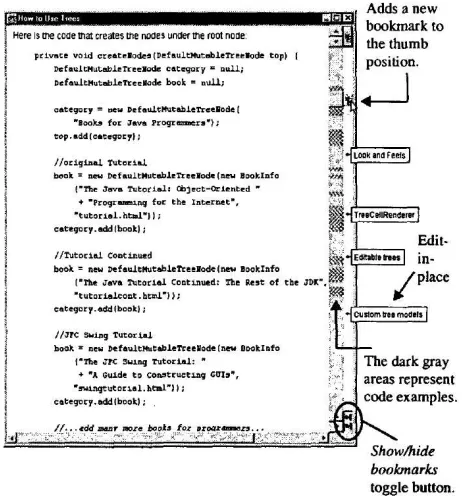
(Laakso et al. 2000). The Bookmark Scroll Bar interface includes two scroll bars
dis-plays bookmarked pages and when used snaps the user to the nearest displayed
bookmark. New bookmarks can be added in the interface by clicking the new bookmark button. The goal of this interface is to “transfer the knowledge in the
user’s memory to the knowledge in the world as effectively as possible” (Laakso
et al. 2000). The Calendar Scroll Bar takes the idea of presenting an overview on
the scroll bar further. The scroll area not only has an overview of the calendar but
also includes visual cues of interesting days. Neither of the interfaces have been
[image:30.595.175.406.281.529.2]evaluated.
Figure 2.2: The Bookmark Scroll Bar.
2.2.2 Rate-based Scrolling
Rate-based scrolling is ideal for isometric self-centring joysticks, such as the
Joystick-Mouse (JMouse) and the In-keyboard Joystick, both shown in Figure 2.3. Several evaluations investigating the efficiency of these devices have been
performed. Zhai et al. (1993) conducted an evaluation timing users searching
de-vices: a standard two button mouse, a scroll wheel mouse, a JMouse and the
In-keyboard Joystick with the dominant hand on a standard mouse for hyperlink selection. Their evaluation found no significant difference between performance
using the JMouse or using the In-keyboard Joystick with the dominant hand on the
mouse. They did find, however, a significant difference between tasks completion
times for the two isometric joystick devices and the two other mouses. Tasks were
completed 22% and 31% faster with a JMouse compared to the wheel mouse and
standard mouse, respectively. Using In-keyboard joystick and the mouse tasks
were completed 26% and 35% faster compared to the wheel mouse and standard
mouse, respectively.
(a) The JMouse. (b) In-keyboard Joystick.
Figure 2.3: Isometric Joysticks used for rate-based scrolling. Figures taken from Zhai et al.’s paper on improving browsing performance.
Hinckley et al. (2002) conducted an evaluation comparing the IBM Scroll-Point Mouse, a commercial device based on the JMouse against three different
scroll wheel configurations. The scroll wheel configurations used were a standard
configuration (3 lines per notch), and two configurations using different wheel
ac-celeration algorithms. They found no significant difference between the standard
scroll wheel configuration and the ScrollPoint. The scroll wheel configurations
using acceleration algorithms were slightly faster. Their analysis indicated that
short distance tasks (100 lines or less) were performed significantly slower with
the ScrollPoint. However, the ScrollPoint’s performance dramatically increased for long distance tasks, with ScrollPoint’s time equalling the fastest wheel
accel-eration algorithm at the greatest distance. Users also indicated they felt it was
2.3 Zooming Interfaces
Studies have been carried out by Combs & Bederson (1999) to determine whether
zooming improves image browsing. They found that zoomable user interfaces and
2D interfaces perform equally.
Pad (Perlin & Fox 1993) and Pad++ (Bederson & Hollan 1994) are zoomable
user interface toolkits that provide continuous zooming as a central navigation
tool. Objects are spatially organised in 2D space, and the user acquires an object
by using scrolling and zooming operations. The drawback to this type of interface is that a user must control both scrolling and zooming interfaces. Speed-dependent
Automatic Zooming (Igarashi & Hinckley 2000) attempts to integrate scrolling
with zooming so that users need only be concerned with required information.
Neither, Pad or Pad++ have been empirically evaluated.
2.4 Speed-Dependent Automatic Zooming
2.4.1 Igarashi & Hinckley’s Work
The concept of speed-dependent automatic zooming (SDAZ) was first proposed
by Igarashi & Hinckley. They implemented several SDAZ prototype systems in
the JavaTM programming language: a web browser, a map viewer, a sound editor,
an image browser, and a dictionary viewer. Of these, the web browser and map
viewer were successful in providing a potentially more efficient browser.
Igarashi & Hinckley initially proposed using Equations 2.1 and 2.2 to
calcu-late the scrolling speed and document scale, respectively. They then revised their
equations to achieve a more natural interaction. In the revised equations, shown
in Equations 2.3 and 2.4, the current zoom level (or scale) of the document is
calculated from the distance the user moves the mouse, and scroll speed is then calculated from the resulting zoom level. These new mappings conflict with the
notion that zooming is dependent upon scroll speed in order to keep visual flow
constant. Igarashi & Hinckley’s paper failed to give predefined constants for their
speed =C×dy (2.1)
Equation 2.1: Igarashi & Hinckley’s initial equation to calculate speed, where
speed is the vertical scrolling speed in the document, C is a predefined constant
modifying the scroll speed and dy is the current distance the cursor has travelled.
scale= v0
speed (2.2)
Equation 2.2: Igarashi & Hinckley’s initial equation to calculate document scale,
where v0 is the predefined speed reached before scaling starts, and scale is the
magnification scale of the document.
speed= v0
scale (2.3)
Equation 2.3: Revised mapping for calculating the scrolling speed in the docu-ment, where v0 is the predefined speed reached before scaling starts, and scale is
the magnification scale of the document.
scale=s0(dy−d0)/(d1−d0) (2.4)
Equation 2.4: Revised mapping for calculating the scale of the document, where
dy is the current distance the cursor has travelled, s0 is the predefined minimum
scale, d0 is the predefined mouse movement required before zooming starts, and
d1 is the predefined maximum mouse movement.
Igarashi & Hinckley further modified their equations, during implementation,
by introducing a delay in scaling. They found this was necessarily to prevent the document appearing to ‘swell’ suddenly when the user reversed the scrolling
direction.
The following subsections describe Igarashi & Hinckley’s SDAZ interfaces
and the results from the evaluations conducted with the interfaces.
Web Browser
in Figure 2.4. When the user presses the mouse button (presumably the left),
a pink slider showing the document scroll speed appears on the right hand side of the screen. The scroll speed is increased by moving the mouse up or down
while holding down the button. As the scroll speed increases, the document text
becomes smaller, giving an overview of the document. When the user releases the
mouse button, the text gradually returns to original size.
(a) Static view. (b) Scrolling slowly. (c) Scrolling fast. (d) Scrolling very fast.
Figure 2.4: Igarashi & Hinckley’s Prototype Web Browser.
The web browser study timed seven subjects searching for images in a web
document. They found that subjects using SDAZ and conventional scrolling per-formed approximately equally well, even though subjects had little experience
with the new SDAZ interface. They also found that six out of seven subjects
preferred automatic zooming, which suggests it might be a suitable alternative to
traditional scrolling.
Map Browser
Igarashi & Hinckley’s map browser (Figure 2.5) has two methods of interaction.
One method is holding the mouse button down and dragging the mouse. The
relative position between the point of the initial click of the mouse button and
the current mouse position specifies the direction and speed of movement. The second method of interaction is using a joystick. The more the user tilts the stick,
the faster (s)he scrolls, and the smaller the view gets. This method was used in
The map browser uses an artificially generated map based on Perlin’s noise
function (Perlin 1985). This increased performance of the browser with minimum implementation effort.
The evaluation consisted of users locating different targets in a 2D map using
traditional scrolling/zooming and SDAZ. The task completion time results were
mixed compared to the web browser. The authors suggest that this was because the
map navigation task was more difficult than browsing a document, which caused users to employ a range of different strategies. The most efficient strategy is to
zoom out until the target appears on the screen, move to the target, and then zoom
in. However, some subjects slowly moved to the target without zooming out,
which took a long time.
The results from the subjects’ qualitative evaluations were also mixed, with four out of the seven subjects preferring the SDAZ interface.
(a) Static view. (b) Scrolling slowly. (c) Scrolling fast.
Figure 2.5: Igarashi & Hinckley’s Prototype Map Browser.
Unsuccessful Deployments of SDAZ
Igarashi & Hinckley also experimented with three ‘unsuccessful’ domains for
SDAZ: a sound editor, an image browser and a dictionary viewer. Their
obser-vations and the reasons for failure are informative for those considering SDAZ
deployment.
Igarashi & Hinckley experimented with a sound editor with automatic zoom-ing. They found the system was very difficult to use because of the lack of
ap-propriate visual landmarks needed for automatic zooming targeting. The
A prototype image browser was developed to browse a collection of images
(Figure 2.6). The images were aligned in a horizontal list which user browsed by moving along. As the scrolling speed increased, the images became smaller so
that more of them could be placed on the screen.
(a) Static view. (b) Scrolling slowly. (c) Scrolling fast. (d) Scrolling very fast.
Figure 2.6: Igarashi & Hinckley’s Prototype Image Viewer.
Igarashi & Hinckley found that their automatic zooming image browser was less effective than a standard static array of thumbnails. This is because the image
browser lacked the same abstraction given by the other browsers. For example,
when browsing with the map browser, narrow streets fade away in the zoomed-out
view, and highways and area labels become landmarks. In the web browser, the
smaller body of text becomes blurry and only pictures and headings are clear for
navigation. In the Image Browser, however, each image is unique and the order of
the images is not important, so the same abstraction is missing.
In the dictionary viewer, the zooming-out effect is achieved by pruning out
the less important items (2.7). Words are displayed in alphabetical order and are
scrolled vertically by holding the middle button down and moving the mouse up
and down. As the user scrolls faster, words are elided from the list.
Igarashi & Hinckley found the elision effect confusing to use. In addition, they
found it required a significant cognitive overhead to locate a target word in the
zoomed-out view because the user has to constantly think about the alphabetical order between the visible and target words. The example given by Igarashi &
Hinckley shows that when searching for “bear”, the user has to steer between
(a) Static view. (b) Scrolling slowly. (c) Scrolling fast.
Figure 2.7: Igarashi & Hinckley’s Prototype Dictionary Viewer.
2.4.2 Cockburn & Savage’s Work
Cockburn & Savage (2003) implemented two SDAZ interfaces: one for
view-ing text documents the other for map documents (see Figures 2.8 and 1.1). The
interfaces were used to conduct an ecologically oriented evaluation comparing
SDAZ against traditional scroll, pan, and zoom techniques. Their evaluation
re-sults showed that tasks were completed, on average, 22% and 43% faster in the
SDAZ Document and Map Browser, respectively, and that all participants but one preferred SDAZ. Cockburn & Savage give the following potential explanations
for why their results differ from Igarashi & Hinckley:
• Implementation — Cockburn & Savage’s systems were implemented in C and OpenGL exploiting high frame-rates and fluid animation available
through hardware acceleration. Igarashi & Hinckley’s systems were
im-plemented in Java most likely having slower frame-rates. In their document
interface, discrete font sizes were used to simulate dynamic font scaling and
to improve performance in zoomed-out views, text was depicted as
horizon-tal lines rather than miniaturised fonts. In their map browsing evaluation an
artificially generated map was used rather than a real one.
• Experimental Objectives — Igarashi & Hinckley’s primary objective was to describe their fascinating new interaction technique. Their experiment was
intended only to provide initial impressions of the technique’s effectiveness. Cockburn & Savage suggest that with different experimental objectives, and
with greater statistical power from wider participation, they may have been
• Competing Interfaces — Cockburn & Savage’s SDAZ interfaces were com-pared against commercial implementations of traditional systems (Adobe Acrobat Reader and Paint Shop Pro), and all interfaces were controlled
us-ing a mouse. Igarashi & Hinckley’s SDAZ document browser was
com-pared against a mouse-driven unspecified web browser. They did not specify
whether their competing web browser supported zooming; their screen shots
suggest it did not. Cockburn & Savage believe it is unlikely that Acrobat
Reader’s zooming facilities cause slower performance in their evaluation,
accounting for the comparative efficiency of SDAZ.
In Igarashi & Hinckley’s map navigation tasks both interfaces were
con-trolled using a joystick, allowing users to pan and zoom concurrently when
using traditional interfaces. Cockburn & Savage’s mouse control, however,
required scrolling and zooming to be carried out either in series (using dis-crete zoom adjustments, then scrolling) or in a combined action (using Paint
Shop Pro’s centring zoom).
• Task Types — Igarashi & Hinckley’s map browsing tasks involved locating a highlighted dot in an artificial terrain. The dot was continually visible in
a small ‘global radar’ in the corner of the display. Their tasks test abstract
target acquisition modeled by Fitts’ Law. Cockburn & Savage’s tasks were ecologically orientated involving extraction of meaningful information from
different levels of magnification.
• Participants — In Igarashi & Hinckley’s evaluation participants were all “good” or “average” computer users, with four of the seven reporting that
they played computer games “sometimes”, “frequently” or “almost every
day”. All twelve of Cockburn & Savage’s participants were expert computer users (graduate level Computer Science students), and all but three regularly
played computer games.
Cockburn & Savage used different equations from Igarashi & Hinckley to
con-trol the scroll speed and zoom level in their interfaces. Equations 2.5 and 2.6 show Igarashi & Hinckley formulae calculating the scroll speed in the document
and map browsers. These equations, unlike Cockburn & Savage’s, use cursor
(a) Static (b) Slow Scroll Speed
[image:39.595.130.486.121.421.2](c) Fast Scroll Speed (d) Fastest Scroll Speed
Figure 2.8: Screen Shots from Cockburn & Savage’s Text Document Browser.
the resulting speed using Equation 2.7. Cockburn & Savage do not state their
predefined constants in their paper.
scrollspeed=|Yip−Ycp| (2.5)
Equation 2.5: Calculates the scroll speed in a 1D text document, where Yip
rep-resents the initial clicked y position of the cursor and Ycprepresents the current y
position of the cursor.
scrollspeed=
q
(Yip−Ycp)2+ (Xip−Xcp)2 (2.6)
Equation 2.6: Calculates the scroll speed in a 2D document, where Xip and Yip
represent the initial clicked x,y coordinates of the cursor, and Xcpand Ycprepresent
zoomlevel=k×scrollspeed−threshold (2.7)
Equation 2.7: Calculates the zoom level, where k is a predefined constant
con-trolling the rate of zooming, scrollspeed represents the scrolling speed in the
document, and threshold is a predefined constant representing the scroll speed
required before zooming begins.
2.4.3 Application of SDAZ on Small Screen Devices
Jones et al. (2004) conducted an evaluation comparing SDAZ document and map
browsers against standard scroll, pan and zoom browsers on small screen displays.
They found SDAZ was, on average, 29% slower for browsing text documents.
No significant difference was found for mean task completion times when map
browsing. SDAZ users, however, performed a significantly lower number of ac-tions completing tasks in both interfaces. The mean number of acac-tions for tasks
completed in the document browser was 2.76 using SDAZ and 6.92 using standard
techniques. In the map browser, an average of only 1.97 actions were performed
using SDAZ compared to an astonishing 17.66 actions using standard techniques.
Accuracy was also 40% higher using SDAZ in the map browser, compared to
standard techniques. However, the reverse is true in the document browser where
accuracy is 29% higher using standard techniques.
Eslambolchilar & Murray-Smith (2004) implemented tilt-based and stylus-based SDAZ text browsers on a Pocket PC. Tilt-stylus-based input used an accelerometer
attached to the bottom of the Pocket PC to measure the pitch and roll angles. These
angles controlled the scrolling speed in the document, with an increase in the tilt
increasing the scrolling speed in that direction. As the scrolling speed increased
the system automatically zoomed out. In the stylus-based interface scrolling was
initialised by placing the stylus on the Pocket PC screen, the displacement of
the stylus from the initial point controls the scroll speed. A greater displacement
causes a faster scrolling speed and a higher level zoom in the document. No formal
evaluations have been performed to assess the efficiency or the usability of these
new techniques.
Control feedback for the SDAZ map interface on mobile devices was explored
map browser. The inner circle indicates when zooming begins, the outer circle
indicates when zooming finishes, the rectangle is the point the system zooms-in to, and the straight lzooms-ine zooms-indicates the size and direction of the pozooms-intzooms-ing device’s
displacement. Alley et al. conducted an evaluation comparing three levels of
feed-back detail: all (all feedfeed-back shown in Figure 2.9), circles (threshold circles and
mouse line only), and none (mouse line only). They found that feedback
configu-rations seem to have little impact on the success or performance when navigating
to a particular destination. Alley et al. suggest that the intrinsic feedback of SDAZ
(transformation of the information space) is sufficient.
Figure 2.9: Alley et al.’s proposed control feedback design for the SDAZ map browser.
2.5 3D Systems
Depth-modulated flying (Ware & Fleet 1997) and speed-coupled flying with
or-biting (Tan et al. 2001) are both techniques used to navigate in a 3D world.
Depth-modulated flying uses continuous height sampling to control the flying speed. The
idea is to fly slower when closer to the ground and faster when higher. Ware & Fleet conducted an evaluation comparing five different implementations of
depth-modulated flying: no velocity scaling (velocity is varied by user interface widgets
scaling (farthest point in the scene determines speed), average depth scaling (the
average depth in the scene determines speed) and average depth scaling with hot spot (the average depth in the scene determines the speed with the weight of the
depths in the current viewed area multiplied by five). They claim that near point
scaling, average depth scaling and average depth scaling with hot spots were
su-perior, however no statistical tests were used to prove significance. Speed-coupled
flying uses the opposite approach. It modulates the height and tilt of the camera
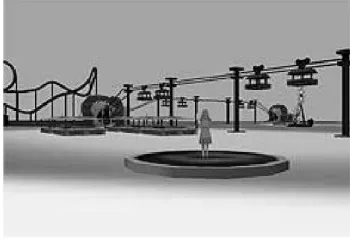
based on the flying speed (Figure 2.10). Speed-coupled flying is essentially based
on SDAZ but in a 3D world. Tan et al. also added orbiting to speed-coupled flying
to allow a user to fly around (‘orbit’) an object by clicking the object and dragging the mouse. Two evaluations where participants located different objects in a 3D
scene were conducted. Speed-coupled flying with orbiting was the most efficient
navigation technique compared to three competing techniques: basic driving
nav-igation (with and without orbiting), speed-coupled flying without orbiting, and
ephemeral world compression (allows users to shrink the 3D world to gain an
overview).
(a) Local view of scene while standing still or moving slowly.
[image:42.595.96.271.428.554.2](b) Overview of scene while moving fast.
Figure 2.10: Speed-coupled flying with orbiting.
2.5.1 Animation
One of the goals of SDAZ is to smoothly navigate between two close-up views.
van Wijk & Nuij (2003) discuss the ‘optimal’ animation between two known
and efficient. A smooth animation path should be continuous in the sense that no
sudden steps are made or abrupt changes in direction occur. The most efficient path is the shortest path in pan and zoom space so that the camera moves from
point A to point B as fast as possible. This would be a straight line between A
and B if the smoothness and the viewer’s maximum perceived velocity were not
considered. By zooming out, the perceived velocity is less than the actual
docu-ment velocity. Therefore, the camera can be moved faster when it is moved further
away from the document, with its perceived velocity remaining the same.
The computational model proposed by van Wijk & Nuij is limited to the
per-ceptual level, and it does not take in account cognitive aspects such as memory,
meaning of image or complexity of the image shown. These aspects are extremely hard to incorporate into a formal model. They suggest that a perceptually smooth
motion will aid in cognition. The computation model assumes that each part of
the image is equally interesting (same characteristics, same visually density etc)
but this is not the case in real-world applications, such as cartography where urban
areas are more interesting than uniformly coloured oceans.
van Wijk & Nuij suggest that their computational model could be used to
implement a system similar to SDAZ. They propose a system that uses the scroll
handle on scroll bars to determine the destination point. In the proposed system,
the user can scroll to a distant location by acquiring the scroll handle and moving
to the desired location; van Wijk & Nuij’s model then is used to smoothly animate between the two points. This proposed navigation technique has not yet been
evaluated.
2.6 Navigation Analysis
2.6.1 Fitts’ Law
Fitts’ Law (1954) is a quantitative human performance model used for predicting
the time taken to perform one-dimensional movement tasks. Shannons’
formula-tion, shown in Figure 2.8, is an adaption of Fitts’ Law for 2D pointing tasks in
graphical user interfaces (MacKenzie 1992). The time MT is predicted by Equa-tion 2.8 and relies on the logarithm of the distance that the pointer must move
(the amplitude) A over the width of the target W . MacKenzie & Buxton suggest
a and b, represent the cognition and motor preparation time, and the hand-eye
co-ordination, respectively. Since task difficulty is analogous to information, the rate of task execution can be interpreted as the human rate of information processing.
Therefore, an index of performance (IoP) or ‘bandwidth’ in bits per second can
be calculated using Equation 2.9.
MT =a+b log2(A W +1)
| {z }
Index o f di f f iculty
(2.8)
IoP= 1
b (2.9)
Guiard et al. (1999) suggest that Fitts’ law can be extended further to cover
multi-scale navigation. They conducted a preliminary evaluation showing that
users can handle higher levels of task difficulty (IoD>12bits) with two-scale rather than traditional one-scale pointing control.
2.6.2 Space-Time Diagrams and U,W Space Diagrams
Space-time diagrams and u,w space diagrams are ways of representing movement
in 3D space (see Figure 2.11). Furnas & Bederson (1995) created space diagrams
to visually depict multiscale viewing (see Figure 2.11(a)). The horizontal axis
denotes space, while the vertical axis denotes scale. Furnas & Bederson show
how this diagram can be employed to attack a variety of problems associated with
multiscale viewing, including optimal pan-zoom trajectories. Optimal is defined as the shortest path. van Wijk & Nuij (2003) adapted the space-time diagram to
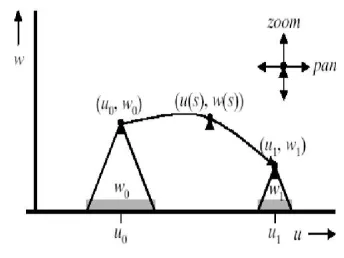
create a u, w space diagram, where u denotes panning and w denotes zooming
(see Figure 2.11(b)). van Wijk & Nuij claim u, w space diagrams are simpler to
understand and work with.
2.7 Additional Focus Plus Context Techniques
A well established technique for allowing navigation in large information spaces is overview plus detail (Baldonado et al. 2000, Plaisant et al. 1995, Hornbæk &
Frøkjær 2001). This visualisation technique provides a small window, which is
(a) Example of Furnas & Bederson’s space-scale diagram displaying auto-matic zooming behaviour (v=scale, xy=space, p=initial position, q=target position).
(b) Example of Wijk & Nuij’s u,w diagram displaying animation between two points (w=zoom, u=pan, (u0,w0)=initial point,
[image:45.595.322.494.138.267.2](us,ws)=intermediate point, (u1,w1)=final point).
Figure 2.11: Examples of diagrams used to represent movement in multiscale environments.
overview of the information space (see Figure 2.12(a)). This window is not only
used to show the current location and context in the document, but also to quickly
shift from one location to another, a technique generally performed by clicking the desired location inside the overview window. The drawback to this technique
is that the overview takes up precious screen space.
Focus plus context screens, introduced by Baudisch et al. (2001) extend the
use of overview plus detail visualisations. Generally, they consist of a wall-size
low-resolution display for context with an embedded high-resolution display for
detail (see Figure 2.12(b)). The obvious drawback to these types of displays is
their cost and sheer size. Baudisch et al. (2002) found that information can be
ex-tracted from static documents 21% and 36% faster with focus plus context screens
compared to overview plus detail visualisations and zooming panning,
respec-tively.
Another focus plus context technique designed to reduce information over-load is the Fisheye view (Furnas 1986). Fisheye views reduce the size of the
document by magnifying the focused area, while the non-focused areas are
(a) Hornbæk and Frøkjær’s overview plus detail visualisa-tion. Overview of the text doc-ument is displayed on the left hand side, while the detailed view is displayed on the right.
(b) Baudisch et al.’s focus plus detail screen.
[image:46.595.143.476.134.349.2](c) Gutwin’s interactive Fish-eye view for browsing a web site. The focus point is tied to the mouse cursor, and ob-jects grow larger as the focus approaches them.
Figure 2.12: Common focus plus context techniques.
is that focus-targeting is difficult for most users because targets move in the
op-posite direction to the motion of the magnifying lens. A focus target will move
towards an approaching pointer, and away from a retreating one, making it more
difficult to precisely position the focus point relative to the underlying visualised
data. To make matters worse targets move fastest when the cursor enters the target,
making it difficult for a user to precisely position the pointer over the target. A so-lution to this problem is speed-coupled flattening (Gutwin 2002). This technique
reduces the distortion level of the focus, based on pointer velocity and
accelera-tion. Speed-coupled flattening was proven to significantly reduce both targeting
time and targeting errors in Fisheye environments.
Hornbæk & Frøkjær (2001) conducted a study (n=20) comparing the usability
of three interfaces: a standard linear interface, a fisheye interface, and an overview
plus detail interface. They found essays were written slower using overview plus
detail but received higher grades. Documents were read the fastest using the fish-eye interface. The standard linear interface was found to be inferior to the fishfish-eye
and overview plus detail interfaces in most aspects of usability. All participants
rec-ommend overview plus detail interfaces for electronic documents, while Fisheye
interfaces should be used for time-critical tasks.
2.8 Human Processing of Visual Flow
Visual flow is defined as the amount of visual information passing across the
screen at any one point in time. The information can be in the form of text and/or
images. This section will focus primarily on the discussion of past research related
to human processing of visual flow.
Previous research into human visual perception discovered that the human eye summates signals over a period of 120-125ms (Card et al. 1987, Burr 1980,
Zagier 1997). Image blurring should then be predicted to occur by displacing
the data over a 120ms time slot. Burr (1980) found, however, that the blurring
of the image is significantly less than previously predicted. This is because the
human visual system reduces the perceived blur by tracking moving objects with
‘smooth-pursuit’ eye movement (Eckert & Buchsbaum 1993). Tracking moving
targets with the eye reduces the relative velocity of the image across the retina.
An image can travel 3 degrees per second across a human retina without an
effect on the image acuity (Morgan & Benton 1989). A comfortable retinal-image
velocity is only 2 degrees per second (Kelly 1979). Using visually induced con-jugate eye movements, viewing velocities are dramatically increased (Missal &
Keller 2002). The oculomotor repertoire, controlled by the nervous system,
con-tains two different kinds of visually induced conjugate eye movements:
smooth-pursuit and saccades. The smooth-smooth-pursuit system is used when an object is
mov-ing less than 100 degrees per second (Krauzlis & Stone 1999). As soon as an
object starts to move, the smooth-pursuit system initiates an eye velocity equal to
that of the target. This reduces the relative velocity on the retina so that the image
is stabilised on the foveal region. The saccades system induces a rapid shift of the
visual axis between different positions. As no visual feedback is used to guide the
orientation of the eyes during the movement, the velocity can be extremely high, up to 1000 degrees per second. However, image acuity is dramatically reduced.
Preattentive processing allows humans to automatically process the
organisa-tion of the visual field. Examples of visual features that can be detected in this
preattentively (i.e. without the need for focused attention) is completed in less
than 200 milliseconds (Healey et al. 1996). This is because eye movements take at least 200 milliseconds to initiate.
2.8.1 Rapid Serial Visual Presentation
A technique that takes advantage of preattentive processing is Rapid Serial Visual Presentation (RSVP). RSVP is described as the “electronic equivalent of riffling a
book in order to assess its content” (Spence & deBruijn 1999). Words or pictures
are presented successively, often at fast rates, at the same spatial location on the
screen. Generally, objects in RSVP systems are visible for 200–400 milliseconds
(Spence 2002). Humans have the ability, however, to recognise the presence of a
target image in as little as 100 milliseconds or even less (Healey et al. 1996).
The concept of RSVP was first introduced by Forster (1970) to study the com-prehension and processing of written language. He performed four similar
ex-periments in which words were displayed in rapid succession; participants were
then asked to record what they had seen. He found that an increase in the syntax
complexity or information content of the sentence, required an increase in expose
time to the visual display, otherwise information is lost by the participant.
In RSVP, objects are presented in the same spatial location to prevent the
breakdown of the subject’s capacity to organise the input sequence, affecting the
comprehension of the information (Forster 1970). If the individual words of a
sen-tence are consecutively displayed so that each word falls on roughly the same re-gion of the retina, then the occurrence of each new word eliminates the preceding
word from the sensory storage system (Kahneman 1968). Thus, any possibility of
a cumulative sensory storage of the input is eliminated, and the subject is forced
to process each word as it occurs.
The adaption of RSVP for computer systems was first established by Aaronson
& Scarborough (1977). Since then the technique has been generalised to the field
of information navigation (Spence & deBruijn 1999). Spence (2002) suggests the
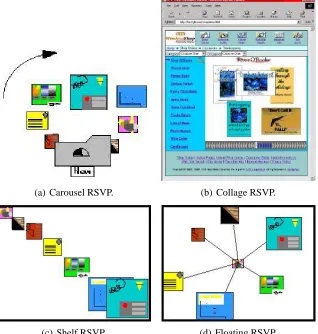
main RSVP navigation interfaces are ‘keyhole’, ‘carousel’, ‘collage’, ‘shelf’ and ‘floating’. The keyhole interface is similar to a slide show. A single image is
presented and updated at regular intervals. The images shown using the keyhole
displays a series of images on the screen simultaneously. The images begin small
and are rotated in a clockwise direction. As the images come closer to the top of the rotation, they increase in size (see Figure 2.13(a)). The collage interface
overlays new images over the top of previous images (see Figure 2.13(b)), similar
to a person dropping photos one by one on a table top infront of the user (Spence
2002). In shelf RSVP, images are initially displayed at ‘full size’ in the lower
right-hand corner of the display. Images are moved at a constant speed, along a
linear trajectory, towards the upper left-hand corner of the display. The images
are decreased in size as they move towards the upper left-hand corner (see Figure
2.13(c)). In floating RSVP, new images appear in the distance and move towards the user until they disappear from the screen. This gives the user an effect similar
to driving down a highway watching billboard advertisements pass by (see Figure
2.13(d)).
Spence & deBruijn conclude that RSVP is a valuable technique for
search-ing and browssearch-ing information on small screen displays, such as PDAs and mobile
phones. Research by Rahman & Muter (1999) has shown that RSVP can be used
to present text on small displays, and is as efficient as the normal page format.
Normal page format is analogous to text on the page of a book. Participants
gen-erally dislike using RSVP, compared to other techniques such as times square
(Kang & Muter 1989), sentence-by-sentence and normal page format. Attempts to improve preference for and feasibility of RSVP have been explored (Rahman &
Muter 1999). Rahman & Muter found that user preference was significantly
im-proved over normal RSVP by including a completion meter, punctuation pauses,
(a) Carousel RSVP. (b) Collage RSVP.
[image:50.595.132.450.237.571.2](c) Shelf RSVP. (d) Floating RSVP.
Chapter III
Fundamentals of SDAZ Behaviour
The commercial viability of SDAZ largely depends on its ‘out of the box’
con-figuration. Its default behaviour needs to be as optimal as possible because default
settings are rarely modified. Configuration tools should still be provided for ad-vanced users to tailor personal settings.
The primary goal of this chapter is to identify the low level components of
SDAZ behaviour so that parameters and optimal values for the parameters can be
established. The identification of components will also help in the development
of tools to accurately and completely tailor SDAZ.
The secondary goal of this chapter is to identify and discuss additional
fea-tures enhancing the usability of SDAZ for future implementers (see Section 3.2).
Features discussed in this section include: how the user scrolls in the interface,
what is displayed to convey the scroll speed and direction, and what region the
system rezooms to after the user has finished scrolling.
3.1 Low Level Behaviour of SDAZ
This section describes the low level components of SDAZ behaviour: the core
mappings and the constraints limiting the rate of change in these mappings. There
are three core mappings performed in series determining the behaviour of SDAZ
(enumerated below). The constraints placed on these mappings are discussed in
Section 3.1.1.
1. Mouse Motion to Cursor Displacement — The computer’s control-display gain maps the physical displacement of the mouse to the corresponding
movement of the cursor on the screen (see Section 2.1). Generally, this
2. Cursor Displacement to Scroll Speed — This mapping describes the
rela-tionship between cursor displacement and the corresponding scroll speed in the document. An example linear relationship is illustrated in Figure 3.1(a).
By itself this mapping describes the behaviour of rate-based scrolling.
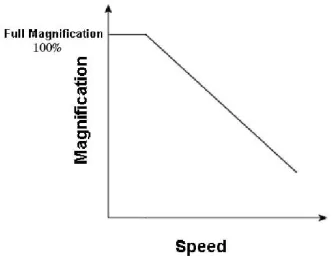
3. Scroll Speed to Magnification Level — This mapping describes the
au-tomatic zooming behaviour: the relationship between the scroll speed and the magnification of the document. An example relationship is illustrated in
Figure 3.1(b).
When using SDAZ, mouse movement is translated using the control-display
gain settings to cursor movement, this is mapped to a document scrolling speed
and the zoom level is then automatically adjusted to keep visual flow across the
screen constant.
This thesis focuses on the calibration of the second and third mappings: the
relationship between cursor displacement and scroll speed, and the relationship
between scroll speed and magnification. Values for these mappings are provided
in Section 5.3. The control-display mapping is not calibrated in this thesis because
we believe it should be left to the Operating System settings for consistency with
other interfaces.
3.1.1 Mapping Constraints
This section focuses on constraints limiting the rate of change of scrolling velocity
and magnification. We have defined four possible constraints, however, we believe only three are necessary to achieve optimal calibration.
1. Maximum Ascent Rate — limits the maximum decrease in magnification
per second. Prevents users from zooming out of the document too fast.
2. Maximum Descent Rate — limits the maximum increase in
magnifica-tion per second, while the user is scrolling. Reduces the ‘slamming’ effect
experienced when changing direction (see Figure 3.2).
3. Maximum Fall Rate — limits the maximum increase in magnification per