Adaptive sampling technique using regression modelling
and fuzzy inference system for network traffic
SALAMA, Abdussalam, SAATCHI, Reza
<http://orcid.org/0000-0002-2266-0187> and BURKE, Derek
Available from Sheffield Hallam University Research Archive (SHURA) at:
http://shura.shu.ac.uk/16789/
This document is the author deposited version. You are advised to consult the
publisher's version if you wish to cite from it.
Published version
SALAMA, Abdussalam, SAATCHI, Reza and BURKE, Derek (2017). Adaptive
sampling technique using regression modelling and fuzzy inference system for
network traffic. In: CUDD, Peter and DE WITTE, Luc, (eds.) Harnessing the power of
technology to improve lives. Studies in Health Technology and Informatics (242). IOS
Press, 592-599.
Copyright and re-use policy
See
http://shura.shu.ac.uk/information.html
Sheffield Hallam University Research Archive
Adaptive Sampling Technique Using
Regression Modelling and Fuzzy Inference
System for Network Traffic
Abdussalam SALAMA a , Reza SAATCHI a,1 and Derek BURKE b
aMaterials and Engineering Research Institute, Sheffield Hallam University, Sheffield,
UK.
bSheffield Children's Hospital, Sheffield, UK.
Abstract. Electronic-health relies on extensive computer networks to facilitate access and to communicate various types of information in the form of data packets. To examine the effectiveness of these networks, the traffic parameters need to be analysed. Due to quantity of packets, examining their transmission parameters individually is not practical, especially when performed in real time. Sampling allows a subset of packets that accurately represents the original traffic to be chosen. In this study an adaptive sampling method based on regression and fuzzy inference system was developed. It dynamically updates the sampling by responding to the traffic changes. Its performance was found to be superior to the conventional non-adaptive sampling methods.
Keywords. e-health, computer network traffic sampling, multimedia transmission, QoS.
1.Introduction
The growing use of mobile devices such as tablets, smartphones and wearable physiological wireless monitoring devices in the medical environments such as hospitals has provided opportunities as well as challenges. A beneficial effect of their use is that they can make it possible for mobile working where staff are less restricted to be desk bound or to carry around patients’ paper records [1][2]. A clinician can have access to the most up to date patients' medical records rapidly while visiting them on the wards, can incorporate new medical findings and information into the records that are in turn immediately accessible to other medical staff. Another growing area of interest is remote patient monitoring whereby some patients that otherwise would be kept in hospital would be discharged and their health is monitored through some wireless sensors attached to them. To achieve these, the performance of the associated wireless networks needs to meet the stringent medical standards. In order to determine the compliance of the networks to these requirements, suitable tools that indicate their performance or their quality of service (QoS) are needed.
An important tool for this task is sampling whereby instead of highly computationally intensive task of examining transmission parameters for every packet, a much smaller number of representative packets are selected and processed [3]. Sampling can be performed in an adaptive or a non-adaptive manner. In a non-adaptive
1
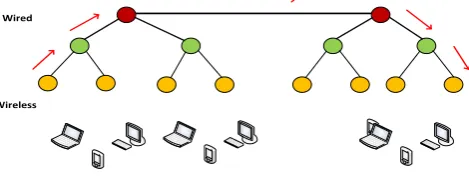
sampling, a fixed set of parameters are used irrespective of possible alterations in the network traffic. Systematic, random and stratified are possible non-adaptive sampling approaches. In a systematic sampling, a packet is selected at predefined fixed time intervals or based on a fixed number of packet count. Random sampling is similar to systematic but packets are selected at a random time interval or based on a random packet count number. Stratified sampling uses a combination of previous two methods where a fixed interval is defined and a packet is randomly chosen from that interval. Figure 1 illustrates systematic, random, and stratified sampling methods.
Figure 1 Non adaptive sampling method [4].
[image:3.595.136.458.489.562.2]It is advantageous to increase the number of selected packets when there is an increase in transmission rate and vice versus. In adaptive sampling incorporate changes in the traffic level [5] and thus it can produce a more optimum sampling outcome. In this study a linguistic information processing method called fuzzy logic was used to realise adaptive sampling. The processes that their modelling require complex mathematical expressions may be more conveniently represented in fuzzy logic [6]. Fuzzy logic can be applied and implemented in numerous ways, one of which is the Fuzzy Inference System (FIS) shown in Figure 2.
Figure 2. The fuzzy inference system.
The FIS has six elements: numeric inputs, fuzzification, knowledge base, inference engine, defuzzification and numeric outputs. The information to be processed is generally presented to the FIS in numeric form. The numeric values are then processed to determine the degrees they belong to a number of predefined sets. These sets are represented by membership functions. This process is called fuzzification. For example a traffic delay value can simultaneously belong to the fuzzy sets low_delay,
average_delay and high_delay with different degrees of memberships. Delay does not have to exclusively belong to a set. The fuzzified information is then compared by the inference engine with the coded knowledge in the knowledge base to drive conclusions. Typically the knowledge coding is achieved by a series of If-Then rules. The output of
Numeric Inputs
Knowledge base
Inference Engine
the inference engine is then defizzified into numeric form by using a number of membership functions for the outputs.
The FIS has previously been used for adaptive sampling of computer network traffic [7][8]. The main difference between this study and those reported previously is that in this study the traffic was modelled using linear regression. In the following sections, the study’s methodology, results and conclusions are explained.
2.Method
A network simulation tool called NS-2 [9] was used to design the network explored in this study. NS-2 is an accurate platform for simulating wired and wireless networks. The network (Figure 3) followed the standard hierarchical network design that divides the network topology into core, distribution and access layers to facilitate modularity and improved network management. This is also compliant with the Open System Interconnection (OSI reference model) standard that facilitates interconnectivity between networks.
Wired
[image:4.595.184.419.367.456.2]Wireless
Figure 3. The network topology used in the study.
The wired side of the network contained the core layer with the channel capacity of 5 Mbps and 2 ms propagation delay. The access layer represented the distribution side of the network and consisted of the IEEE 802.11e transmission protocol that incorporated Enhanced Distributed Channel Access (EDCA). The channel bit rate had the basic rate for controlling the frame transmission and general throughput rate was configured to be 1 Mbps, and data rate was configured to be 2 Mbps or 11 Mbps. The physical layer frequency was configured to be 914 MHz. Destination-Sequenced Distance Vector (DSDV) routing protocol was configured in all scenarios. The queuing mechanism was first-in-first-out (FIFO) with default configuration of 50 packets as queue size.
Different types of traffic were transmitted over the simulated network. The video streaming, VoIP, FTP, HTTP traffic were considered as best effort. VoIP traffic had a constant bit rate (CBR). Packet size for VoIP was configured to be 160 bytes and packet transmission rate was 50 packets per second. The audio coding was G.711 scheme that used 64 kbps transmission rate and pulse code modulation (PCM). For video streaming, the configured packet size was 512 bytes and its packet transmission rate was 100 packets per second. Video streaming frames were fragmented with maximum length of 1024 bytes and used MPEG-4 coding method.
receiving times, and packet types and sizes. Perl AWK tool was used to calculate packet delays, jitter and percentage packet loss ratio from the trace file. This tool enabled delay to be calculated for each packet. For the ith packet, delay (Di) was
calculated by subtracting the arrival time for the packet (𝑅𝑖) from the sent time (𝑆𝑖) as indicated by Eq. (1),
𝐷𝑖= 𝑅𝑖− 𝑆𝑖 (1) After calculating delay, AWK tool was used to calculate the absolute (i.e. negative jitters were considered as positive) value of ith jitter (Ji) by determining the difference
between the current packet delay (𝐷𝑖) and the delay for the previous packet (𝐷𝑖−1) as in Eq. (2),
𝐽𝑖= 𝑎𝑏𝑠𝑜𝑙𝑢𝑡𝑒 (𝐷𝑖− 𝐷𝑖−1) (2)
The percentage packet loss ratio (PLi) was measured by determining the total
number of received packets (∑ 𝑅𝑖 (𝑡)) and the total number of sent packets (∑ 𝑆𝑖 (𝑡)) at certain time (t) as illustrated in Eq. (3),
𝑃𝐿𝑖(𝑡) = 100
(1 −∑ 𝑅∑ 𝑆𝑖 (𝑡)𝑖 (𝑡)) (3)
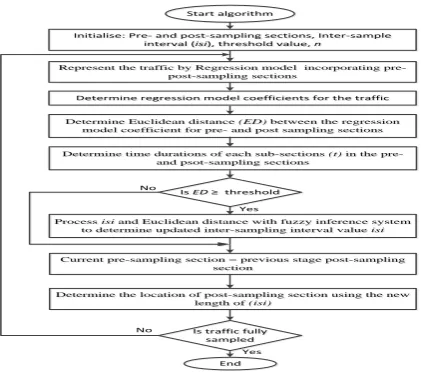
Once the traffic parameters (delay, jitter and percentage packet loss ratio) measures were obtained, they were processed by the developed adaptive sampling method. The method used linear regression to model the traffic and the output of this model was analysed by the fuzzy inference system (FIS) to dynamically adjust the sample rate. The algorithm’s operation is illustrated in the flow chart shown in Figure 4. The elements of the algorithm are:
Pre and post-sampling sections: These intervals contain the traffic that needs to be sampled. The duration of these intervals are kept fixed (predefined) and do not change during sampling process.
Inter-Section Interval (isi): This interval is between pre- and post-sampling sections. Its duration is adaptively updated by the FIS.
Threshold: This value was used to decide when the algorithm updates or retains the current inter-sampling interval. If the amount of traffic variation is less than the threshold then isi duration is not changed. However, if the amount of traffic variation is larger than the threshold then the algorithm determines a new duration for the isi.
Regression model: Each traffic parameter (i.e. delay, jitter and percentage packet loss ratio) were represented by an n
n matrix to allow regression analysis, where nis the number of sections in the pre- and post-sampling sections. Each sub-section contained n packets.
Euclidean distance (ED): ED values were used to quantify the amount of traffic variation between pre- and post-sampling sections.
Fuzzy inference system: FIS was used to determine updated duration for the isi
section based on its current value and the ED values.
The regression model provided the traffic coefficients for the pre- and post-sampling sections. The traffic parameters delay, jitter and percentage packet loss ratio were considered as the independent variables representing p values in regression Eq. (4), the sampling section was divided to sub-sections (s1, s2,...sn), each sub-section
Start algorithm
Start algorithm
Initialise: Pre- and post-sampling sections, Inter-sample interval (isi), threshold value, n
Initialise: Pre- and post-sampling sections, Inter-sample
interval (isi), threshold value, n
Represent the traffic by Regression model incorporating pre- post-sampling sections
Represent the traffic by Regression model incorporating pre- post-sampling sections
Current pre-sampling section = previous stage post-sampling section
Current pre-sampling section = previous stage post-sampling section
Determine the location of post-sampling section using the new length of (isi)
Determine the location of post-sampling section using the new length of (isi)
End
End
Determine regression model coefficients for the traffic
Determine regression model coefficients for the traffic
Determine Euclidean distance (ED) between the regression model coefficient for pre- and post sampling sections Determine Euclidean distance (ED) between the regression
model coefficient for pre- and post sampling sections
Is traffic fully sampled
Is traffic fully sampled No
Yes
Process isi and Euclidean distance with fuzzy inference system to determine updated inter-sampling interval value isi Process isi and Euclidean distance with fuzzy inference system
to determine updated inter-sampling interval value isi
Is ED ≥ threshold
Is ED ≥ threshold
Yes No
Determine time durations of each sub-sections (t) in the pre- and psot-sampling sections
[image:6.595.210.421.154.341.2]Determine time durations of each sub-sections (t) in the pre- and psot-sampling sections
Figure 4. The flow chart of the adaptive sampling algorithm.
In this study n was 3 that resulted in three sub-sections s1pre, s2pre, and s3pre for
pre-sampling section and s1post, s2post, and s3postfor post-sampling section as shown in Figure
5.
Tr
af
fic
Time
Pre-sampling section Post-sampling section
inter-sampling interval
(isi)
{
[image:6.595.153.436.415.504.2]S1pre
{
S2pre{
S(n)pre{
S1post S{
2post S(n)post{
Figure 5. Traffic representations by Regression Model.
Each sub-section contained three data packets. For the pre-sampling section, a matrix of chosen packets was then formed with the rows representing the associated packets’ information related to each sub-section. This resulted in a 3
3 traffic matrix (P). This was repeated for the post-sampling section. The general representation of the traffic matrices for pre- and post-sampling section is shown in Eq. (4).𝑇 = 𝑃𝐶 = [ 𝑡1 𝑡2 ⋮ 𝑡𝑛 ] = [ 𝑝11
𝑝21 ⋯
𝑝1𝑛
𝑝2𝑛
⋮ ⋱ ⋮
𝑝𝑛1 ⋯ 𝑝𝑛𝑛
] [ 𝑐1
𝑐2
⋮ 𝑐𝑛
] (4)
The time durations associated with each sub-sections (s1, s2,...sn) were represented
by t1, t2 … tn. These durations were measured by subtracting the arrival time of the last
packet from the arrival time of first packet in the corresponding sub-section. The regression coefficients 𝑐1, 𝑐2, … 𝑐𝑛 were determined by Eq. (5).
The amount of variation in traffic associated with pre- and post- sampling sections was quantified by comparing their respective regression model coefficients using Euclidean distance as shown in Eq. (6).
𝐸𝑢𝑐𝑙𝑖𝑑𝑒𝑎𝑛 𝑑𝑖𝑠𝑡𝑎𝑛𝑐𝑒 =
√(𝑐1𝑝𝑟𝑒− 𝑐1𝑝𝑜𝑠𝑡)2+ (𝑐2𝑝𝑟𝑒− 𝑐2𝑝𝑜𝑠𝑡)2+ ⋯ (𝑐(𝑛)𝑝𝑟𝑒− 𝑐(𝑛)𝑝𝑜𝑠𝑡)2 (6) The fuzzy logic received the current duration value of inter-sampling interval (isi)
[image:7.595.123.470.397.499.2]and the Euclidean distance (ED) and then determined the updated value of isi duration as shown in Figure 6.
Figure 6. Fuzzy system to update isi duration value
The relationship between the inputs, current isi duration and the Euclidean distance with the output (i.e. updated isi duration) was represented by nine rules as shown in Table 1.
Table 1. Rules included in the FIS knowledge base
Rule number Rules
1 If (Euclidean distance is Low) and (isi small) then (output is IL) 2 If ( Euclidean distance is Low) and (isit is medium) then (output is IL) 3 If ( Euclidean distance is Low) and (isi is Large) then (output is NC) 4 If ( Euclidean distance is Medium) and (isi is small) then (output is IL) 5 If ( Euclidean distance is Medium) and ( isi is medium) then (output is NC) 6 If ( Euclidean distance is Medium) and ( isi is Large) then (output is DL) 7 If ( Euclidean distance is High) and ( isi is small) then (output is DL) 8 If ( Euclidean distance is High) and ( isi is medium) then (output is DL) 9 If ( Euclidean distance is High) and ( isi is Large) then (output is DH)
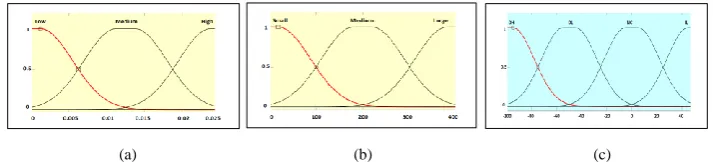
The inputs to the FIS, i.e. Euclidian distance and current inter-sample interval were fuzzuified by three membership functions. The ED was represented Low, Medium and
High fuzzy sets and the current inter-sample interval was represented by Small, Medium and Large fuzzy sets. The output was defizzified by four membership functions, represented as IL (Low Increase), NC (no change), DL (Low Decrease), and
DH (High decrease). These membership functions are shown in Figure 7.
(a) (b) (c)
Figure 7. Membership functions for (a) Euclidean distance (b) sampling interval (c) the updated inter-sampling interval.
Fuzzy inference system (FIS)
Euclidean distance (ED)
Inter-sampling interval (isi)
[image:7.595.119.476.590.671.2]3. Results
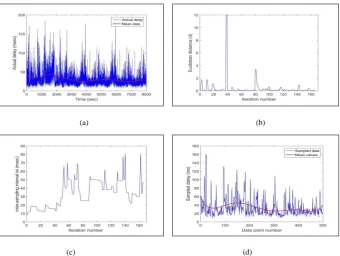
[image:8.595.126.467.319.575.2]The traffic consisting of packets for different applications were captured and their parameters, i.e. delay, jitter and percentage packet loss ratio were determined using Eqs. (1)-(3). The simulation duration was 8000 seconds. The linear regression Eqs. 4 and 5 were used to model the traffic. The Euclidean distance ED shown in Eq. (6) was used to quantify the variation in the behavior of the traffic associated with the pre- and post-sampling sections. The initial value of threshold was chosen as 0.01. Fuzzy inference system's (FIS) output indicated the updated isi duration for each iteration, based on the values of the FIS inputs and the fuzzy rules. Typical results are shown in Figures 8 for the traffic delay. Figures, 8(a) shows the delay for the traffic prior to sampling, (b) represents Euclidean distance, (c) represents the isi duration and (d) represents the traffic delay measure after it is sampled.
Figure 8. Typical results obtained from the developed adaptive technique: (a) original traffic delay (b) measured Euclidean distance (c) FIS output of inter-sampling interval isi duration and (d) sampled of traffic delay
4. Discussion
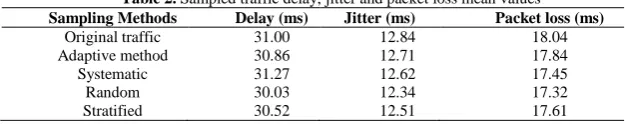
Figure 8 indicates that isi is updated in accordance with the extent of traffic’s delay variation. A larger delay variation caused a decrease in isi duration and vice versa. Similar results were observed for the other two traffic parameters, i.e. jitter and percentage packet loss ratio. Table 2 provides a summary of the averaged delay, jitter and percentage packet loss ratio for the original traffic and those obtained using the
(a) (b)
adaptive. For comparison the averaged delay, jitter and percentage packet loss ratio obtained using the non-adaptive sampling methods of random, stratified and systematic sampling are also shown. The result indicates that the adaptive sampling represents the original traffic more closely than the nom-adaptive sampling methods.
Table 2. Sampled traffic delay, jitter and packet loss mean values
Sampling Methods Delay (ms) Jitter (ms) Packet loss (ms)
Original traffic 31.00 12.84 18.04 Adaptive method 30.86 12.71 17.84 Systematic 31.27 12.62 17.45 Random 30.03 12.34 17.32 Stratified 30.52 12.51 17.61
Currently the sampling is optimised by considering the traffic parameters delay, jitter and percentage packet loss parameters individually. This work is currently being continued so that the FIS can combines the ED and current isi for the three traffic parameter to be used simultaneously to optimise the sample rate based on the overall characteristics of the traffic.
5. Conclusions
A novel adaptive technique that samples computer network traffic has been developed and its performance has compared with the non-adaptive sampling methods of random, stratified and systematic. The developed method adaptively adjusted a section called inter sampling section resulting in an increase in sampling when the traffic variation was greater and vice versus. The developed adaptive sampling represented the original traffic more closely than the non-adaptive sampling.
References
[1]M.J. Field, and J. Grigsby, Telemedicine and remote patient monitoring, JAMA. 288(4) (2002), 423-425. doi:10.1001/jama.288.4.423
[2]M. Suh, C. Chen, J. Woodbridge, M. K. Tu, J. I. Kim, A. Nahapetian, L. S. Evangelista, M. Sarrafzadeh, A remote patient monitoring system for congestive heart failure, Journal of Medical Systems, 35(5)
(2011), 1165-1179.
[3]N. Duffield, Sampling for passive internet measurement: a review, Statistical Science, Institute of Mathematical Statistics 2004, 19(3) (2004), 472–498 DOI 10.1214/088342304000000206.
[4]K. Claffy, G. Polyzos, and H. Braum, Application of sampling methodologies to network traffic characterization, Computer Communication Review, 23(4) (1993), 194 - 203.
[5]R. Serral-Gracià, A. Cabellos-Aparicio, and J. Domingo-Pascual, Network performance assessment using adaptive traffic sampling, A. Das et al. (Eds.): Networking, 2008, LNCS 4982, 252–263. [6]C. Moraga, Introduction to fuzzy logic, Facta Universitatis (NIS), SER: Elec. Energ., 18(2) (2005),
319-328.
[7]A. Dogman, R. Saatchi, S. Al-Khayatt, An adaptive statistical sampling technique for computer network traffic, IEEE Explore, 7th International Symposium on Communication Systems Networks and Digital
Signal Processing (CSNDSP) (2010), 479-483.
[8] A. Dogman, R. Saatchi, S. Al-Khayatt, and H. Nwaizu, Adaptive statistical sampling of VoIP traffic in WLAN and wired networks using fuzzy inference system. 7th International Wireless Communications
![Figure 1 Non adaptive sampling method [4].](https://thumb-us.123doks.com/thumbv2/123dok_us/707650.574372/3.595.205.384.263.365/figure-non-adaptive-sampling-method.webp)