Inter-taxa differences in root uptake
of
103/106
Ru by plants
N.J. Willey
*
, K. Fawcett
Centre for Research in Plant Science, Faculty of Applied Sciences, University of the West of England, Frenchay, Bristol BS16 1QY, UK
Received 9 May 2005; received in revised form 31 August 2005; accepted 5 September 2005 Available online 25 October 2005
Abstract
Ruthenium-106 is of potential radioecological importance but soil-to-plant Transfer Factors for it are available only for few plant species. A Residual Maximum Likelihood (REML) procedure was used to construct a database of relative 103/106Ru concentrations in 114 species of flowering plants including 106 species from experiments and 12 species from the literature (with 4 species in both). An Analysis of Variance (ANOVA), coded using a recent phylogeny for flowering plants, was used to identify a signif-icant phylogenetic effect on relative mean103/106Ru concentrations in flowering plants. There were differ-ences of 2465-fold in the concentration to which plant species took up103/106Ru. Thirty-nine percent of the variance in inter-species differences could be ascribed to the taxonomic level of Order or above. Plants in the Orders Geraniales and Asterales had notably high uptake of103/106Ru compared to other plant groups. Plants on the Commelinoid monocot clades, and especially the Poaceae, had notably low uptake of 103/106
Ru. These data demonstrate that plant species are not independent units for103/106Ru concentrations but are linked through phylogeny. It is concluded that models of soil-to-plant transfer of103/106Ru should assume that; neither soil variables alone affect transfer nor plant species are independent units, and taking account of plant phylogeny might aid predictions of soil-to-plant transfer of103/106Ru, especially for spe-cies for which Transfer Factors are not available.
Ó2005 Elsevier Ltd. All rights reserved.
Keywords:Ruthenium; Soil-to-plant transfer; Phylogeny
* Corresponding author.
E-mail address:[email protected](N.J. Willey).
0265-931X/$ - see front matterÓ2005 Elsevier Ltd. All rights reserved. doi:10.1016/j.jenvrad.2005.09.002
1. Introduction
Ruthenium-106 is a fission product of radioecological importance but there have been rela-tively few comparisons of species differences in its uptake by plants from soil. Differences be-tween plant species can affect soil-to-plant transfer of other radioecologically important isotopes such as137Cs and 90Sr (Nisbet and Woodman, 2000) and might affect soil-to-plant transfer of106Ru. Here we report a database of relative103/106Ru uptake by 114 plant species, by collation of data we generated for 105 species with data in 5 previous studies, and analyse it using techniques established to provide a phylogenetic perspective on inter-species differences in element concentrations.
Ruthenium-103 and106Ru areg-emitters produced in significant quantities by nuclear fis-sion.103Ru has a relatively short half-life (39 d) but 106Ru has a longer half-life (368 d) and is considered a potentially significant long-term radioecological hazard in the ecosystems it contaminates.106Ru was a significant component of nuclear-weapons testing fall-out (Walton, 1963; Ritchie et al., 1970) and it was one of the common radionuclides deposited in the Cher-nobyl 30 km zone (Lux et al., 1995; Krouglov et al., 1998) contributing significantly to external doses to humans (Andersson and Roed, 1994). Despite being deposited primarily in fuel par-ticles which settled close to the Chernobyl reactor (Krouglov et al., 1998),106Ru was detected in significant quantities in Chernobyl fall-out in, for example, Sweden (Kresten and Chyssler, 1989), Italy (Adamo et al., 2004) and Turkey (Polar and Bayu¨lgen, 1991).106Ru is also a con-tributor to effluents from Cap de la Hague (Salbu et al., 2003) and has been a focus of attention in modelling potential accidents with Pressurised Water Reactors (Renaud et al., 1999). Given the potential radioecological importance of106Ru it is important to understand its ecosystem transfer processes, such as that from soil-to-plant.
Many studies, including some of the first radioecological studies performed, have shown that, in general,106Ru is less available to plants from soil than 90Sr but more available than
137
Cs (Nishita et al., 1956, 1961; Bunzl et al., 1984). This is reflected in soil Kdvalues and
soil-to-plant Transfer Factors (TFs) with a mean of 100 and 0.1, respectively (Sheppard, 1985). However,Kdvalues for106Ru in organic soils can be very large (Sheppard and Thibault,
1990) and binding to mobile organic fractions can increase its mobility (Polar and Bayu¨lgen, 1991). Uptake of106Ru by plants is generally greater from soils of high pH and with high base status, for example from the black soils of the Indian Subcontinent (D’Souza and Mistry, 1980). Overall, therefore,106Ru is considered quite available to plants in many soils. Interest-ingly, however, much knowledge of106Ru transfer to plants has been gained using Cl or nitrosyl forms as experimental contaminants but the deposition in the Chernobyl 30 km zone has proved relatively immobile and unavailable due to its deposition in fuel particles, probably as metallic impurities (Krouglov et al., 1998).
Species differences in 106Ru uptake by plants have been reported (Nishita et al., 1961; Handl, 1988) but compared to other radioecologically significant isotopes there is a paucity of comparisons of concentrations to which plants take up106Ru and all such have been confined to inter-species comparisons. Recently, molecular descriptions of the evolutionary relationships (phylogeny) of many groups of organisms have been useful to analyse differences in pheno-types between taxa at many levels of the taxonomic hierarchy. New phylogenies of flowering plants have been published specifically to aid such comparisons (e.g.Soltis et al., 1999). Treat-ing relative elemental concentration as a phenotype and mappTreat-ing it to the flowerTreat-ing plant phy-logeny have revealed significant phylogenetic effects on the relative concentration in plants of
2001), Ca (Broadley et al., 2003) and Mg, K, N, and P (Broadley et al., 2004). These studies reveal that, with the exception of N and P, at least some of the inter-species differences in rel-ative concentration can be ascribed to taxonomic levels higher than the species. This shows that, for concentrations of these elements, species have a tendency to behave as groups rather than each species behaving independently. Such phylogenetic effects not only have to be ac-counted for when predicting soil-to-plant transfer but might also be used as a framework for making general predictions of relative concentrations in plants. Given the paucity of TF data for103/106Ru, a knowledge of relative concentrations for103/106Ru might be useful to radioecol-ogists because, for a given substrate availability, they might be used to make predictions of up-take for substrate/plant species combinations for which TFs are not available. Here, using the method established in previous studies, we report a database of relative mean103/106Ru concen-trations in plants and analyse it using a recent flowering plant phylogeny. We conclude that there is a significant phylogenetic effect on 103/106Ru uptake by plants and discuss its significance.
2. Materials and methods
2.1. Data for103/106Ru uptake by plants
Studies in the literature were selected if they contained measurements of significant concentrations of 103/106
Ru in above-ground green shoots in plants in two or more species after identical exposure in the same contaminated soil. Studies in which foliar contamination had occurred, or in which103/106Ru activ-ities were very low, were excluded and different experimental treatments were used as separate ‘studies’. Both103Ru and106Ru data were included because there is no evidence to suggest discrimination between them during uptake by plants from soil. This provided 9 ‘studies’ (‘studies’ 1e9Table 1) from 5 sources
(Bell et al., 1988; Coughtrey and Jones, 1985; Douka and Xenoulis, 1991; Handley and Babcock, 1972; Wirth et al., 1996) and included data on 12 species. One hundred and six species were chosen for experi-ments to complement those in the literature and provide a spread across the angiosperm phylogeny. Four species in literature data sets (Lolium perenne,Lycopersicon esculentum,Fragaria vesca,Brassica oler-acea) were included in experiments. Species selection was biased in favour of herbaceous plants and crops, tree and aquatic species being more problematic to grow and expose to103/106Ru.
Experiments with a number of radiolabelling regimes based on those previously used (Bell et al., 1988; Coughtrey and Jones, 1985; Douka and Xenoulis, 1991; Handley and Babcock, 1972; Wirth et al., 1996) showed that the procedure below, which includes CaCl2and Na2EDTA to enhance Ru availability, pro-duced high enough 103Ru concentrations to be reliably measured in plant material. Five replicate pots of each species were grown in approximately 90 g of peat-based Levington’s F2 compost (Fison’s, Ips-wich, UK) for approximately 7 weeks. Plants were grown in a randomised block in a greenhouse with 16 h day and 8 h nights at c. 24C and 16C, respectively. Plants were labelled with103Ru in the expo-nential phase of their growth and before they flowered, hence some taxa were slightly younger or older than 7 weeks. During radiolabelling plants were placed in randomised blocks with 350mEmÿ1sÿ1light for 16 h day and 8 h night. For radiolabelling 50 mL of 200mM CaCl2and Na2EDTA were added with 3700 kBq 103RuCl2Lÿ1 to give 41 kBq gÿ1 substrate. The 50 mL of radiolabelled solution saturated the substrate and the excess solution was caught in saucers below the pots and in all cases was reabsorbed into the substrate during radiolabelling, so a homogenous distribution of103Ru in the substrate was as-sumed. Plant shoots were harvested 96 h after103Ru application, 1 cm above the substrate. Radiolabelling took place in 7 events in 14 blocks, each of which was treated as a separate study (‘studies’ 10e23 in
Table 1
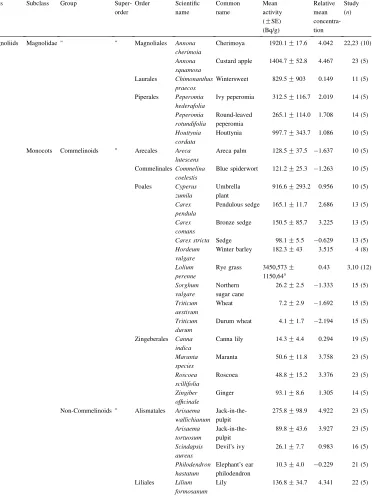
Relative mean Ru concentrations in 114 species of angiosperm classified according to the phylogeny ofSoltis et al. (1999)
Class Subclass Group Super-order Order Scientific name Common name Mean activity (GSE)
(Bq/g) Relative mean concentra-tion Study (n)
Magnoliids Magnolidae " " Magnoliales Annona cherimoia
Cherimoya 1920.1G17.6 4.042 22,23 (10) Annona
squamosa
Custard apple 1404.7G52.8 4.467 23 (5)
Laurales Chimonanthus praecox
Wintersweet 829.5G903 0.149 11 (5)
Piperales Peperomia hederafolia
Ivy peperomia 312.5G116.7 2.019 14 (5) Peperomia
rotundifolia
Round-leaved peperomia
265.1G114.0 1.708 14 (5) Houttynia
cordata
Houttynia 997.7G343.7 1.086 10 (5)
Monocots Commelinoids " Arecales Areca lutescens
Areca palm 128.5G37.5 ÿ1.637 10 (5)
CommelinalesCommelina coelestis
Blue spiderwort 121.2G25.3 ÿ1.263 10 (5)
Poales Cyperus zumila
Umbrella plant
916.6G293.2 0.956 10 (5) Carex
pendula
Pendulous sedge 165.1G11.7 2.686 13 (5) Carex
comans
Bronze sedge 150.5G85.7 3.225 13 (5) Carex stricta Sedge 98.1G5.5 ÿ0.629 13 (5) Hordeum
vulgare
Winter barley 182.3G43 3.515 4 (8) Lolium
perenne
Rye grass 3450,573G
1150,64a
0.43 3,10 (12)
Sorghum vulgare
Northern sugar cane
26.2G2.5 ÿ1.333 15 (5) Triticum
aestivum
Wheat 7.2G2.9 ÿ1.692 15 (5) Triticum
durum
Durum wheat 4.1G1.7 ÿ2.194 15 (5)
Zingeberales Canna indica
Canna lily 14.3G4.4 0.294 19 (5) Maranta
species
Maranta 50.6G11.8 3.758 23 (5) Roscoea
scillifolia
Roscoea 48.8G15.2 3.376 23 (5) Zingiber
officinale
Ginger 93.1G8.6 1.305 14 (5)
Non-Commelinoids " Alismatales Arisaema wallichianum
Jack-in-the-pulpit
275.8G98.9 4.922 23 (5) Arisaema
tortuosum
Jack-in-the-pulpit
89.8G43.6 3.927 23 (5) Scindapsis
aureus
Devil’s ivy 26.1G7.7 0.983 16 (5) Philodendron
hastatum
Elephant’s ear philodendron
10.3G4.0 ÿ0.229 21 (5)
Liliales Lilium formosanum
Group Superorder Order Scientific name Common name Mean activity (GSE)
(Bq/g)
Relative mean concentra-tion
Study (n)
Nemophila menziesii
Californian bluebell
702.2G161.8 3.887 17 (5) Lycopersicon
esculentum
Tomato 33,22,102.8GNA,
NA,24
3.278 5,6,15 (1,1,7)
Nicotiana glauca
Yellow tree tobacco
615.8G239.6 2.557 12,13,15,16 (20) Nicotiana
sylvestris
Tobacco ‘Only the Lonely’
1130.5G220.8 1.93 12 (5) Solanum
sisymbrifolium
Solanum 617.9G76.1 3.592 17 (5)
Euasterid 2 Apiales Angelica hispanica
Angelica 35.6G14.2 2.578 21 (5) Apium
graveolens
Celery 2271.0G812.7 2.429 12 (5) Coriandrum
sativum
Coriander 242.7G36.0 2.634 18 (5) Daucus carota Carrot 99.6G33.6 4.124 4 (13) Hedera helix Ivy 55.7G8.2 0.572 14 (5) Pittosporum
species
Pittosporum 27.8G6.9 2.821 22 (5)
Asterales Centaurea species
Cornflower 393.4G95.4 3.646 16 (5) Helianthus
annuus
Sunflower 1366.6G135.5 3.595 14 (5) Lactuca
sativa
Lettuce 47.9G10.0 2.912 15 (5) Tithonia
rotundifolia
Mexican sunflower
377.2G128.9 3.596 15,17 (10)
Rosids Basal Saxifragales Liquidambar styraciflua
Sweet gum 14.4G3.7 1.045 13 (5) Heuchera
micrantha
Alum-root 140.4G55.3 ÿ2.624 20 (5) Heuchera
sanguinea
Heuchera 36.5G7.7 2.727 21 (5) Bergenia
purpurascens
Bergenia 84.5G16.6 3.886 22,23 (10) Bergenia
cordifolia
Bergenia 103.1G23.9 4.1 22 (5)
Geraniales Geranium pyrenaicum
Pyrenian cranesbill
594.5G158.8 4.097 16 (5) Geranium
sylvaticum
Wood cranesbill
77.9G9.4 3.573 21 (5) Pelargonium
alchemilloid
Ladys Mantle-leaved pelargoniu
363.2G86.1 3.596 16 (5)
Myrtales Callistemon subdulatus
Tonghi bottle-brush
12.2G4.8 0.697 13 (5) Clarkia
bottea
Clarkia 661.6G140.3 3.788 19 (5) Oenothera
hookeri
Giant Yellow evening primrose
481.9G94.8 1.07 12 (5)
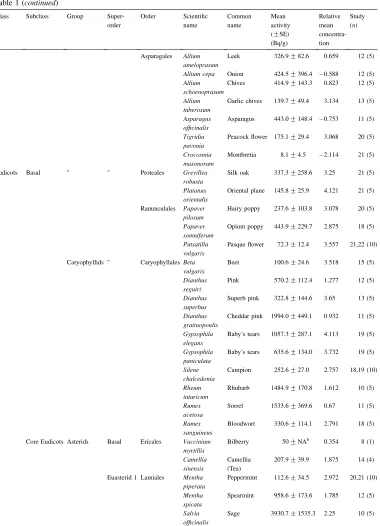
Table 1 (continued)
Class Subclass Group Super-order Order Scientific name Common name Mean activity (GSE)
(Bq/g) Relative mean concentra-tion Study (n)
Asparagales Allium ameloprasum
Leek 326.9G82.6 0.659 12 (5) Allium cepa Onion 424.5G396.4 ÿ0.588 12 (5) Allium
schoenoprasum
Chives 414.9G143.3 0.823 12 (5) Allium
tuberosum
Garlic chives 139.7G49.4 3.134 13 (5) Asparagus
officinalis
Asparagus 443.0G148.4 ÿ0.753 11 (5) Tigridia
pavonia
Peacock flower 175.1G29.4 3.068 20 (5) Crocosmia
masonorum
Montbretia 8.1G4.5 ÿ2.114 21 (5)
Eudicots Basal " " Proteales Grevillea robusta
Silk oak 337.3G258.6 3.25 21 (5) Platanus
orientalis
Oriental plane 145.8G25.9 4.121 21 (5)
Ranunculales Papaver pilosum
Hairy poppy 237.6G103.8 3.078 20 (5) Papaver
somniferum
Opium poppy 443.9G229.7 2.875 18 (5) Putsatilla
vulgaris
Pasque flower 72.3G12.4 3.557 21,22 (10)
Caryophyllids " CaryophyllalesBeta vulgaris
Beet 100.6G24.6 3.518 15 (5) Dianthus
seguiri
Pink 570.2G112.4 1.277 12 (5) Dianthus
superbus
Superb pink 322.8G144.6 3.65 13 (5) Dianthus
gratinopoulis
Cheddar pink 1994.0G449.1 0.932 11 (5) Gypsophila
elegans
Baby’s tears 1057.3G287.1 4.113 19 (5) Gypsophila
paniculata
Baby’s tears 635.6G134.0 3.732 19 (5) Silene
chalcedonia
Campion 252.6G27.0 2.757 18,19 (10) Rheum
tataricum
Rhubarb 1484.9G170.8 1.612 10 (5) Rumex
acetosa
Sorrel 1533.6G369.6 0.67 11 (5) Rumex
sanguineus
Bloodwort 330.6G114.1 2.791 18 (5)
Core Eudicots Asterids Basal Ericales Vaccinium myrtillis
Bilberry 50GNAb 0.354 8 (1) Camellia
sinensis
Camellia (Tea)
207.9G39.9 1.875 14 (4)
Euasterid 1 Lamiales Mentha piperata
Peppermint 112.6G34.5 2.972 20,21 (10) Mentha
spicata
Spearmint 958.6G173.6 1.785 12 (5) Salvia
officinalis
[image:6.468.45.425.87.613.2]Group Superorder Order Scientific name Common name Mean activity (GSE)
(Bq/g)
Relative mean concentra-tion
Study (n)
Oenothera tetragona
Evening primrose’ Sundrops’
279.9G97.4 0.429 12 (5)
Eurosid 1 Malpighiales Hypericum olympicum
Dwarf St. John’s Wort
90.1G13.4 3.165 13 (5) Passiflora
caerulescens
Passion flower
53.3G5.6 3.538 22 (5)
Rosales Humulus japonicus
Japanese hop
81.1G27.1 3.24 15 (5) Elaeagnus
multiflora
Elaeagnus 25.7G1.7 1.701 13 (5) Morus alba White mulberry 312.7G86.3 0.612 12 (5) Maclura
pomifera
Osage orange 53.8G13.2 2.23 13 (5)
Fragaria vesca
Strawberry 20,80,50,2243GNA,529b 1.585 7,8,
9,10,11,12 (17)
Rubus idaeus Blackberry 20GNAb 0.242 9 (1) Rubus saxitilus Blackberry 20,20GNAb 0.105 7,8 (1,1) Pilea cadierei Pilea 430.9G98.5 2.548 14 (5)
Fabales Lupinus angustifolius
Lupin 8212.5G2778.4 3.162 10 (5) Medicago
lupulina
Black Medik 173.9G79.1 3.269 13 (5) Medicago
sativa
Lucerne 533G36a ÿ0.009 3 (1) Phaseolus
vulgaris
Bean 52,11GNA 3.197 5,6 (1) Pisum
sativum
Pea 45.8G14.5 0.42 12 (2) Trifolium
pratense
Red clover 595.5G68.2 3.539 17,18 (10) Trifolium
repens
White clover 507.1G119.5 3.713 19,20 (10) Trifolium arvense Hare’s foot
clover
744.0G260.6 1.347 12 (5)
Curcurbitales Curcurbita maxima
Pumpkin ‘Blue Hubbard’
2693.8G470.6 4.437 14 (5) Curcurbita
pepo
Pumpkin 3311.5G530.1 4.647 14 (5)
Eurosid 2 Brassicales Alyssum montanum
Alyssum 1720.2G392.5 0.729 11 (5) Alyssum
saxatile
Alyssum 80.5G16.4 1.682 19 (5) Alyssum
petraeum
Alyssum 2467.0G655.3 2.596 12 (5) Brassica
oleracea
Cabbage 6.9,22.1,316.1G
4.1,4,49.8
3.139 1,2,4,17,20 (4,12,14)
Tropaeolum perigrinum
Canary creeper 131.7G39.3 3.76 15 (5)
2.2. Statistical analyses
Data were obtained, from the literature and experiments, for 114 species across 23 ‘studies’. Due to species selection, and replication between blocks, every data set had at least one species in common with another data set. Some species were represented multiple times in the data sets whilst others were present only once. Residual Maximum Likelihood (REML) analysis was used to produce a database of relative mean103/106Ru concentrations in the 114 plant species. Studies were used as ‘blocks’ and species as ‘treatments’ in the REML analysis which was run on the statistical software package Genstat for Win-dows 5th Ed release 4.2 (VSN International, Oxford, UK) (Thompson and Welham, 2001) using the pro-gramme ofBroadley et al. (1999, 2001, 2003, 2004). Defining blocks and treatments in this way takes account of the absolute differences in concentrations related to experimental conditions (studies) to reveal relative mean concentrations for the treatments (species). REML analyses, which here included loge -trans-formation of raw values, can produce relative mean concentrations that are both positive and negative (Thompson and Welham, 2001). An ANOVA of REML-transformed values, coded using the ordinal phy-logeny ofSoltis et al. (1999)was then performed. The ordinal phylogeny ofSoltis et al. (1999)was used because it was published specifically for such analyses and to enable direct comparison of Ru results with previous analyses for other elements that used this phylogeny. The categories ‘Class’, ‘Subclass’, ‘Group’ and ‘Superorder’ (Table 1) were used nominally above the level of the Order because the relationship be-tween the Linnaean hierarchy they are derived from and higher taxonomic groups on recent phylogenies is unresolved. Normality tests used a KolmogoroveSmirnov test in SigmaStat 3.0 for Windows.
3. Results and discussion
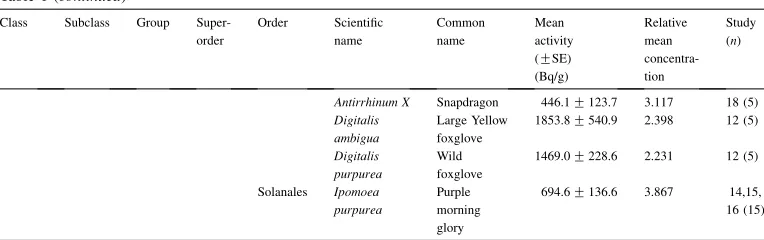
The relative mean103/106Ru concentrations in 114 plant species, together with absolute val-ues from each experimental study, are shown inTable 1. The REML procedure accounts for variance in absolute concentrations associated with different experimental conditions (‘stud-ies’) in the input data in order to estimate relative mean concentrations for plant species across Table 1 (continued)
Class Subclass Group Super-order
Order Scientific name
Common name
Mean activity (GSE)
(Bq/g)
Relative mean concentra-tion
Study (n)
Antirrhinum X Snapdragon 446.1G123.7 3.117 18 (5) Digitalis
ambigua
Large Yellow foxglove
1853.8G540.9 2.398 12 (5) Digitalis
purpurea
Wild foxglove
1469.0G228.6 2.231 12 (5)
Solanales Ipomoea purpurea
Purple morning glory
694.6G136.6 3.867 14,15,
16 (15)
Studies 1e2:Bell et al., 1988, seasons 1 + 2, sandy loam soil UK, plants grown to maturity; study 3:Douka and Xenoulis, 1991; mean of harvests 2e4, clay soil pH 8 Greece with 339 Bq kgÿ1 106Ru, mean of shoots. Study 4: Coughtrey and Jones, 1985, brown sand Freckenham series, 0.29mCi103
Ru/5 kg pot, mean of shoots. Studies 5e6 Handley and Babcock, 1972, hydroponics Hoagland’s solution, 38.4mCi/4 L, mean of three plants, new growth and old growth. Studies 7e9:Wirth et al., 1996, collected at 3 sites in Bavaria in 1992, TForg. Studies 10e23 experiments
for this paper.nZNumber of replicate measurements. Mean activities in plants from studies carried out for this paper also listed.
[image:8.468.40.422.72.192.2]all studies. There were significant effects of block in the analysis confirming that values for all these species could not be compared without taking it into account. The values inTable 1 can-not, therefore, be regarded as concentration ratios or TFs for plant species under a given set of conditions but rather they are predicted relative mean concentrations across a variety of condi-tions, i.e. which species tend to have, relative to each other, higher or lower concentrations. There are, however, a number of factors that might interact under a particular set of conditions to produce relative concentrations somewhat different to those inTable 1. First, the length of exposure to103/106Ru in almost all the data sets collated was acute. The relationship between concentrations produced in plants after acute and chronic exposure to103/106Ru from the soil is little known. For other radionuclides, such as90Sr and137Cs, there is evidence that much up-take up-takes place during the exponential phase of growth (Weaver et al., 1981), as is the case with many mineral nutrients (Marschner, 1995). As majority of the species inTable 1 were
Fig. 1. The frequency distribution of relative mean Ru concentrations in 114 species of angiosperm (Kolmogorove
Smirnov distribution 0.11,P!0.001).
Group Superorder Order Scientific name
Common name
Mean activity (GSE)
(Bq/g)
Relative mean concentra-tion
Study (n)
Malvales Cistus palhinhae
St. Vincent Cistus
68.8G26.1 2.361 13 (5) Althaea rosea Hollyhock 5054.1G701.7 1.93 11 (5) Malva
sylvestris
Common mallow 6570.0G421.1 5.191 16 (5)
Sapindales Pistachia chinensis
exposed during their exponential growth phase, it seems likely that the relative mean concen-trations inTable 1will relate to chronic exposures, but it is possible that this relationship is not close. Further, for106Ru, as for other radioisotopes, the chemical species present in soil can affect its behaviour (Krouglov et al., 1998). It is possible that different compounds of
103/106Ru might not produce the same relative concentrations as those inTable 1. In fact, it
is possible that a number of such edaphic factors might interact with relative103/106Ru concen-trations because all species cannot grow equally well under different conditions. There is vari-ety in103/106Ru compound and experimental conditions used to generate data forTable 1, which therefore provides relative mean concentrations across them, but the full range of exposure con-ditions might not produce results identical to those inTable 1. Overall,Table 1does not, there-fore, provide definitive relative mean concentrations between plant species. However, as the largest inter-species comparison of uptake of103/106Ru by plants is yet to be reported,Table 1 does provide an estimate of the relative mean concentrations for a wide variety of plants and a starting point for analysing them phylogenetically.
Loge-transformed relative mean103/106Ru concentrations ranged fromÿ2.62 to 5.19 across
the 114 species in the database (Table 1), indicating that absolute concentrations might differ by more than 2000 fold (e7.81Z2465) if all species could be grown simultaneously under the
same conditions. In experimental data derived under a single set of conditions (studies 10e
[image:10.468.40.427.97.221.2]23) the lowest103/106Ru concentration was 4.1 Bq gÿ1inTriticum durumand the highest con-centration was 6570 Bq gÿ1inMalva sylvestris, roughly agreeing with this estimate.103/106Ru REML values were not normally distributed but significantly skewed (Fig. 1) and there were no significant outliers that could be removed to produce normality. Overall, these results suggest Table 2
Results of ANOVA for relative mean Ru concentrations in 114 angiosperm species classified according toSoltis et al. (1999)
df Sum of
Squares
% Sum of Squares
Cumulative % Sum of Squares
Mean square Variance ratio
Class 2 3816 4.2 4.2 1272 4.46
Subclass 3 226 0.2 13.3 113 0.4
Group 4 8153 8.9 13.1 2038 7.15
Superorder 4 1881 2.1 15.4 470 1.65
Order 14 21 775 23.7 39.1 1555 5.45
Family 22 10 168 11.1 50.2 462 1.62
Genus 36 37 697 41.1 91.3 1047 3.67
Residual 28 7987 8.7 100.0 285
Total 113 91 706
that there is a significant range of relative mean103/106Ru concentrations between plant species and that this range, and its frequency distribution, might usefully be considered in soil-to-plant transfer involving multiple plant species.
There were statistically significant effects of phylogeny on103/106Ru concentrations in plants at the level of the ‘Class’, ‘Group’, Order and Genus (Table 2). Overall, 39% of the Sums of Squares was associated with the level of Order and above, and Genus was associated with the greatest % Sum of Squares. Between the plants categorized here by ‘Class’, the Magnoliids (nZ33 species) had significantly lower relative mean Ru concentrations than the Eudicots
(nZ81) (Tables 1 and 2;Fig. 2A). Significant differences at the ‘Group’ level were marked
by relative mean Ru concentrations that were significantly lower in Commelinoid monocots than most other groups (Tables 1 and 2;Fig. 2B). At the Ordinal level the Cucurbitales and Magnoliales had the highest relative mean concentrations but were both only represented by two species (Table 1;Fig. 2C). Of the orders with greater numbers of representatives, the Ger-aniales (nZ3) and Asterales (nZ4) had the highest, and the Poales (nZ9) the lowest
rela-tive mean Ru concentrations. The Apiales, Caryophyllales, Lamiales and Fabales had, despite some high or low values for individual species, relative mean Ru concentrations close to the overall mean (2.19). Relative mean concentrations for these higher taxa do not necessarily en-sure that all species within them have low or high values but rather there are significant tenden-cies to low or high values. In comparison to other studies of ion concentrations in plants down to the Ordinal level, the phylogenetic signal for Ru of 39% is greater than that for P (6.8%) and N (3.3%) (Broadley et al., 2004), Cs (15%) (Willey et al., 2005), Pb (20%), Cr (23%), Cu (24%), and Cd (27%) (Broadley et al., 2001), and Na (23%) (Broadley et al., 2004), but less than that for Zn (44%), Ni (46%) (Broadley et al., 2001), K (49%) (Broadley et al., 2004) and Ca (63%) (Broadley et al., 2003).
The Commelinoid monocots have been noted to have unusually low Ca uptake (Broadley et al., 2003) and the monocots are known to have low uptake of Cs (Broadley and Willey, 1999; Willey et al., 2005), so it seems likely that the relatively low uptake of Ru reported here is part of a pattern of unusual uptake of at least some elements by plants on this clade. Certainly, given the importance of the cereals crops on this clade it is a hypothesis worth further investigation. The few relative mean Ru concentrations for the Cucurbitales and Brassicales in Table 1suggest that these orders might have relatively high and low uptake of Ru, respectively. There are indications that for other elements these Orders also have characteristic uptake (Broadley et al., 2003, 2004) and we suggest that it might be worthwhile investigating further their uptake of Ru. The Caryophyllales have high relative uptake of Cs (Broadley and Willey, 1999;Willey et al., 2005) but the data reported here suggest that they are not unusual in their Ru uptake.
4. Conclusion
There are significant differences between plant species in the concentration to which they take up acute doses of 103/106Ru. Clearly, there are soil factors that affect soil availability of
103/106
between species (which is primarily a reproductive unit that can be difficult to define in plants) and the data presented here strongly suggest that radioecologists should consider taxonomic units other than the species when modelling soil-to-plant transfer of 103/106Ru. Overall, for
103/106Ru uptake species do not behave independently but are affected by phylogenetic position.
This has enabled us to suggest testable hypotheses about which taxonomic units of plants have relatively high and low uptake of Ru and to make general predictions of uptake for taxa in which few TF values exist.
Acknowledgement
We would like to acknowledge the financial support of the UK Food Standards Agency, and to thank Judy Brown for radioanalytical support and Andrew Mead of Warwick HRI for devel-oping the Genstat programme.
References
Adamo, P., Arienzo, M., Pugliese, M., Roca, V., Violante, P., 2004. Accumulation history of radionuclides in the lichen Stereocaulon vesuvianumfrom Mt. Vesuvius (south Italy). Environ. Pollut. 127, 455e461.
Andersson, K.G., Roed, J., 1994. The behaviour of Chernobyl137Cs,134Cs and106Ru in undisturbed soileimplications
for external radiation. J. Environ. Radioact. 22, 183e196.
Bell, J.N.B., Minski, M.J., Grogan, H.A., 1988. Plant uptake of radionuclides. Soil Use Manage 4, 76e84.
Broadley, M.R., Willey, N.J., 1999. A comparison of caesium uptake by 30 plant species. Environ. Poll. 97, 11e15.
Broadley, M.R., Willey, N.J., Mead, A., 1999. A method to assess taxonomic variation in shoot caesium concentration among flowering plants. Environ. Pollut. 106, 341e349.
Broadley, M.R., Willey, N.J., Wilkins, J., Baker, A.J.M., Mead, A., White, P.J., 2001. Phylogenetic variation in heavy metal accumulation in angiosperms. New Phytol. 152, 9e27.
Broadley, M.R., Bowen, H.C., Cotterill, H.L., Hammond, J.P., Meacham, M.C., Mead, A., White, P.J., 2003. Variation in the shoot calcium content of angiosperms. J. Exp. Bot. 54, 1e16.
Broadley, M.R., Bowen, H.C., Cotterill, H.L., Hammond, J.P., Meacham, M.C., Mead, A., White, P.J., 2004. Phyloge-netic variation in the shoot mineral concentration of angiosperms. J. Exp. Bot. 55, 321e336.
Bunzl, K., Bachhu¨ber, H., Schimmack, W., 1984. Distribution co-efficients of137Cs,85Sr,141Ce,103Ru,131I and95mTc in the various horizons of cultivated soils in Germany. In: Udulft, P., Mekel, B., Prosl, K.M. (Eds.), Proceedings of International Symposium on Recent Investigations in the Zone of Aeration. pp. 567e577.
Coughtrey, P.J., Jones, A., 1985. Experimental Studies on the Dynamics of Radionuclide Transport in Soils and Plants: An Investigation of the Effects of Chemical Form and Time of Administration. Associated Nuclear Services, UK, Report No. 413.
D’Souza, T.J., Mistry, K.B., 1980. Behaviour of gamma-emitting fission products106Ru,125Sb,134Cs and144Ce depos-ited on established pastures in tropical environs. J. Nuc. Agric. Biol. 9, 50e53.
Douka, C.E., Xenoulis, A.C., 1991. Radioactive isotope uptake in a grass/legume association. Environ. Pollut. 73, 11e23.
Handl, J., 1988. Transfer from soil to plants of106Ru as nitrosyl and as chloride. Health Phys. 28, 548e555.
Handley, R., Babcock, K.L., 1972. Translocation of85Sr,137Cs and106Ru in crop plants. Radiat. Bot. 12, 113e119.
Kresten, P., Chyssler, J., 1989. The Chernobyl fallout: surface soil deposition in Sweden. Geol. Foren. Stockh. Forh. 111, 181e185.
Krouglov, S.V., Kurinov, A.A., Alexhakin, R.M., 1998. Chemical fractionation of90Sr,106Ru,137Cs and144Ce in Cher-nobyl-contaminated soils: an evolution in the course of time. J. Environ. Radioact. 38, 59e76.
Lux, D., Kammerer, L., Ruhm, W., Wirth, E., 1995. Cycling of Pu, Sr, Cs and other long-living radionuclides in forest ecosystems of the 30 km zone around Chernobyl. Sci. Total Environ. 173, 375e384.
Marschner, H., 1995. The Mineral Nutrition of Plants, second ed. Academic Press, London.
Nishita, H., Kowalewsky, B.W., Steen, A.J., Larson, K.H., 1956. Fixation and extractability of fission products contam-inating various soils and clays: I90Sr,91Y,106Ru,137Cs,144Ce. Soil Sci. 81, 317
e326.
Nishita, H., Romney, E.M., Larson, K.H., 1961. Uptake of radioactive fission products by crop plants. J. Agric. Food Chem. 9, 101e106.
Polar, E., Bayu¨lgen, N., 1991. Differences in the availabilities of134/137Cs and106Ru from a Chernobyl-contaminated soil to a water plant, duckweed, and to the terrestrial plants bean and lettuce. J. Environ. Radioact. 13, 251e259.
Renaud, P., Re´al, J., Maubert, H., Roussel-Debet, S., 1999. Dynamic modelling of the cesium, strontium and ruthenium transfer to grass and vegetables. Health Phys. 76, 495e501.
Ritchie, J.C., Clebsch, E.E.C., Rudolph, W.K., 1970. Distribution of fallout and natural gamma radionuclides in litter, humus and surface mineral soil layers under natural vegetation in the Great Smoky Mountains, North Carolinae
Tennessee. Health Phys. 18, 479e489.
Salbu, B., Skipperud, L., Germain, P., Guegueniat, P., Strand, P., Lind, O.C., Christensen, G., 2003. Radionuclide spe-ciation in effluent from La Hague reprocessing plant in France. Health Phys. 85, 311e322.
Sheppard, M.I., 1985. Radionuclide partitioning coefficients in soils and plants and their correlation. Health Phys. 49, 106e111.
Sheppard, M.I., Thibault, D.H., 1990. Default soil solid/liquid partition coefficients,Kds, for four major soil types: a compendium. Health Phys. 59, 471e482.
Soltis, P.S., Soltis, D.E., Chase, M.W., 1999. Angiosperm phylogeny inferred from multiple genes as a research tool for comparative biology. Nature 402, 402e404.
Thompson, R., Welham, S.J., 2001. REML analysis of mixed models. In: Payne, R.W. (Ed.), The Guide to Genstat-Part 2. Statistics. VSN International, Oxford, UK, pp. 413e503.
Walton, A., 1963. The distribution in soils of radioactivity from weapons tests. J. Geophys. Res. 68, 1485e1496.
Weaver, C.M., Harris, N.D., Fox, L.R., 1981. Accumulation of strontium and caesium by kale as a function of plant age. J. Environ. Qual. 10, 95e98.
Willey, N.J., Tang, S., Watt, N., 2005. Predicting inter-taxa differences in plant uptake of134/137Cs. J. Environ. Qual. 34, 1478e1489.
Wirth, E., Kammerer, L., Ruehm, W., Steiner, M., Hiersche, L., Krestel, R., Mamikhin, S., Tsvetnova, T., Kuchma, K., 1996. Uptake of radionuclides by understorey vegetation and mushrooms. In: Belli, M., Tikhomirov, F. (Eds.), Be-haviour of Radionuclides in Natural and Semi-natural Environments. European Commission, Brussels, pp. 61e79.