8-1962
Precise measurement of the K-shell internal
conversion coefficient of the 344-kev, E2 transition
in Gd152
Guy Schupp Iowa State University E. N. Hatch Iowa State University
Follow this and additional works at:http://lib.dr.iastate.edu/ameslab_isreports Part of theNuclear Engineering Commons
This Report is brought to you for free and open access by the Ames Laboratory at Iowa State University Digital Repository. It has been accepted for inclusion in Ames Laboratory Technical Reports by an authorized administrator of Iowa State University Digital Repository. For more information, please [email protected].
Recommended Citation
Schupp, Guy and Hatch, E. N., "Precise measurement of the K-shell internal conversion coefficient of the 344-kev, E2 transition in Gd152" (1962).Ames Laboratory Technical Reports. 48.
344-kev, E2 transition in Gd152
Abstract
A value of 0. 0283 ± 0. 0008 was obtained for the K- shell internal conversion coefficient, aK, of the 344-kev, E2 transition in Gd152using an electron-electron coincidence method. This value is relative to a value of 1.135 ± 0. 010 for the total internal conversion coefficient, a, of the 122-kev, E2 transition in Sm152. a.K/a ratios of 0. 786 ± 0. 004 and 0. 589 ± 0. 003 were measured for the 344- and 122-kev transitions, respectively. The apparent 9% discrepancy with theory for aKof the 344-kev transition is not explained. The result is in
excellent agreement with another measurement and also in agreement with an apparent lower trend for aK's of E2 transitions in near spherical nuclei. The aKvalue for the 122-kev transition is in good agreement with theory. Additional measurements were performed on the 123- and 87-kev, E2 transitions in Gd154and Dy160, respectively, and aK/a ratios of 0. 531 ± 0. 007 and 0. 341 ± 0. 011 were obtained. Construction and
performance of the beta-ray spectrometers used in these coincidence measurements are described along with limitations of the experimental technique.
Disciplines
Nuclear Engineering
IOWA STATE UNIVERSITY
PRECISE MEASUREMENT OF THE K-SHELL INTERNAL CONVERSION COEFFICIENT OF THE 344-KEV,
E2 TRANSITION IN GdlSZ by
Guy Schupp and E. N. Hatch
RESEARCH AND
DEVELOPMENT
REPORT
U.S.A.E.C.
•
,,
TID-4500(24 th Ed.), October 1, 1963
UNITED STATES ATOMIC ENERGY COMMISSION Research and Development Report
PRECISE MEASUREMENT OF THE K-SHELL INTERNAL CONVERSION
COEFFICIENT OF THE 344-KEV, E2 TRANSITION IN Gd152
by
Guy Schupp and E. N. Hatch
August, 1962
Ames Laboratory
at
Iowa State University of Science and Technology F. H. Spedding, Director
IS-590
This report is distributed according to the category Physics (UC-34) as listed in TID-4500 (24th Ed.), October l, 1963.
Legal Notice
This report was prepared as an account of Government sponsored work. Neither the United States, nor the Commission, nor any person acting on behalf of the Commission:
A. Makes any warranty or representation, expressed or im-plied, with respect to the accuracy, completeness, or usefulness of the information contained in this report, or that the use of any information, apparatus, method, or process disclosed in this report may not infringe pri-vately owned rights; or
B. Assumes any liabilities with respect to the use of, or for damages resulting from the use of any information, appa-ratus, method, or process disclosed in this report.
As used in the above, "person acting on behalf of the Commission" includes any employee or contractor of the Commission, or employee of such contractor, to the extent that such employee or contractor of the Commission, or employee of such contractor prepares, dissemi-nates, or provides access to, any information pursuant to his employ-ment or contract with the Commission, or his employemploy-ment with such contraetor.
Printed in USA. Price $ 2. 25 Available from the Office of Technical Services U. S. Department of Commerce Washington 25, D. C.
TABLE OF CONTENTS
Page
ABSTRACT . . . v
I. INTRODUCTION . . . . . . . . . . . . . . . . . . . . . . . . . . . 1
II. SURVEY OF THEORY.. .. . .. .. . .. .. .. .. .. .. .. . .. .. .. .. . 9
III. SURVEY OF EXPERIMENTAL METHODS. . . . . . . . . . . . 18
IV. EXPERIMENTAL INVESTIGATION . . . 24
A. Construction of Coincidence Spectrometer . . . 24
B. Measurement of the K-Shell Internal Conversion Coefficient of the 344-kev, E2 Transition in Gdl52 . . . 34
V. RESULTS AND DISCUSSION . . . • . . . • . • . . . 56
VI. CONCLUSION . . . 64
VII. REFERENCES . . . • . • . . . 65
VIII. APPENDIX A: SOLID ANGLE MEASUREMENTS . . . 70
IX. APPENDIX B: ANGULAR CORRELATION FACTORS . . . 76
X. APPENDIX C: INTERNAL CONVERSION MEASUREMENTS IN Gdl54 AND Dyl60 . . . 82
A. Measurements in Gd154 . . . 82
IS-590
PRECISE MEASUREMENT OF THE K-SHELL INTERNAL CONVERSION COEFFICIENT OF
THE 344-KEV, E2 TRANSITION IN Gd152
*
Guy Schupp and E. N. HatchABSTRACT
A value of 0. 0283 ± 0. 0008 was obtained for the K- shell internal conversion coefficient, aK' of the 344-kev, E2 transition in Gd152 using an electron-electron coincidence method. This value is relative to a value of 1.135 ± 0. 010 for the total internal conversion coefficient, a, of the 122-kev, E2 transition in Sm152 . a.Kja ratios of 0. 786 ± 0. 004 and 0. 589 ± 0. 003 were measured for the 344- and 122-kev transitions, respectively. The apparent 9o/o discrepancy with theory for aK of the 344-kev transition is not explained. The result is in excellent agree-ment with another measureagree-ment and also in agreement with an apparent lower trend for ~ 1 s of E2 transitions in near spherical nuclei. The aK value for the 122-kev transition is in good agreement with theory. Additional measurements were performed on the 123- and 87-kev, E2 transitions in Gd154 and
n/
60 , respect_ively, and aKja ratios of 0. 531 ± 0. 007 and 0. 341 ± 0. 011 were obtained. Construction and per-formance of the beta-ray spectrometers used in these coincidence measurements are described along with limitations of the experimental technique.~~This report is based on a Ph. D. thesis by Guy Schupp submitted
One or the processes b7 which an excited nucleps can
make a transition to a lower energy level is bf internal
conversion. In this process, one or the orbital electrons is ejected from the atom with an energy equal to the nuclear
transition energy minus the binding energy or the electron.
A usual competing process with the internal conversion mode
ot de-excitation is gamma-ray emission. For a given
transition, the ratio or the number or internal conversion
electrons ejected per second to the number or gamma rays
emitted per second is the internal conversion coefficient. The measurement or these coefficients has long been a tool in
nuclear spectroscopy tor determining the angular momentum and
parity changes in nuclear transitions. A short historical
account of internal conversion investigations is given below.
The first internal conversion coefficient measurement was performed by Gurney (1) in 1925 on the.RaB (Pb214) and
HaC (Bi 214> decays. He estimated, from the areas or the
peaks and beta spectrum, that the probability of a RaB gamma ray being converted into a •beta ray• was 1 in
7.
Homogeneous or internal conversion electrons were first observed, however,by Baeyer §1 ~· (2) in 1911, and by the early twenties the
energy differences between the electrons ejected from the K,
explained b7 the Bohr model or the atom. Closel7 following
the more rertned measurements or internal conversion electrons
by Ellis and Wooster (3) in 1927, Swirles (4) presented the
first theorr or internal conversion. She considered the
nucleus to be a radiating dipole and calculated the
probabil-ity or absorption in the K shell using hydrogen-like
electronic wave functions in a non-relativistic formulation.
These theoretical values were approximately 1/10 or the
experimental values and this first discrepancy between theory
and experiment was thought to be due to a neglect or the
screening by the other electrons.
In 1930 studies were again made on the internal
conversion lines in the electron spectrum or the RaB and RaC
decays. Ellis and Aston (S) used a photoelectric method in
this investigation to determine the gamma-ray intensities
relative to the internal conversion electrons and obtained
absolute internal conversion coefficients to an accuracy or
about 30%. They pointed out the striking dependence or the
coefficients on the gamma-ray energy as measured tor the two
nuclides. The RaB internal conversion coefficients decreased
by a factor or 3 as the energy increased by only a factor or
1.5,
whereas for the transitions in the RaC decay no steadyvariation was seen in the internal conversion coefficients
as the energies varied over a factor or
3·
This dependence,'
but not tor Rae, was thought to show the ettect ot nuclear
structure on the internal conversion process.
Casimir (6) made the first relativistic calculation
tor internal conversion coefficients or high energy, electric .
dipole transitions, and in 1932 Hulme (7) extended these
.
calculations to energies less than the electronic mass and
round agreement within 25% or experiment tor three or the
nine RaC transitions. In conjunction with the work or Hulme
(7), Taylor and Mott (8) calculated internal conversion
coefficients tor electric quadrupole transitions and obtained
similar agreement tor the remaining RaC lines excepting the
1.42-Mev,
o+ - o+
transition. These calculations were stillas much as 40% lower than the experimental values tor the
transitions following the BaB decay.
The next major contribution was a conceptual change
in the theoretical formulation or the internal conversion
process. Following their earlier work, Taylor and Mott (9)
in 1933 re-examined the basic assumptions underlying the
theoretical calculations and pointed out that the internal
conversion process was really independent or gamma-ray
emis-sion in contrast to the concept or the gamma ray always
leaving the nucleus and then sometimes interacting with an
orbital electron. With this new description, the present
definition or the internal conversion coerticient emerged as
intuitiYe ratio or internal conversion electron transition
probabilit7 to the total transition probabilit7 as used
preyiousl7• The two-step t7pe process had been questioned
earlier b7 Smekal (10) and it was not until 1953 that
Bainbridge ~
11·
(11) showed experimentally the independentnature or the internal conversi.on and gamma-ray processes in their study or Tc99m. The theoretical activity of the early
thirties in internal conversion was completed b7 Pisk and
Taylor (12) when they calculated .conversion coefficients tor
magnetic dipole, quadrupole and ootopole transitions. The
agreement between theory and experiment at this time was
considered good since nearly all the experimental values
could be explained by a linear combination of the appropriate
electric and magnetic multipoles. These theoretical results
were completely relativistic but were restricted to the K
shell and to a limited energy range. The most serious
restriction or the results, however, in light or later
usefulness was that they were only given for Z values of 83
and 84.
With the discovery or artificial radioactivity in
1934 b7 Curie and Joliot (13) came the eventual need tor
more calculations or internal conversion coefficients.
Because or the laborious nature or the calculations, various
approximate methods were used before Rose ~
Al·
(14) beganresults to a wide range or
z
values and or transition energy.At the same time the extension was made to the first rive
electric and first five magnetic multipolea. The model tor
these first computer calculations was the same as had been
used earlier (9,12). Follow~ng the K-shell calculations, a
program was initiated by Rose to calculate internal conversion
coefficients for the three L subshells. With the L-shell
results a consideration of the more easily measured K/L and
L-&ubshell ratios helped specify nuclear transitions. These
L-shell calculations were first made without considering
screening effects, but after the work of Reitz (15) in 1950
these effects were treated in a much more involved program
which was not completed until 1956. Part of these later
calculations were published in 1955 (16).
Until around 1950 and later the correctness of the
theoretical results was really not questioned since the spin
and parity changes of nuclear transitions were not commonly
measured by other methods. As angular correlation experiments
and other techniques were developed for deciphering decay
schemes, the accuracy of the internal conversion coefficient
calculations began to be checked experimentally. Before any
significant discrepancies were found between exp~riment and the theoretical values or Rose ~ ~· (14), it was pointed
become an important factor. His subsequent calculations
included nuclear surface currents as well as finite-size
effects. The results of the calculations by SliT and Band
(18) using this new model showed that the K-shell internal
conversion coefficients for magnetic dipole transitions in
nuclei with
z
> 80 were on the order of 40% smaller thanthe point-nucleus values of Rose ~
Al·
(14). The finitenuclear size calculations were substantiated by Wapstra and
Nijgh (19) when they measured the internal conversion
coefficient of the 279-keT transition in the decay of Hg2
03.
The method employed in this experiment was essentially the
same as that used by Gurney (1) in the very first
measure-ments of internal conversion coefficients. Many improvements
in experimental techniques as well as a simple decay scheme
enabled an accuracy of
3%
to be obtained.The last major development in the study of internal
conversion effects came in 1956 when Church and Weneser (20)
suggested that anomalous, model-dependent conversion
coefficients may occur for retarded magnetic dipole
transitions if one takes into account the distribution of
currents throughout the nuclear volume. The term anomalous
is used for these effects because they are direct consequences
of the dynamical effects of nuclear structure as opposed to
statio effects due simply to a finite nuclear charge
de-excitation, which tinall7 explained the results obtained tor
the
o+ - o+
transition in HaC mentioned earlier, occurs onlythrough nuclear penetration etfeots. A theory or the
anomalous terms in the internal conversion process tor
electric dipole transitions was presented by Nilsson and
Rasmussen (21} in 1958.
Perhaps the most logical direction tor the
experimen-tal investigations ot internal conversion coefficients to
take would be toward finding and measuring the penetration
effects. Measurements of this type have been done by Asaro
~
!l•
(22} and Gerholm ~Al·
(23}. On the other hand,since it is onl7 by comparison with tabulated values or
conversion coefficients that the additional penetration
effects ean be estimated, it is necessary to maka comparisons
between tabulated and accurately measured coefficients tor
transitions where penetration effects are expected to be
small as was pointed out by Church and Weneser (24}. The
2+ -
o+,
pure electric quadrupole transitions found in alarge number or even-even nuclei represent such a class or
transitions. The agreement between experiment and theory tor
this type or transition in the deformed nuclei region (150 <
A < 190} is less than satisfactory although most or the
•
measurements have experimental errors which are greater than
10%. With the available data, efforts have been made by
correlate the apparent discrepancies between theory and
experiment with the nuclear deformation.
The present investigation is concerned with accurate
I
internal conversion coefficient measurements in the region
around A • 150 where the nuclear equilibrium shape changes
quite abruptly from spherical to deformed. The broader scope
or this research program has included the construction or an
intermediate-image beta-ray spectrometer and the modification
or an existing spectrometer. The final phase or this project
was to use the spectrometers together as an electron-electron
coincidence spectrometer and to investigate its applicability
as an instrument for accurately measuring internal conversion
II. SURVEY OF THEORY
This SUrT87 will present the theoretical basis or
internal conversion coerticient calculations. In particular,
primary emphasis is given to the calculations tor electric
quadrupole transitions. The manner in which these
calcula-tions are made follows the framework or Rose (27) and gives
an extension to the more specific surface-current-model
calculations or Sliv and Band (18). From this framework,
possible dynamic effects or nuclear size, discussed by
Church and Weneser (24), can be estimated.
As described in the introduction, the internal
conversion coefficient, a, tor a nuclear transition is
defined as the ratio or the number of orbital electrons
ejected per second, Ne, to the number of gamma rays emitted
per second, Ny. That is,
a • (1)
A given transition can convert in any filled electronic shell
or the atom, assuming energy conservation can be fulfilled.
Thus aK, aLI' aLII' aLII!' etc. correspond to internal
conversion coefficients for the various shells and subshells.
The total internal conversion coefficient a is given by
where ~L • ~LI + ~LII + ~LIII and similarly tor the remaining
shells.
The internal conTersion coetticients are strongly
dependent upon the transition energy, k (in units of the
electronic mass, mc2); the atomic number, Zl the angular
momentum change, L1 and finally upon the parity change, An •
More will be said about L and An later but it is important to
point out that it is the strong dependence of ~ on these two
parameters which has made internal conversion measurements
useful as a tool in nuclear spectroscopy.
In the following discussions, the symbols EL and ML
are used tor the electric 2L and magnetic 2L poles,
respec-tiTely. In particular an electric quadrupole transition is
denoted by E2 and its K-ehell internal conversion coefficient
by ~K(E2).
When the nuclear angular momenta tor initial and
final states are Ji and Jf, the field radiated can have any
angular momentum L tor which
•
The internal conversion coett1c1ents are in general a
mixture or the torm
a • ta(L)a(L)
L
'
where
a(L)
represents the traction or totalgamma
rays haTingangular momentum La the L T&lues are limited by Eq.
3·
Fromthe multipole expansion ot the electromagnetic field, it
there is no parity change in a nuclear transition there can
only be emission or electric multipoles or even order (L even)
or magnetic multipoles or odd order. For transitions in
which there is a parity change, these even and odd orders
are simply reversed.
As an example, it Ji • 2 and Jr • 1 and there were no
parity change, the radiated field would be a mixture or Ml,
E2 and MJ. From Eq.
4,
the K-shell internal conversioncoefficient tor this transition would be
'
(5)where a(l} + a(2) + a(J) • 1. For mixtures or this type,
the a(l}/a(J) ratio is usually so large that the MJ component
can be neglected. Similarly,
where the L subscript refers to the electronic shell as in
Eq. 2.
The mixing ratio, 6 •
:tft ,
can be determined fromthe theoretical values or the internal conversion
coeffi-cients and the experimentally measured ~KI~L (or simply K/L)
6
~K(Ml) • (K/L)«L(Ml)
-
-
~K(E2) • (K/L)«L(E2)•
(7)Converael71 i t 6 can be determined trom some other independent
measurement (angular correlation for example), a check can be
made on the accuracy or the internal conversion coefficient
calculation..
or
importance to the present investigation isthe fact that when Ji • 2 and Jr • 0 and there is no parity
change, the only possible multipole is E2. For these pure
E2 transitions there are no uncertainties or errors introduced
in the measurements trom a determination or mixing ratios.
Two basic assumptions are made in formulating the
theor7 of internal conversion. The first is the use or
perturbation theory in calculating transition probabilities.
By virtue of their charge and motion, the nucleus and
orbital electrons are coupled via the electromagnetic tield
and may therefore exchange virtual quanta resulting in the
transitions Nucleus in excited state + bound electron~
nucleus in lower state + electron in continuum.
Second-order perturbation theory is needed for the calculation ot
Ne while only tirst-order theory is needed tor the
calculation or Ny wherein the nucleus emits real quanta.
The second assumption consists or the statement that the
electron is described by a Dirac one-particle theory. When
screening is taken into account, the nuclear potential is
1'
With the above assumptions, the appropriate
transi-tion rates as given by Rose (27) area
(8)
•
.(9)In Eqs. 8 and 9, a. is the tine structure oonstant.
J
N is asum over final and average over initial nuolear substates.
~e
contains in addition to these operations, a sum overfinal electron states and a sum over magnetic quantum numbers
--+- -...
ot the initial state. JN and Je are transition current
densities tor the nucleon and electron, respectivelyJ
PN and Pe are transition charge densities. These densities
are assumed to obey the usual continuity equations,
• (10)
-
Je and Pe are defined in terms or the Dirac matrices and the Dirac one-electron wave functions ot the initial and t1nalstates. With few restrictions, the internal conversion
coefficient calculations based only on the static effect ot
nuclear size are insensitive to the specific forms chosen for
nuclear transition.
Expansion ot the expression tor Ne 1n Eq. 9 is given
elsewhere (24,28), but it is important to consider at least
qualitatively the results obtained tor this expansion and
their dependence on whether or not the electron is restricted
to a region outside the nuclear radius. In the earlier
point-nucleus calculations ot Rose Ai
Al·
(14), theexpan-sion tor Ne gave nuclear matrix elements identical to those
in Ny, and the resulting internal conversion coefficients
were independent of nuclear structure. It the nucleus is
considered to have finite dimensions, however, the
small-distance behavior of the electron wave functions is
modified, and in addition the expansion of N8 gives some
matrix elements which are different from those in
My•
Thenuclear matrix elements then tail to cancel and give rise to
what are called penetration terms in the calculations of the
internal conversion coefficients; these terms would vanish
it the electron current density were zero inside the nucleus.
Since a knowledge or JrN or the nuclear wave functions is
needed to calculate these terms, they are subject to the
particular nuclear model chosen and are referred to as the
dynamic effects or nuclear size.
The dynamic effects are usually small but ean become
important in cases where the gamma-ray matrix element is
investigation, these etreots are considered in more detail in
the discussion ot the results.
For K shell internal conversion ot E2 transitions,
the ratio ot Eq.
9
to Eq. 8 reduces to( ) na.k ' I + 12 ·
a.K E2 • 30 ~ C~,-l B~ AB~ ,
~
(11)
where~ takes on the two values, 2 and
-3,
tor which thenumerical coefficient c~,-1 is 4 and 6, respectively. The
parameter ~ is a non-zero integer which specifies the total
angular momentum quantum number J • 1~1
-
1/2 and the parityquantum number ~ •
J
+ _1L_ tor the final electron state.21~1
With this same convention, the -1 subscript corresponds to
the s! electron bound in the K shell. The radial integrals
representing all statio effects are given by
•
(-1-~) Jh1 (g~r_1 + r~g_1)r2dr
0
(12)
,
where h1 and h2 are spherical Hankel functions or the first kind with argument kr; r~ and g~ are radial functions tor
the final state;
r
_
1 and g_1 are radial functions tor theinitial state.
The primary problem of the calculations is the
purpose it is necessar7 to carr,y out numerical solutions of
the radial waTe equations
f ~ -1 -(W-1-V) f
..4..
-
r tdr _, ~ +
ll
g W+l-V r g
(13)
where the units are such that mc2 • 1 and 1!/mo • 1. Por the
bound states, the central potential V is taken to be that of
a uniform charge distribution inside the nuclear radius and
a Thomas-Fermi-Dirac screened potential outside the nuclear
radius. W is the energy of the electron state. A nuclear
radius of 1.2 A113xlo-13 em was used in the calculations by
Rose (27) and a 10% change in R generally leads to changes
in the coefficients ot less than 1%.
The factors in Eq. 11 which allow for possible
dynamic effects of nuclear size are
AR _, • -B _, _, w ei~-3 [E (l) 2 + E2( 2)]
-
'
where E2(1) and E2(2) depend on the nuclear model chosen
and for the surface-current-model calculations (18) are
(14)
1 and
127;,
respeot1ve17. These terms are set equal to zero1n the statio, finite-size calculations or Rose (27}e The
remaining parameters are defined and tabulated as functions
ot
z,
k and L by Green and Rose (28,29}. Magnitudes torthese parameters as they apply to this experimental
III. SURVEY OF EXPERIMENTAL METHOOO
There are many different methods for measuring
inter-nal conversion coefficients but the majorit7 of them have
experimental errors of ~ 10%. In this section, the main
emphasis will be given to only the most accurate techniques
and their applications to pure E2 transitions.
Since the internal conversion coefficient is simpl7
the ratio of electrons ejected to gamma rays emitted for a
nuclear transition, any experimental method must utilize the
detection of at least one of these forms of radiation. In
experimentally determining these quantities, the gamma-ra7
spectrum is usually complicated by man7 gamma-ray peaks and
the electron spectrum usuall7 has beta particles as well as
internal conversion electrons from several transitions.
Thal-lium activated sodium iodide cr7stals, Nai(Tl), connected to
photomultiplier tubes with the associated electronics, make
up the conventional gamma-ray scintillation spectrometers.
Variable magnetic field spectrometers are commonly used for
measuring the electron spectra and will be discussed more
fully in the next section. Although bent-crystal gamma-ray
spectrometers and fixed field electron spectrographs are
used primarily for accurate energy determinat.ions, they can
sometimes give precise ratios for internal conversion
deca7 scheme.
Por ver, simple deca7 schemes, careful measurements
of either the electron or gamma-ray spectrum can give
accurate internal conversion coefficients. The measurement
of Wapstra and Nijgh (19) on Hg20J mentioned earlier was of
this type. They measured the electron spectrum and resolved
it into the internal conversion electron and beta-ray
components. The ratio of the number of K-shell internal
conversion electrons to the number of beta rays minus the
total number of internal conversion electrons gave aK for
the 279-kev transition to an accuracy of J%.
Measurements on simple gamma-ray spectra by McGowan
and Stelson (JO) in 1957 were the first to point out
possible discrepancies between experiment and theory for
pure E2 transitions. Since K shell internal conversion
leaves a hole in that electronic shell, the internal
conver-sion process will be subsequently followed by a K x ray (with
a probability equal to the fluorescent yield). These x rays
along with the gamma rays were detected with a Nai(Tl)
crystal. The ratio or the number of K x rays to the number
of gamma rays, both properly normalized, gave aK's with
errors from 20% down to 7% at best.
Another way to measure internal conversion
coef-ficients accurately is the internal-external method of
the photoelectric method or Ellis and Aston (5). In
experiments or this type, a magnetic beta-ra7 spectrometer
is used to measure the internal conversion electrons from a
transition or interest and then to measure the number or
electrons ejected from an external converter, placed near
the source, b7 the corresponding gamma ra7. The number or
external electrons is proportional to the product of the
number or gamma rays and the photoelectric erose-section or
the converter. The energy dependence and absolute values or
the photoelectric cross-sections can be calculated but must
usually be normalized by comparison with some accurately
known internal conversion coefficients. Once this is done,
however, the ratio or the internal conversion electrons to
the externally converted electrons can be multiplied by the
photoelectric cross-section to give the internal conversion
coefficient. Limitations or this method are an intense yet
thin source and an accurate knowledge or the converter
thickness and uniformity, but its wide range of applicability
and good accuracy make it quite useful. The recent work or
Fre7 ~
Bl•
(J2) demonstrates this statement and gives aminimum error of 2.1% with
S%
being more typical.The remainder of the most accurate methods tor
measuring internal conversion coefficients utilizes
coincidence techniques. The simple coincidence logic requires
simulta-neousl7 (within 10·8 sec) with the transition or interest.
The onl7 accurate method tor measuring internal conversion
coefficients with only gamma-ray scintillation spectrometers
tor detectors is the coincidence-sum method or Lu and Schupp
(JJ). This method is an extension or the summing method due
to Lu (J4) which was severely limited in its applicability.
The essential feature or the method is the requirement or a
high energy gamma ray to be followed in coincidence by only
a low energy transition whose gamma ray must be completely
absorbed in the summing crystal. In this way the total
internal conversion coefficient tor the low energy transition
can be deduced. Although the coincidence and energy
require-ments restrict this method, it is the most accurate one tor
measuring total internal conversion coefficients of some of
the low energy, E2 transitions in the deformed nuclei.
Accuracies of approximately 1% can be obtained for the total
internal conversion coefficients resulting in errors of 1%
or greater for the K-shell coefficients when these
measure-ments are combined with internal conversion ratios measured
with a beta-ray spectrometer.
Recently, Taylor and Merritt (JS) measured the t9tal
internal conversion coefficient of the 166-kev transition in
the very simple electron capture or Ce139 to an accuracy of
o.s%.
Coincidences were taken between the 166-kev gamma rayelectrons, x rars and internal conversion electrons was
varied by a series or thin absorbers. The details or this
method have not been published but it 1s expected to be
quite inflexible in its applicability.
The other possibilities for the coincidence
technique involve electron-electron and electron-gamma ray
coincidence measurements and have been described in detail
by Gerholm
(36).
For accurate determinations of conversioncoefficients, this method requires that a resolved gamma
ray or electron (from either internal conversion or a
beta-ray group) must be in coincidence with the transition whose
internal conversion coefficient is to be measured. The
number of coincidences for a particular transition depends
upon the transmission of the lens spectrometer, the ~K/~
internal conversion ratio and the internal conversion
coefficient. The spectrometer transmission is a principal
source of error in these measurements but with care it can
be determined absolutely to an accuracy of ~ 2%. In
other cases, internal conversion coefficients measured
accurately by other methods can be used to determine the
transmission of the spectrometer. Wherever applicable,
coincidence measurements of this type are the most
straight-forward method for determining internal conversion
coeffi-cients to an accuracy of approximately
3%•
comprises the main
bodf
of this investigation and is discussedfurther in the following section •
IV. EXPERIMENTAL INVESTIGATION
The first part or this section is concerned with the
actual construction and performance or the coincidence
spectrometer, and the second part describes the particular
experiments performed.
A. Construction of Coincidence Spectrometer
The idea or studying electron-electron coincidences
was first forwarded by Feather (J7) in 1940 and was
subse-quently implemented by him in collaboration with Kyles and
Pringle (J8) in 1948. For these first measurements a
permanent magnet spectrograph with movable Geiger counter
detectors was used. Since that time, gradual improvement ot
•
coincidence spectrometers with greater collecting power or
transmission has been made8 In 1951 Siegbahn (J9) constructed
a so-called •spectrogoniometer• which consisted of two thin
lens spectrometers whose axes could be oriented between 180°
and 90°. The transmission and resolution of the
spectro-meters were O.J% and 2.2%, respectively, when a ) mm diameter
source was used. Further progress toward higher transmission
was made by Gerholm (40). He internally divided a long lens,
iron shielded spectrometer and obtained a transmission of J%
using a 2 mm source. At the same transmission, a source
diameter or
5
mm gave a resolution or3·1%.
Since the number ot coincidence counts increases
by a tactor t2 it the transmission in each channel ot the
coincidence spectrometer is increased by a ractor r, the
possibility ot utilizing the high transmission characteristics
ot the SlAtis-Siegbahn type intermediate-image spectrometer
(41) was tirst investigated by Sl!tis and Herrlander (42) in
1955·
A recent article (43) by them describes in detail theconstruction and pertormanee ot their coincidence
spectro-meter. Its typical transmission and resolution values are
given later in comparison with the present work.
Another important teature regarding instruments or the lens type is their size. Although they could in principle be
made quite small, the source diameter would also have to be
scaled down to preserve the same transmission and resolution
characteristics. For a specified thickness, the source
intensity depends on the source area, and it is theretore
desirable tor most eases to make the physical dimensions ot a
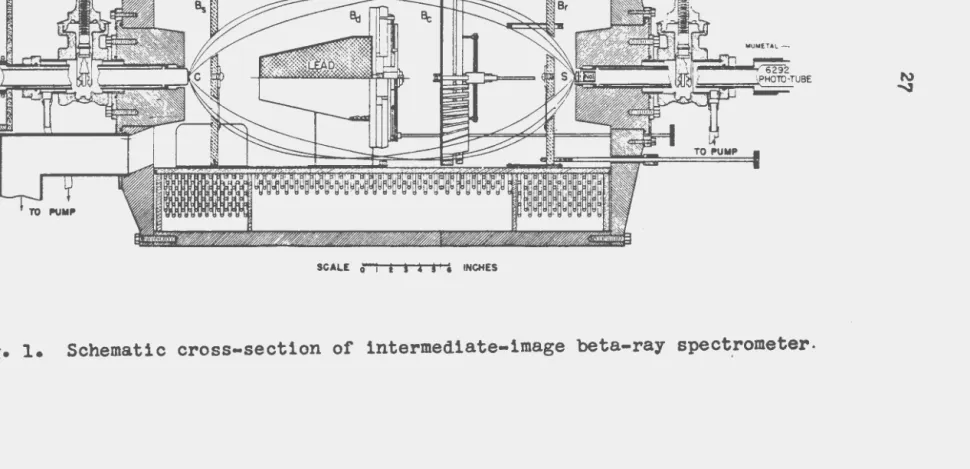
spectrometer as large as is conveniently possible. A Slltia-Siegbahn type intermediate-image spectrometer whose pertinent
dimensions were a ractor or 1.2 larger than those used by
Herrlander and Slltis was constructed by Nichols ~ ~.
(44,45)
in1953
at Iowa State University. The schematic!l· 1s shown 1n Pig. 1.
The present investigation began 1n
1956
when planswere made to build another spectrometer ot the same size
which could be used in coincidence with the existing
spectrometer after some modifications. Except tor the
neces-sary modification ot the magnetic yoke to allow tor the source
and detector positions to be outside the 7oke, differences in
construction between the new and existing spectrometer were
limited to minor changes in the cooling and battle systems.
A schematic cross-section ot the coincidence spectrometer is
shown in Fig. 2. The machine work tor the spectrometers was
performed in the Iowa State University Instrument Shop.
Details ot winding the coils on the brass spool were carried
out in a manner almost identical with the procedure described
by Nichols ~ ~. (44)1 the only difference being that each
coil instead of pairs or coils was externally connected to
the water system to provide more efficient cooling. The
brass spacer shown between the spectrometers in Fig. 2 also
determines the source position and can be fastened to either
spectrometer and moved along two perpendicular directions by
means or screw adjustments to position the source on the
magnetic axes.
Although most or the existing systems including
current and safety controls carried over into the present
co1nci-SCALE o- l t l • s•• INCHES
[image:35.591.106.670.199.433.2]TO PUMP
SCALE . o 1 2 3 4 5 6 INCHES
6810
PHOTO TUBE
Fig. 2. Schematic cross-section of electron-electron coincidence spectrometer .
..
N
[image:36.585.29.755.65.553.2]dence arrangement were inyolved. these 1ncluded a movable
table which would support the approximate one ton weight ot
the new spectrometer, a tlexible water s7stem capabl~ ot
~
holding the JOO psi input pressure to the coils, and
provisions tor aligning the axes or the two spectrometers.
A caretul study ot the photograph shown in Pig. J reveals the
way in which these new demands were met.
Following completion ot the new spectrometer, checks
were first made on the symmetrr ot the magnetic field. With
neither end plate mounted and with all the coils connected in
series, the measured magnetic tield intensit7 along the axis
is shown in the lower curve ot Pig.
4.
Also show.n is asimilar measurement made with only one ot the end plates in
position. These curves were taken with a current ot
4
ampsthrough the coils. A General Electric Gaussmeter and a
Rawson fluxmeter were used to measure the tield intensit7
inside and outside ot the iron yoke, respectively. As seen
trom Pig.
4,
the magnetic tield at the source position is atactor ot JO lower than the maximum tield strength, and little
or no influence ot one spectrometer on the other was expected.
A later check on this possible etteot showed that the
momentum displacement ot the 60-kev Auger lines in Pb207 was
less than 0.1% when the tield in the other spectrometer was
changed trom zero up to a value corresponding to an electron
: )
c (!)
INCHES
I-'ig. 4. Axial mae;netic field dist~ibution in spectrometer.
A. 1Ii thout end pl::l.tes.
determined b7 maximum tranamisaion was obtained b7 electricall7
omitting ) of the
4
center coils as well as ) of the 10 coilain each ot the two end sections.
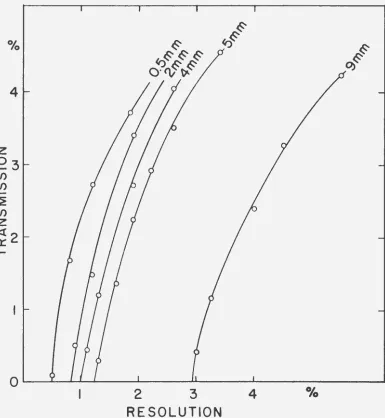
Using different source sizes, a series of relative ~
transmission versus resolution curves were deduced trom data
taken b7 scanning over the ThB F-line with different center
and resolving battle settings. The relative transmission
values were experimentally tound to be in agreement with the
expression
'
(16)where T0 is the transmission tor a point source on the axis,
a is the source radius and h is the distance between the
center ot the source and the spectrometer axis. The
coef-ficient t has the values O.O)S ! 0.004 mm- 2 and 0.068
! 0.007 mm- 2 for transmission based on peak areas and peak
heights, respectively. The combination of these results with
the absolute value for the peak height transmission discussed
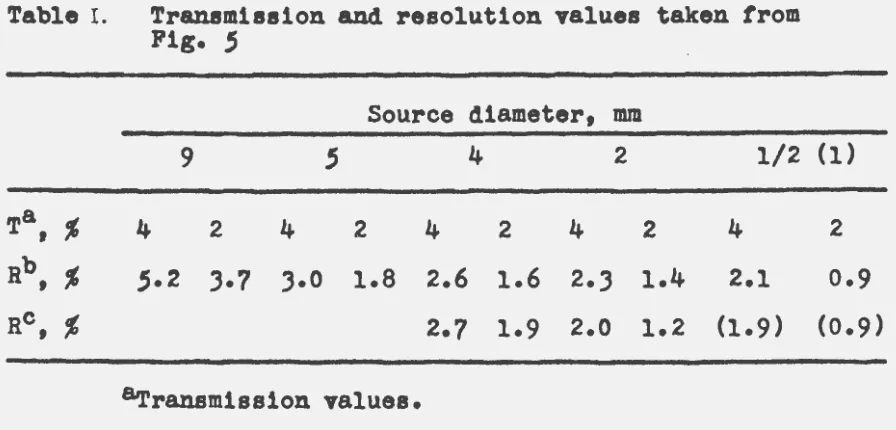
in Appendix A gives the curves shown in Fig.
S·
Table Ilists typical transmission and resolution values and compares
them with the corresponding values obtained by Herrlander and
Sl!tis (4)).
The performance ot the spectrometers as independent
instruments has been reported ~ Nichols ~
§l.
(46) for the4
z
03
en en
~
en
z
~2
t-2 3 4
RESOLUTION
Fig.
5·
Transmission versus resolution characteristics for different source sizes in the new ormodified spectrometer .
[image:41.594.112.497.175.593.2]Table I. Tr&n8mission and resolution values taken trom Pig.
5
Source diameter,
mm
9
'
4
2 1/2 (1)Ta
'
%
4 24
24
24
2 4 2Rb
'
%
,.23·1
3·0 1.8 2.6 1.6 2.31.4
2.1 0.9Rc
'
%
2.7 1.9 2.0 1.2 (1.9) (0.9)&rransmission values.
baesolution values.
Cco~arable resolution values obtained b7 Herrlander
and Sl!tis (43).
by Schupp At~. (47) tor the modified spectrometer used in
beta-gamma coincidence studies. The present investigation
was the tirst to use the spectrometers in the coincidence
arrangement and has primarily examined its applicabilit7 to
accurate internal conversion coefficient measurements.
B. Measurement ot the K-Shell Internal Conversion
Coefficient of the 344-kev, E2 Tranaition in Gd1
5
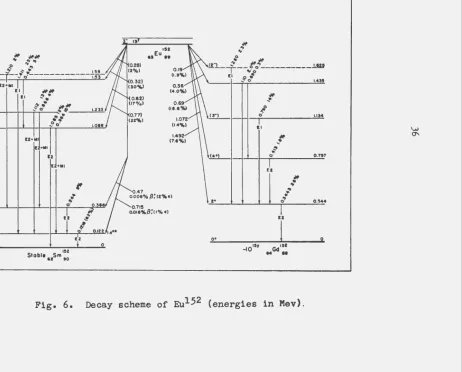
2The sample used in this investigation was produced b7
1~
slow neutron irradiation ot enriched (97.8%) Eu2
o
3 in areactor at the Oak Ridge National Laboratory. EulS2 was
chosen because it deC&Js b7 electron capture to smlS2 as well
[image:42.591.57.505.89.304.2]as by beta emission to Gdl52. The decay scheme (48,49) is
giYen in Fig.
6.
It has been well established that theequilibrium nuclear shape changes rapidly, in the nature of a
•jump•, in the region or neutron number N • 88 to N • 90
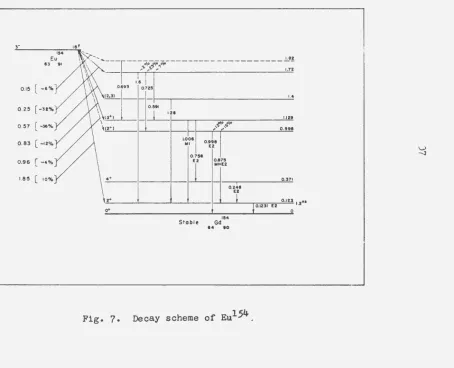
(50,51). Gdl54, with N • 90 and Z • 64, is known to have an
ellipsoidal shape and exhibits rotational type low lying
levels as can be seen from the decay scheme (49) shown in
Fig. 7. sm1 52, also with N • 90 but
z •
62, is very similarin shape and level structure, as well as in other collective
properties. Gdl52, on the other hand, with N • 88 and Z • 64,
has a near-spherical shape and exhibits Yibrational type low
lying levels quite different from that of Gd15
4•
Accuratemeasurements of internal conversion coefficients in this
region would therefore be expected to give information
relevant to the possible correlations between nuclear
deforma-tion and internal conversion suggested by Subba Rao (25) and
Bernstein (26).
Independent determinations of aK for the pure E2,
122- and 344-kev transitions in Sm152 and Gd152 could be
made using the electron-electron coincidence method if the
solid angle of one of the spectrometers were acourately
known. A Hg197m source was used for a solid angle
measure-ment but the results were imprecise and are discussed in
Appendix A. Another attempt to measure the solid angle was
deter-~ deter-~deter-~
~
.:
..
.!? ..~ ~ • 1.58
~~-+--~~---~.~---;; ... 1
II
lEI MM . El ~."'
~·· ~~
~1----1-1 i 1o· ~ .,." 1.233 1
~·
0 '!I
~1-1-1---1-l ,. 10 1.018 I
4•
o•
U+MII U ... l
I I
n
E2+MI
1!12
Stable Sm
U tO
,
0
0.28)
(20,4)
0.3Z)
!:SO%)
0.6Zl
(17%1
0.77) (Z2%l
0.47
, 1Eu ••
o.ooa% 13: lz%•1
0.715
0.018%/3:11% «)
""
0.IZI ~- M~
---~--"''? oo· ---.LW El 0 ~
... ~ o·
~0 H
~
1.4:55
..!.rr__l_f..-1 o· 1.134
lEI z• o• -10111 ' EZ M ~~r• l
o"
u 0.7!17 0.3441 0
I liZ MGd ••
Fig. 6. Decay scheme of Eu152 (energies in Mev).
\..>
[image:44.592.130.633.82.463.2]83 91
0.15 [ ~•%
0.25 [ ~31%
0.57 [ ~345%
0.83 [ -12%
0.96 [ -4o/o
1.85 [ 10%
---ft-;...-:..~·."'io--- 1.81
~" ~"/ ~·, ---1.72
1.4
1.129 0.991
LOOtll 0.991
Ml I £2
0.751
EZ 10.175
'_L
Ml+£24+ I 1-1 1-1 0.371
r
o+
Stobie
0.241
£2
154
Gd
t4 90
o.l231 n 2:!ll1.z••
0
.______ _ _ _
j
Fig. 7 • Decay scheme of EulS4.
[image:45.592.138.661.85.478.2]mined relatiTe to 4K ot the 122-keT tran.ition quite
accurately, and the total internal conversion coetticiont ot
the latter transition has been measured by Lu and Schupp (S2)
to be 1.135
±
0.010.A EuClJ source was used in the first relative
measurement and a EuF3 source was used in a later experiment.
These sources were vacuum evaporated !rom the dilute HCl and
HF solutions ot the enriched Eu1
5
2 activity described above.The source films were aluminized rormvar with a total
thick-ness or 18 ! 4 ~g/cm2. Orifices S mm in diameter were used to
define the source areas and to center them ·on the films.
Source thicknesses were estimated to be less than 1 ~g/cm2•
Considering first the measurement on the 344-kev
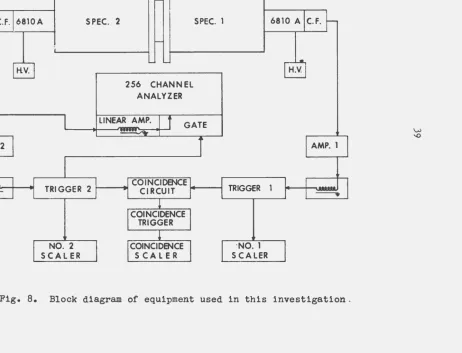
transition in Gd152 and referring to the block diagram shown
in Fig. 8 as well as to the decay scheme, if Spec. 1 is set
at an electron energy or 480
±
25 kev, then each or the betaparticles detected would be in coincidence with an ensuing
344-kev transition. With Spec. 2 set on the peak of the
344 K-internal conversion line, the number or coincidence
counts, Nc(344), would be given by
e(coin) C(P-344)
'
(17)
256 CHANNEL ANALYZER
TRIGGER 2 I ~
NO. 2 SCALER
TRIGGER 1
·NO. 1 SCALER
Fig. 8. Block diagram of equipment used in this investigation.
w
[image:47.592.130.625.103.482.2]~()44) and ~K()44) are the total and K-shell internal
conversion coefficients or the 344-kev transition,
Oz
ia thesolid angle or Spec. 2, c2(344) is the detection efficiency
ot
Spec. 2 tor the 344 K-internal conversion electrons,e(coin) is the efficiency or the coincidenqe circuit, and
C(S-J44) is the factor which arises from angular correlation
effects between the betas and the internal conversion
electrons.
Consider now the 122-kev measurement, realizing that
nothing has been changed regarding the source. It Spec. 1 is
set on the K-internal conversion line or the 245-kev
transi-tion in Sm1
5
2, and Spec. 2 is set on the peak of the 122K-internal conversion line, the number or coincidence counts
would be
(18)
e(coin) C(245-122)
'
where the notation is analogous to that above with the 1 and
2 subscripts designating the spectrometers, and the numbers
in parentheses refer to the particular transitions.
It the ratio or Eqs. 17 and 18 is taken, the
Nc(J44)/N1
<a>
Nc(l22)/N1(24SK)
-where the c(coin) and
o
2 quantities have been eliminated.It is assumed that the coincidence efficiency factors
in Eqs. 17 and 18 are the sameM Since 21r 's of approximately
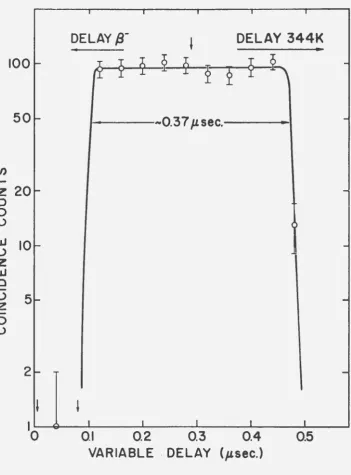
O.JS ~sec were used in this investigation, e(coin) is expected
to be close to unity. Prompt coincidence curves of the type
shown in Fig. 9 were always measured before any particular
coincidence data were taken. The delay was then set, as
indicated by the arrow at the center of the prompt
distribu-tion in Fig. 9, such that transit t1,ne ur ~nergy dependent
effects would be minimized. Any error contribution to Eq.
19
from the ratio of the e(coin)'s for the two measurements is
then expected to be less than
o.s%.
Although the resolvingtimes used were rather long, the accidental coincidences
never amounted to more than S% of the total coincidences
across the peaks because of the low counting rates. The
accidental& were calculated from the 2'r values measured by
feeding pulses from a pulse generator through the circuits
associated with Speo. 1 before and after each coincidence
run. These values were also in good agreement with the full
width at half maximum of the corresponding prompt curves.
It is also assumed that
o
2 is the same for the 122I T
DELAY~-'
DELAY 344K100 - T T ;:
~
£
rT~
-(fY T
50 f- -0.37 p.sec.
-en
t-z
20-
-:::>
0
(.) w 10
( )
-
-z
w
0
( ) 5
z
-
-0(.)
2 f-
-' -'
I I . I I Ilo
0.1 0.2 0.3 0.4 0.5VARIABLE . DELAY (psec.)
[image:50.588.90.442.139.615.2]trajectories are somewhat energy dependent as a result of
the remanence or saturation effects in the iron yoke, the
assumption that the solid angle or transmission is the same
in both cases would be incorrect. Any significant energy
dependence, however, should be seen as a deviation from the
linear Kurie plot ot allowed spectra. The performance of the
spectrometers, in general, along this line has been thoroughlJ
investigated by Nichols
At
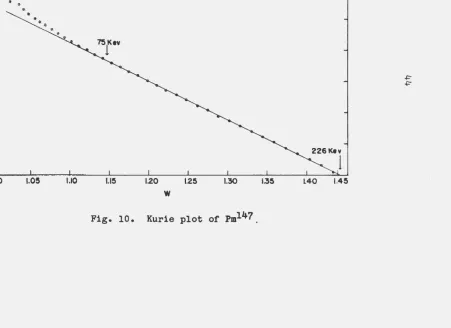
~· (46) and in the presentinves-tigation a deviation of less than
o.s%
from linearity,between75 and 200 kev was obtained for the Pml47 Kurie plot shown
in Fig. 10. In addition, an energy dependent transmission
should appear as a deviation from the linear relation between
the current through the spectrometer coils and the momentum
ot the focused electrons.
In
this latter case a deviation otless than
O.J%
was observed for the entire range ot ThBcalibration lines from
25
to 2500 kev. From theseconsidera-tions it was estimated that the error contribution due to
any variation or 02 over the energy range or the 122 and
344
K-internal conversion lines would be less than
0.5%·
It should also be pointed out that since the same
physical source was used for each relative measurement, no
effects of the type described by Eq.
16
due to source size orposition are present.
~
0~----~--~~---~----~---~----~---~----~--~~ 1.00 1.00 1.15 1.20 1.25 1.30 1.35 L40
w
Fig. 10. Kurie plot of Pm147.
[image:52.594.143.640.129.457.2]
+=-internal conversion lines. Gaussian curves were then fitted to
these points by the method of least squares. To allow tor
pos-sible systematic errors, the error assignments were estimated
to be approximately
1.5
times the statistical error of thecom-bined number of true coincidences recorded across the peaks.
Points taken away from the peaks, where no true coincidences
were expected, showed very few or no coincidences above the
cal-culated number of accidentals. The entire internal conversion
spectra were run with Spec. 2 in the measurements of the aK/a
internal conversion ratios. These raw data were programmed
through the Iowa State University IBM 650 computer whose output
gave the values for the N~ and Kurie plots. Areas under the
various peaks were then determined from the N~ spectra where
the beta distributions under the peaks were estimated from the
Kurie plots, and the peak heights were determined by fitting
Gaussian curves to the upper points. The essentially Gaussian
form of the line shapes can be seen in Figs. 11 and 12.
From the data shown in Pig. 11, the aKia ratio tor the
)44-kev transition was determined to be 0.786 ~ 0.004. This
value was obtained from both the coincidence and singles data,
and the error assignment should easily cover systematic errors
introduced by the background and 413 K-internal conversion line subtractions. The coincidence data shown in Fig. 11 were
ob-tained with a beta scintillation spectrometer connected to Spec.
z
[image:54.591.163.584.92.461.2]i
... C/)
~
u
~I(::"- 6
z
~
~
-.
.
.
2.13%
···
...
·
344L+M+·-~
...
.
·.
413KI
'
· ... ··-··
... ·
.... .
~111~11~~11
0 I I.C: I 10 I f'll"\. I l"'al"'a I,.... I - - • - -
a-- • -- •-
~• •
+='
"'
Fig. 11. Internal conversion-electron spectra of the )44-kev transition 1n Gd1S2
~~~
§
2.26%41
a .j~ .... __...I
l
.\ofta ~
2
0o.480
122M+···
t
+"
-...J
[image:55.588.116.672.121.498.2]not used in the internal conversion measurements because or the
uncertainties which would be introduced by the change in
exper-imental conditions with respect to the measurements on the
122-kev transition. The numerical result tor the «x/« ratio is in
agreement with the value of 0.791 ~ 0.003 calculated from the
data or Bobykin and Nov1k
(5J).
The data from which the «K/a. value
ot
0.589 ~ 0.003was determined tor the 122-kev transition is shown in Fig. 12.
This value is in good agreement with the value or 0.590 ~
0.013 calculated from the data of Kelman ~
ll• (54).
Since the linear Kurie plot discussed in connection
with the possible energy dependent transmission effects
suggests a constanc7 or the area under the Nf.? line shape
rather than a constant peak height, the peak coincidences
were normalized to the peak areas by using the area to peak
ratios determined from the singles data. These ratios are
discussed b7 Gerholm (J6) and are approximately equal to the
momentum resolution or Spec. 2 as can be seen from the values
listed in Table II. An7 source thickness effects would also
be reduced b7 this procedure. In other experiments where
source size and position effects are also important, the
procedure or normalizing to the peak area reduces the
possible errors caused b7 these erreots as is discussed in
Appendix A.
tractions or
)44
and 122 K-1nternal conversion electronsbackscattered from the source were estimated to be 0.001 and
0.009 respectively. Prom the data or Wagner
(56),
however,essentially all of these backscattered electrons would be in
the inelastically scattered regions below the observed peaks
and therefore would not affect the coincidence or singles
data across the peaks.
The traction or total counts in Spec. 1 due to the
245 K-internal conversion line, N1 (24SK), was carefully determined from the total spectrum as shown in Fig. 13. The
current value designated by the arrows in the figure was
used rather than the peak value because any shift in the
current control which would also change the beta background
would easily be noticed. No irregularities or this type
were noted in these runs, however. The smooth curve under
the internal conversion lines or the 245-kev transition was
estimated from a Kurie plot of the region shown.
The detection efficiencies, £2(344) and e2(122), were
determined by displaying the pulse height spectra from the
anthracene detector of Spec. 2 on an RCL 256-channel analyzer.
Referring to the block diagram in Fig. 8, these pulses from
the cathode follower output of the RCA 6810A photomultiplier
were fed into the amplifier preceding the trigger to the
coincidence circuit. The trigger pulses to the coincidence
42
38
22
18
14
106.6
Fig. lJ.
245L+M+ .. •
I
CURRENT
[image:58.591.79.472.128.644.2]were also used to gate the multichannel anal7zer. The
gated spectrum shown in Pig. 14 then dittered trom the total
spectrum by not having the low energy pulses which were below
the trigger level. A switch on the analyzer could open the
gate momentarily in order to give the zero pulse height
position. By extrapolating the tail ot the distribution trom
the trigger level cutoff to the zero level, the traction ot
counts lost and hence the efficiency could be estimated.
Here again systematic errors may be present in the individual
determinations but an error contribution trom the £2(344)/
e2(122) ratio should be less than 0.2%.
The angular correlation factors, C(P-344) and
C(245-122), are not known exactly, but estimates with appropriate
error assignments can be made. Following the discussion
presented in Appendix B, these factors can be calculated
using the data or published gamma-ray angular correlation
measurements in conjunction with estimated geometrical
quantities tor the coincidence spectrometer. The coefficient
A2 (A4 assumed to be zero) has been measured between the
1.49-Mev beta-ray group and the 344-kev gamma ray
(S7,S8)
asa function of the higher beta-ray energies using EuClJ
sources. When these results were extrapolated to 480 kev,
A2 was round to be -0.13
!
0.03. This value combined with the 344-kev K-shell particle parameter and the tact that onl76 5 en .... Z4 :;) 0 0 3 2 ...J .LIJ .-:> :::t:LLI LLI...J (/)Q: ...JLLI :;)(!) a..~~~~* Oo:: a::.,_
~ ~
l ·,.x" l XIO.,. It ..g. X X6l ~ 0 0 0 0 Q) 0 0 0 0 co 0 0 0 ----!9 0 0 0 0 0 0 0 0 0 8 8 0 0 0 0 6l co 0 0 0 Q) 0 0 0 0 o--36% 0 ~ 0 0 0 0 0 0 00 0
\
-~/"'
Ol-
.
~~~
~ I I I I I I I I I
0 20
Fig. 14.
40 60 eo 100 120 140 160 180 200 220
CHANNEL NUMBER
Gated pulse height spectrum from the anthracene detector for 75-kev electrons (122 K-electrons).
[image:60.591.136.651.86.477.2]