Flying with data: Openness, forms and understanding
DULAKE, Nick <http://orcid.org/0000-0003-1841-5848> and GWILT, Ian
<http://orcid.org/0000-0002-3759-3423>
Available from Sheffield Hallam University Research Archive (SHURA) at:
http://shura.shu.ac.uk/15932/
This document is the author deposited version. You are advised to consult the
publisher's version if you wish to cite from it.
Published version
DULAKE, Nick and GWILT, Ian (2017). Flying with data: Openness, forms and
understanding. The Design Journal, 20 (Sup 1), S3863-S3872.
Copyright and re-use policy
See
http://shura.shu.ac.uk/information.html
An International Journal for All Aspects of Design
ISSN: 1460-6925 (Print) 1756-3062 (Online) Journal homepage: http://www.tandfonline.com/loi/rfdj20
Flying with data: Openness, forms and
understanding.
Nick Dulake & Ian Gwilt
To cite this article: Nick Dulake & Ian Gwilt (2017) Flying with data: Openness, forms and understanding., The Design Journal, 20:sup1, S3863-S3872, DOI: 10.1080/14606925.2017.1352889
To link to this article: http://dx.doi.org/10.1080/14606925.2017.1352889
© 2017 The Author(s). Published by Informa UK Limited, trading as Taylor & Francis Group
Published online: 06 Sep 2017.
Submit your article to this journal
Article views: 3
View related articles
Design for Next 12th EAD Conference Sapienza University of Rome
12-14 April 2017 doi: 10.1080/14606925.2017.1352889
© 2017 The Author(s). Published by Informa UK Limited, trading as Taylor & Francis Group. This is an Open Access article distributed under the terms of the Creative Commons Attribution License (http://creativecommons.org/licenses/by/4.0/), which permits unrestricted use, distribution, and reproduction in any medium, provided the original work is properly cited.
Flying with data: Openness, forms and
understanding
Nick Dulake
a, Ian Gwilt
ba Sheffield Hallam University, Design Futures, Art & Design Research Centre b Sheffield Hallam University, Art & Design Research Centre
Abstract: There is a concerted effort to make available large amounts of public and
open data. This paper explores this much-vaulted idea in terms of how easy or
difficult it might be to find and access this data, and how a non-specialist audience is
able to read, comprehend and make sense of complex digital data in its conventional
form. Following a discussion that introduces the concept of the datadriven physical
object (the data-object), and the current issues pertaining to the access and use of
open data, the paper traces the journey of two design researchers through the
activity of locating and using publicly available healthcare statistics as source content
for developing this new form of data interpretation. The documented ‘dataseeds’
case study suggests that making data publically available is only the first step in
thinking about how digital data can be accessed and shared in meaningful ways by a
range of different audiences.
Keywords:
data objects, information design, open data, data visualisation
1. Connecting data with form
It is considered that we respond to data both emotionally and cognitively (Kennedy, 2015), and that notions of the embodied technological experience form an important backdrop to current thinking around the Internet of Things (IOT), smart environments and the rapidly expanding data-sphere (Munster, 2006). In previous research (Gwilt, Yoxall, & Sano, 2012) it has been observed that when you represent data as a physical object there is a relationship established between the physical affordances of the object, such as shape, texture, scale and weight, and the perception of the interpretation of the data that object represents. For example, the amount of granularity or texture of a surface would appear to correlate with the perception of how much data that surface
represents, e.g. textured surfaces suggest more data, smooth surfaces less and so forth. As Sennett has observed, the nuances of material cultures are extremely important when establishing and assigning value to the things we use (2009).
Choices in visual metaphor and form are also seen to impact on how people understand and relate to any suggested physical representation of data. However, the representation of data through a physical object is by no means a new idea; cultures and communities over time have adopted this technique in different ways to suite particular needs, for example Swiss shepherds used the tally stick (a piece of wood with notches carved into it) as a physical record to document Alpine grazing rights
in 18th Century Switzerland. Pierre Dragicevic and Yvonne Jansen have put together a collection of over 250 different types of data driven objects dating back to 550Bc, however the majority of the examples in this archive have been created in the last decade (dataphys.org/list/). Andrew Vande Moere, an early commentator on the practice of data visualisation also comments on the use of the physical form to convey digital information and how we might approach representing abstract data that has no inherent spatial form in the material world (Vande Moere, 2008). Artists such as Nathalie Miebach and Annie Cattrell have worked with data, using both traditional and contemporary making techniques. In the case of Miebach, the artist uses weaving to create physical representations of weather patterns (Miebach, 2006), while Cattrell has employed 3D printing to represent
neuroscientific data of what happens in the brain as we go through different emotional states (Cattrell, 2009). Abigail Reynolds 2013 work Mount Fear East London uses laser-cut pieces of corrugated cardboard to create a room sized 3 dimensional representation of violent crime statistics in different areas of London. This large data visualisation presents the audience with an imposing representation of data the meaning of which is enhanced by the use of roughly finished pieces of cardboard and through the physical scale of the work. In a more physically refined use of a
dataobject concept Mitchell Whitelaw (2010) compiles 150 years of temperature data from Sydney, Australia to create a drinking beaker in a comment on global warming. Using 3D printing
technologies, annual coils of data are placed one on top of the other to create the shape of the cup. Recent increases in the overall temperature patterns create a flared lip to the beaker in a
serendipitous correlation with a convention that commonly uses the same flared-lip technique to make drinking more pleasant.
The employment of new digital making techniques such as the range of 3D printing methods now available, and the flexibility that this enables in terms of creating physical representations of data, is an important enabling factor. The other enabling factor in this story is the capacity of the computer and digital technologies to store, generate, analyse and cross-reference data at an ever increasing scale and speed. The dataseeds case-study outlined below is an example of the data-objects concept that utilises contemporary fabrication methods to translate complex digital data into a physical object that can be used to aid understanding and simulate conversation around a digital data set.
2. Making sense of data
Data and the use of data is rapidly becoming the new universal language. The rush to digitise all things physical in the late 20th Century led to the rise and rapid development of the human
computer interface (HCI) in the many forms we see and use today (Johnson, 1997). In this new data driven revolution there is an equal and pressing need to develop and deploy interfaces that allow people and communities to explore and make use of digital data in a variety of contexts and for
different purposes (Yau, 2013). Andy Kirk’s book Data Visualisation A Handbook for Data Driven
Design (2016) unpacks in some detail the variety of different ways that data can be represented in 2 Dimensional visual forms to help aid the reading and interpretation of data. But the notion of incongruent data where data has no inherent form (Vande Moere, 2008; Lima 2009) problematises what techniques we should be using to make data comprehensible and engender insight. If data has no naturally corresponding form what do we use to guide our choices when making a physical/visual representation of data?
Unquestionably today’s digital data comes in many forms and sizes, and terms such as Big Data,
Open Data and the Quantified Self by degree refer to scales and accessible forms of data that are collected from the societal level to the personal (Prendiville, Gwilt, & Mitchell, 2017;
Flying with data: Openness, forms and understanding
MayerSchönberger & Cukier, 2013)1. In relation to the sharing of healthcare data in the UK NHS
England has recently announced the establishment of a National Information Board to help manage and effectively utilise publically released open data, and to make progress on improving healthcare using data and technology (www.gov.uk/government/organisations/national-information-board).
3. The Dataseeds case-study
The following case-study describes an experiment to produce an object-based translation of a publically accessible open data source from the UK NHS healthcare sector as a praxis exemplar. It was devised as a practice-based method intended to reveal some of the key issues involved when translating digital data into a physical object that is representative of any underlying data set. As well as documenting the design process undertaken the case-study is also used to inform a set of general guiding principles for the creation of data-based objects. These principles are documented and discussed in the final section of the paper.
Moreover, the case-study operates as an example of how it is possible to interpret digital data as a physical object utilising a combination of design strategies and contemporary fabrication methods. It should be noted that as the project was conceived as a way of exploring the potentials of the data driven object as a way of communicating healthcare statistics the process we undertook was slightly unusual in that we did not start with a given or identified data set to work with. In most instances however it is imagined that an appropriate data set will have already been identified. The outline process that the case-study assumed was as follows:
1. find and select an appropriate data set (the data set would typically already be selected)
2. identify key information in the data
3. develop prototypes to test the design decisions in respect to communicating the data 4. develop a workable model that can be shared with potential users
5. evaluate the effectiveness of the data object in communicating the underlying data 6.
3.1 Selecting a data set
The data set we decided to use for the case-study came from NHS Digital (previously known as the Health and Social Care Information Centre), who are the national provider for information, data and IT systems, that support commissioners, analysts and clinicians in the health and social care sectors in the UK (https://digital.nhs.uk/). As mentioned there is a concerted effort to make data from the public sector available to the community, and as well as the NHS Digital resource an extensive repository of data from different sectors including, business, the environment, social metrics, transport, government and education statistics, can be accessed through data.gov.uk. The data sets in these digital repositories are typically presented and downloadable as statistical spreadsheets in commonly used formats such as MS Excel Spreadsheets, Xls or CSV files. These data sets are often accompanied by contextual reports. Although work is being undertaken to consolidate and simplify access to and navigation of these public resources, it can be quite difficult to know where to find information and to identify specific data which might be part of a more complex spread sheet; online tools to assist with this task are beginning to be provided in some cases. Information on how data is
1 The desire to release data into the public domain is a positive step, however how this data can be accessed and in what forms these data sets are realised is still being developed. The politics of data ownership and privacy, although important issues are not discussed in this paper.
collected, data governance and good practice polices is an important part of official public open data and information pertaining to this can also be found at these locations.
3.2 Working with the data
Specifically, the data used in the case-study project comes from publically available NHS risk
management statistics and makes up part of the data set ‘The Health and Social Care Information
Centre, Hospital Episode Statistics for England, inpatient statistics, 2012-13 (2016). This dataset documents over 350 different reasons why patients are admitted to NHS hospitals in England in
2012/3. Of all of these different causes we were particularly interested in ‘falls’ as a reason for
admission to hospital. Within the statistics there were 15 subsets around falling accidents. These were as follows:
• Fall on same level from slipping, tripping and stumbling
• Fall involving ice-skates, skis, roller-skates or skateboards
• Other fall on same level due to collision with, or pushing by, another person
• Fall while being carried or supported by other persons
• Fall involving wheelchair
• Fall involving bed
• Fall involving chair
• Fall involving other furniture
• Fall involving playground equipment
• Fall on and from stairs and steps
• Fall on and from ladder
• Fall on and from scaffolding
We decided to use the falls on stairs and steps statistics, which accounted for over 3% (37,427) of all the 1.2million plus admissions for the year and was the 7th highest reason for admissions. For the purposes of the project the data was separated into four sub-sets: falls of people between the ages of 50 to 60 years, 60 to 70 years, 70 to 80 years and 80 to 90 years.
3.3 Designing with the data (designing the dataseeds)
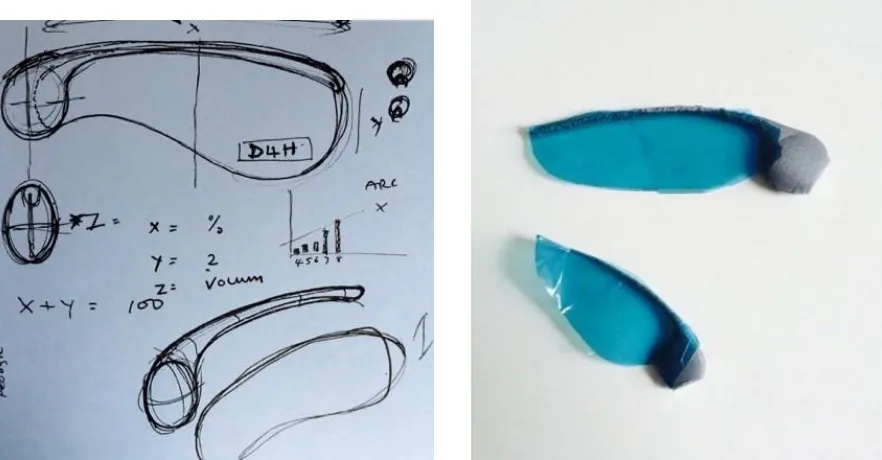
The selected data set allowed us to develop a data-object concept based on the metaphor of falling (the dataseed). Drawing from nature we looked at the Sycamore seed as an aesthetically pleasing and functional solution (Figure 1.). The Sycamore seed form, and how it falls, is something that is universally engaging and as such we decided it would work well as a metaphor for human falls. To accurately represent the falls data as a data-object we needed to make a physical representation of a sycamore seed that could drop and spin at different rates to visually and dynamically interpret the data. To achieve this, we aimed to produce a standard seed body and spine with an adaptable wing profile that would parametrically alter based on the data instance, to change the descent and spin characteristics. A number of prototypes were created to replicate the angle and pitch of flight from a natural seed.
Flying with data: Openness, forms and understanding
Figure 1. The sycamore seed was identified as an appropriate analogy for the data-object we were constructing.
A selection of instances from the data set based on the number of falls in different age groups were used to calculate the surface area of the wing shape attached to a dataseed. These calculations dictated the spin and falling speed of each of the seeds, which meant that the data itself was manipulating the speed of descent of the seed. (Figure 2.).
Figure 2. The data dictates the surface area of the wing of the dataseed, which in turn influences the spin and falling speed of the data-object.
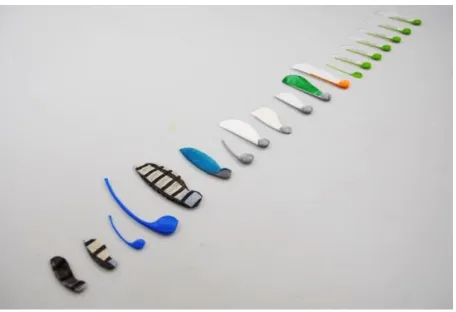
The design process was started through a process of ‘quick-and-dirty’ prototyping both on paper and digitally to create functional informative models. We created multiple seed forms from different data instances associated with the frequency and age demographics in the data set. SolidWorks, a CAD software was used to create 3D structures to develop the body and tail seed frames, and paper and adhesive tape were used for wing experimentation. Through this iterative process we were able to achieve a good representation of a Sycamore seed flight during falling.
[image:7.595.74.515.409.639.2]The second part of the design process was to address how the speed of descent for each dataseed would work in relation to the data instance that it was representing. A flying dataseed that mimicked the natural fall pattern of the sycamore seed was developed over the course of a 2-week dynamic development design process, which looked at the wing design, and different materials and forms to achieve the optimum fall pattern results (Figure 3.).
Figure 3. A number of prototypes were developed to test materials, wing shapes, flight dynamics and so on.
A range of materials was also tested for use in the wing section of the dataseed. This included testing materials such as masking tape, PTFE tape, cling film, copy paper and tracing paper. From these tests it was decided that the best material for weight for stability in flight was tracing paper. In addition, the surface area and shape of the wing was manipulated in a range of prototypes to alter the dynamic behaviour of each individual dataseed. A parametric design table was developed within SolidWorks that enabled the designers to alter the surface area of the seed to represent the actual data.
A short descriptive text was printed on each dataseed wing to contextualise the object and indicate which instance from the data set each individual seed represented. This addition was intended to facilitate comprehension of the data-object with end-users and to help any would-be data analyst to understand why the falling properties of seeds differed from one another (see Figure 4.).
Flying with data: Openness, forms and understanding
Figure 4. Samples of prototype dataseeds that show the use of materials and the addition of text to indicate data set
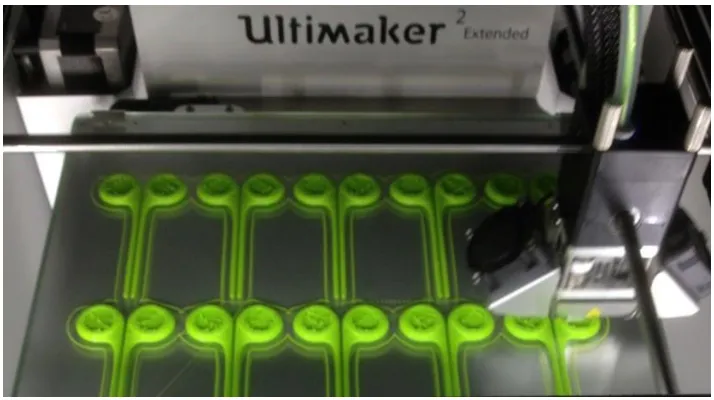
For the rigid spine and body of the dataseeds we used a fused filament fabrication (FFF) additive manufacturing, 3D printing process (see Figure 5.). A range of forms were experimented with to achieve the optimal design and biomimicry provided the best solution; this approach helped to replicate the natural descent angle of a sycamore seed2. We also experimented with a variety of fill
densities, form patterns and scales. In terms of density, the best results were found with a 20% fill structure. In terms of form, we started by using an exact copy of a natural seed and wing size. In using our chosen manufacturing process and range of materials this did not allow us to replicate the natural falling behaviour of a Sycamore seed. However, scaling up the size of the seed, spine and wing did lead to a more natural falling motion when the size was around 200% of the conventional size of a UK sycamore seed. The length of the seed spine was adjusted to support the minimum dataset and maximum dataset without compromising the flight characteristics of the seeds. By changing wing surface area (dictated by the data for one of the age groups) the centre of gravity was altered, leading to a change in speed and rotation in decent. The final range of seeds produced incorporated a solid seed body and spine.
The developed dataseed prototypes were tested and recorded using a high-speed camera (see Figure 6.), and the rapid fabrication technologies used to make the data-objects allowed for the production
of 200 dataseeds (representing a selection of data instances). These were ‘drop’ tested from a
second-storey internal atrium to observe the flying characteristics and variance of the seeds.
Figure 5. 3D printing technologies used to fabricate multiple copies of the dataseeds body and tail sections.
2 The authors have since seen much larger Sycamore type seeds in other countries.
[image:9.595.119.476.507.707.2]Figure 6. High-speed camera technologies used to capture dataseed flight characteristics.
4. Dissemination and Reflections
One of the dissemination events for the dataseeds project was its inclusion in the 2015 Design for Health Conference Exhibition in Sheffield (2015). The dataseeds formed part of a group show of work from artists and designers who were responding to various healthcare issues through their work. This context allowed the authors to focus their search for an interesting/ poignant/ stimulating health related data set to explore an aspect of open public data. During the conference and the subsequent public exhibition, the dataseeds were made accessible to delegates and members of the public who were encouraged to play and experiment with them.
Through observation and informal questioning, the authors identified that people engaged with the dataseed form quite intuitively; this being a rationale for the project as a test-case to explore if the use of a data-driven object might increase understanding and insight to the underlying data through engagement. When people first engaged with the physical objects they recognised the form and the
metaphor but did not initially understand what the seeds represented. However, when ‘flying’ the
seeds (people where encouraged to throw the dataseeds in the air) many people perceived that there were different flying patterns, which led to questioning around why this might be this case. In most cases this then triggered an engagement with the underlying data. In a continuing extension of this work it is recognised that more formal user-centred evaluation of the dataseeds and data-object concept needs to occur.
Both the data-object concept and the dataseed case-study have also been presented at a number of public and academic design and healthcare contexts with enthusiastic interest shown and the authors are keenly aware that there is much potential for further investigation in this area. This project together with more general research into the data-object (Gwilt 2013) to translate complex digital data into physical objects that can be used to aid understanding and simulate conversation around complex digital data has indicated that this approach is particularly effective for engaging with and communicating data to non-specialist audiences. Each data-object is designed with a
Flying with data: Openness, forms and understanding
specific dataset and audience in mind and the authors have drawn up a sequence of guiding principles, and set of questions that should be considered before creating a data-object as a means to aid communication.
Guiding principles and questions for creating a data-object are as follows:
• Consider what the creation/use of a data-object will contribute to the communication of the underlying data and to whom? (If you cannot answer this question stop here!)
• Consider your audience and what their expectations from the data might be?
• Carefully select a relevant data set, paying attention to the credibility of the data source and the usability of the data.
• Carefully examine the chosen data set to identify the significant key message/ messages in the data and to make sure that you understand what the data is communicating.
• Carefully consider how the design choices of any physical form and/or use of visual metaphor relate to the underlying data?
• Where possible involve your user community in all stages of the design and decision making processes.
• Make sure the data object’s form and physical qualities remain faithful to the
statistical variance of the underlying data.
• Consider how the use of any fabrication techniques and choices in material might amplify or sympathetically reflect key trends in the data. Equally consider if there are
any possible negative interpretations that might be drawn from your choices? •
Consider where and how the data-object might be encountered and in what context?
• Consider how the data-object might work with other forms of communication and fit into a long term communication strategy.
To conclude, it is important to stress that the authors of this work do not envisage that the dataobject concept is a way of substituting other forms for communicating data. The data-object should be seen as a technique that when given the appropriate consideration has the potential to add to the understanding and cognition of any given data set. According to Luc Pauwels, editor of
‘Visual Cultures of Science’ (2006) visualisation techniques play an important role in not only
facilitating knowledge but also are an important tool to how we understand and ratify the world around us. It is important to continue to develop and design appropriate methods to help interpret the complex and interrelated digital data-scape for all sectors of the community.
References
Cattrell, A. (2009) Pleasure/Pain. Retrieved December 2016 from http://northings.com/2012/07/10/annie-cattrell/
Design for Health (2015) Retrieved December 2016 from
http://research.shu.ac.uk/design4health/conferences/gallery-d4h2015
Gwilt, I., Yoxall, A., and Sano, K. (2012). Enhancing the understanding of statistical data through the creation of physical objects. In Proc. ICDC2012 (2012), 117–126.
Gwilt, I. (2013) Book chapter Data-objects: sharing the attributes and properties of digital and material culture to creatively interpret complex information, in DigiMedia and Technologies for Virtual Artistic Spaces, Dew Harrision (ed), IGI Global, Pennsylvania, USA
Johnson, S. (1997). Interface culture: how new technology transforms the way we create and communicate, HarperEdge, San Francisco.
Kennedy, H. (2015) Seeing Data: Visualisation design should consider how we respond to statistics emotionally as well as rationally. Retrieved December 2016 from
http://blogs.lse.ac.uk/impactofsocialsciences/2015/07/22/seeing-data-how-people-engage-withdata-visualisations/#author
Kirk, A. (2016) Data Visualisation A Handbook for Data Driven Design, Sage, London, UK. Lima, M. (2009). Information Visualization Manifesto, Visual Complexity VC blog. Retrieved
December 28 2016 from http://www.visualcomplexity.com/vc/blog/?p=644
Mayer-Schönberger, V., & Cukier, K. (2013). Big Data: A revolution that will transform how we live, work and think. London, UK: John Murray.
Miebach, N. (2006) Weather sculptures. Retrieved December 28, 2016 from http://www.nathaliemiebach.com/weather.html
Munster, A. (2006). Materializing New Media: Embodiment in Information Aesthetics, Dartmouth College Press, US.
Pauwels, L. (Ed.) (2006). Visual cultures of science. Lebanon, NH: Dartmouth College Press. Prendiville, A., Gwilt, I., & Mitchell, V. (2017). Making sense of Data through Service Design :
opportunities and reflections. In: Prendiville, Alison and Sangiorgi, Daniela, (eds.) Designing for Service : Key Issues and New Directions. Bloomsbury. (In Press)
Reynolds, A. (2013) Mount Fear East London. Retrieved December 28, 2016, from http://www.abigailreynolds.com/works/44/mount-fear-east-london/#
Sennett, R. (2009) The Craftsman, Penguin Books, London, UK
The Health and Social Care Information Centre, Hospital Episode Statistics for England. Inpatient statistics, 2012-13. Retrieved December 28, 2016 from
(http://content.digital.nhs.uk/catalogue/PUB12566/hosp-epis-stat-admi-ext-caus-2012-13-tab.xlsx Vande Moere, A. (2008) Beyond the Tyranny of the Pixel: Exploring the Physicality of Information
Visualization, Information Visualisation, 2008. IV '08. 12th International Conference. IEEE,DOI: 10.1109/IV.2008.84
Whitelaw, M. (2010) Measuring Cup (Sydney, 1859-2009). Retrieved December 28, 2016, from http://mtchl.net/measuring-cup/
Yau, N. (2013). Data points: Visualization that means something. Indianapolis, IN: John Wiley & Sons.
About the Authors:
Nick Dulake Senior industrial designer at Design Futures, Sheffield Hallam University
Dr Ian Gwilt Professor of Design and Visual Communication, Art and Design Research
Centre at the Sheffield Hallam University