Cornerstone: A Collection of
Scholarly and Creative Works for
Minnesota State University,
Mankato
All Theses, Dissertations, and Other CapstoneProjects Theses, Dissertations, and Other Capstone Projects
2014
The Development of a Teacher-Rating Measure of
Positive Behavior
Sara Ann Ebsen
Minnesota State University - Mankato
Follow this and additional works at:http://cornerstone.lib.mnsu.edu/etds
Part of theEducational Methods Commons,School Psychology Commons, and theTeacher Education and Professional Development Commons
This Dissertation is brought to you for free and open access by the Theses, Dissertations, and Other Capstone Projects at Cornerstone: A Collection of Scholarly and Creative Works for Minnesota State University, Mankato. It has been accepted for inclusion in All Theses, Dissertations, and Other Capstone Projects by an authorized administrator of Cornerstone: A Collection of Scholarly and Creative Works for Minnesota State University, Mankato.
Recommended Citation
Ebsen, Sara Ann, "The Development of a Teacher-Rating Measure of Positive Behavior" (2014).All Theses, Dissertations, and Other Capstone Projects.Paper 373.
The Development of a Teacher-Rating Measure of Positive Behavior
by
Sara Ann Ebsen
A dissertation submitted to the faculty of Minnesota State University, Mankato
In partial fulfillment of the requirements for the degree of Doctor of Psychology
MINNESOTA STATE UNIVERSITY, MANKATO
The Development of a Teacher-Rating Measure of Positive Behavior Sara A. Ebsen
This dissertation has been examined and approved by the following members of the dissertation committee.
________________________________ Kevin J. Filter, Ph.D., Advisor
________________________________ Daniel Houlihan, Ph.D., Committee Member
________________________________ Lisa Perez, Ph.D., Committee Member
________________________________ Teresa Wallace, Ph.D., Committee Member
____________________ Date
Copyright © 2014 by
ABSTRACT
Positive Behavior Interventions and Supports (PBIS) is a systems-level prevention model for problem behavior in K-12 schools. As the number of schools implementing PBIS continues to increase, so does the number of evaluations of its fidelity and effectiveness. After summarizing the test construction, purpose and function, and psychometric properties of commonly used measures in PBIS, the current study examines the development of a measure of positive behavior that can be used to evaluate outcomes of PBIS implementation. Research questions focus on (a) themes of positive behavior, (b) internal consistency of the measure, (c)
correlation and reliability over time, and (d) the analysis of the relationship
between fidelity of implementation and levels of positive behavior. Results indicate that six themes of positive behavior could be extracted. The measure was found to have acceptable internal consistency and test-retest reliability. Few statistically significant relationships could be found between levels of implementations and rates of positive behavior.
TABLE OF CONTENTS PAGE ABSTRACT……….………….iv LIST OF TABLES……….ix LIST OF FIGURES………...x ACKNOWLEDGMENTS………xi CHAPTER 1-INTRODUCTION………..1 Research Questions………...……2
CHAPTER 2-LITERATURE REVIEW………..…..3
Overview of PBIS………3
Evidence-Based Practice………5
Data-Based Decision Making………6
Systems Perspective………..6
Outcomes……….7
Assessment Measures and Evaluation of PBIS……….7
Assessment of Fidelity of Implementation……….8
School-wide Evaluation Tool………..8
Team Implementation Checklist………11
Self Assessment Survey………11
The School-wide Benchmarks of Quality………..……12
Implementation Phases Inventory………13
Evaluation of Outcomes………...15
Office Discipline Referrals………..16
School-wide Information System for ODRs……….…18
Suspension Rates……….……20
Academic Achievement………21
Teacher Perception of Behavior Change. ……….22
Improved Social Behavior………..23
Positive Behavior Construct………..24
Purpose of Present Study………28
CHAPTER 3-METHODOLOGY……….…..30
Research Methods………...30
Participants……….30
Measures……….…….31
Positive Student Behavior Scale (PSBS)………31
School-wide Evaluation Tool………36
Procedures………..…37
Data Analysis ……….38
CHAPTER 4-RESULTS………39
Confirmatory and Exploratory Factor Analyses………..………….39
One Factor Model………40
Five Factor Model………40
Exploratory Factor Analysis………..41 Examination of Condensing the Original Survey and Accuracy of
Addressing Levels of Positive Behavior………47
Analysis of Correlation Across Multiple Ratings…..………50
Analysis of Fidelity of Implementation and Levels of Positive Behavior……..52
Regression Analysis..……….53
Cohort 8 Analysis……….53
Cohort 7 Analysis………... ……….54
Analysis of Variance………...55
Split-Group ANOVA……….55
ANOVA Using Cut-Off Scores……….57
CHAPTER 5-DISCUSSION………59
Discussion of Findings……….59
Themes of Positive Behavior………59
Analysis of Internal Consistency……….61
Analysis of Test-Retest Reliability……….63
Analysis of Fidelity and Behavior Levels………...64
Implications……….65
Theoretical Model versus Statistically-Derived Model……….66
Acknowledgement of Limitations……….67
Recommendations for Future Research………68
Conclusion………69
REFERENCES……….70
APPENDICES A. Example Teaching Matrix………...78
B. Consent Form ………..…..79
C. Positive Student Behavior Scale…………..………..….80
D. IRB Approval Letter………84
LIST OF TABLES
Table 1. Behaviors and Definitions………..27
Table 2. School Information………..30
Table 3. Staff Information………...31
Table 4. Descriptive Statistics for the PSBS Responses by SHUCK Subscale…………..35
Table 5. Recommended Values………40
Table 6. One Factor and Five Factor Models………...41
Table 7. Total Variance Explained……….42
Table 8. PSBS Rotated Factor Loadings……….44
Table 9. Internal Consistency of Scales……….48
Table 10. Item-Total Statistics for the PSBS………..……….49
Table 11. Pearson (r) Correlations………52
Table 12. Cohort 8 Model Summary……….54
Table 13. Cohort 8 Regression Analysis……….54
Table 14. Cohort 7 Model Summary……….55
LIST OF FIGURES
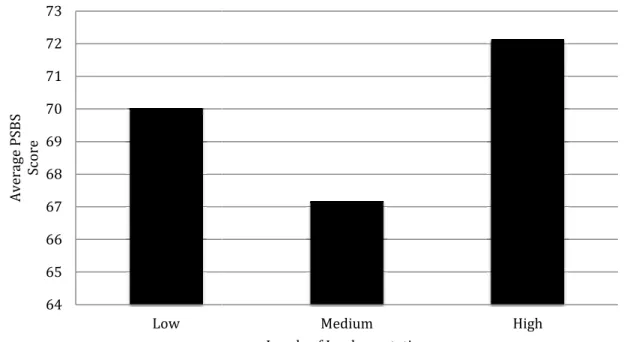
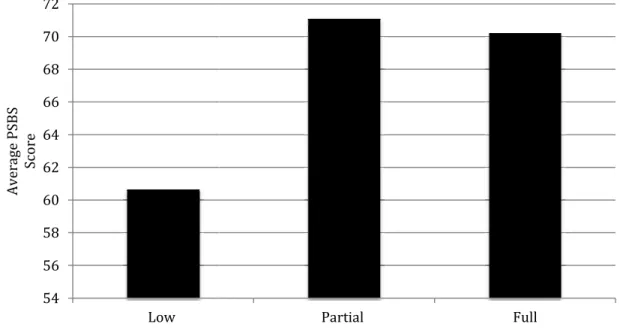
Figure 1. Overall Measure Distribution………..36 Figure 2. Average PSBS Scores for Low/Medium/High Implementation………...56 Figure 3. Average PSBS Scores for Low/Partial/Full Implementation………...58
ACKNOWLEDGEMENTS
I have had the pleasure of being a member of the first School Psychology Doctoral cohort at Minnesota State University, Mankato. Over the past seven years, I have had an amazing experience. As I reach the end of this journey, there are several people that I feel truly blessed to have had the pleasure of working with. This work could not have been possible without the support, encouragement, and
contributions of my advisor, Dr. Kevin Filter. I am extremely grateful to Dr. Filter for devoting so much time and effort to this work. This study would not have been possible without his assistance. I am also appreciative to have had an amazing dissertation committee. Thank you Dr. Houlihan, Dr. Perez, and Dr. Wallace for all of your efforts and supports.
I am also indebted to my fellow doctoral students for their assistance in data collection, data analysis, and ongoing support. Specifically, I recognize Dr. Julene Nolan, Dr. Angela Christenson, and Dr. Rachel Youngblom. I would like to thank all participating staff and schools. In addition, I would like to acknowledge all faculty in the Psychology Department at Minnesota State University, Mankato. I have learned more in this chapter of my life than ever before; all of which is due to your
willingness to bestow upon me your knowledge and expertise in the field. Finally, I give special thanks to my family, boyfriend Peter, and amazing friends for forever being my greatest cheerleaders.
This dissertation is dedicated to my parents, John and Shirley Ebsen, for their steadfast support and unconditional love. Thank you for inspiring me in everything that I do.
CHAPTER1 - INTRODUCTION
Numerous measures exist to examine the fidelity of implementation and the outcomes of Positive Behavior Interventions and Supports (PBIS). These existing tools assess a wide variety of constructs. Several of these measures have proven to be valid and reliable in the assessment of PBIS. Although some measures offer promising psychometrics, others have little to no evidence. Therefore, schools may be using measures to guide PBIS implementation that have not yet been validated for such usage. Future research can aid in solving this issue by conducting psychometric evaluations of such measures. Further, conducting psychometric evaluations prior to releasing new measures will prevent this issue from occurring in the future.
Although decreases in problematic behavior have been noted in the PBIS research, changes in positive behavior have been overlooked, despite the fact that PBIS involves teaching and reinforcing positive behavior expectations. Positive social behaviors should include behaviors that are viewed as acceptable, appropriate, and important by school staff. In addition, these behaviors should be easily observable and fit within a theoretical
framework of the concept of positive behavior. The evaluation of positive behaviors as an outcome is an obvious fit for PBIS, as it aligns with the very basis of the framework. If PBIS teaches and rewards positive behaviors, it would be reasonable to address these behaviors as an outcome.
The overall purpose of the study was to develop a psychometrically sound
questionnaire that measures positive behaviors in K-12 schools. The study addressed four research questions.
Research Questions
1. Can the findings from the present survey confirm themes of positive student behavior in schools that have been developed based on previous findings? 2. Can the Positive Student Behavior Scale (PSBS) be condensed to contain fewer
items, but still accurately address levels of positive behavior?
3. Does a significant correlation exist across multiple ratings over of the PSBS over a short period of time?
4. Do schools with high level of PBIS implementation fidelity report higher levels of positive behavior on the PSBS?
CHAPTER 2-LITERATURE REVIEW Overview of PBIS
Positive Behavior Interventions and Supports (PBIS) is described as a preventative, proactive, evidence-based, outcomes-focused, continuous and multi-systemic intervention in schools (Scott & Barrett, 2004; Sugai & Horner, 2002; Sugai & Horner, 2006). PBIS is preventative and universal in nature, with outcomes focused on changing problem behavior while achieving and sustaining positive social and learning changes (Office of Special Education Programs [OSEP] Center on Positive Behavior Supports, 2009; Sugai & Horner, 2002; Sugai & Horner, 2006). According to Carr et al. (2002), the emergence of PBIS can be traced back to three philosophical foundations. First, and perhaps most notably, it is rooted in applied behavior analysis, which is reflected in the conceptual
framework and assessment and intervention strategies of PBIS. Baer, Wolf, & Risley (1968) were the first to discuss the multiple dimensions of applied behavior analysis, stating that socially important issues be addressed using applied, behavioral, analytic, technological, conceptual, effective, and generality principles. Aside from incorporating these principles, PBIS also utilizes other applied behavioral analysis elements including a three-tier
contingency, shaping, fading, prompting, and reinforcement (Carr et al.,2002; Dunlap, Carr, Horner, Zarcone, & Schwartz, 2008). Second, the normalization/ inclusion movement largely shaped PBIS (Carr et al., 2002). The movement called for the integration of students with disabilities into the general education classroom and equal opportunities for all students (normalization). As a result, specialized school supports were integrated in general education (inclusion). Finally, PBIS is rooted in the person-centered values, where
a team-based approach is used to consider an individual’s needs and develop intervention strategies accordingly (Anderson & Freeman, 2000; Carr et al.).
At the primary prevention level, PBIS is implemented with all students across all school-related settings (Horner et al., 2009; Sugai & Horner, 2002; Sugai & Horner, 2006). Primary prevention is managed by a data-based decision making team, which oversees the following critical features: (a) three to five positively stated expectations/rules, (b)
procedures for teaching and modeling behavior expectations, (c) procedures for rewarding and/or acknowledging appropriate behaviors, (d) procedures for discouraging
inappropriate behaviors, (e) ongoing assessment and problem analysis, and (f) plans for evaluation of outcomes and implementation using data-based decision-making (George, Kincaid, & Polland-Sage, 2009; Sugai & Horner, 2002).
In order to accommodate students that do not respond to universal supports, PBIS also includes secondary and tertiary tiers of support (Horner, et al., 2009; Sugai & Horner, 2002; Sugai & Horner, 2006). Interventions at the secondary prevention-level are
implemented with the small percentage of students that do not respond to primary prevention (usually 10%-15%). At this tier, interventions are linked to the universal level but typically include more adult involvement and increased monitoring. At the tertiary level, PBIS is highly individualized and intensive and is targeted at students that were unresponsive at the first two levels. Across all levels of implementation, the PBIS
framework consists of four critical elements: evidence-based practice, data-based decision making, systems-level implementation, and outcomes, which are described below.
Evidence-Based Practice
PBIS is rooted in applied behavior analysis, with an emphasis on the interaction between an individual’s behavior and the surrounding environment (Carr et al., 2002; Dunlap et al., 2008). In order to maximize the effectiveness of the intervention, practices that are research-validated are used. Sugai and Horner (2006) recommend the use of practices that are effective, efficient, relevant, and durable.
Historically, school discipline policies have been largely “reactive”, meaning that schools do not respond to behavior concerns until after a school rule has been broken. However, research indicates that punishment is ineffective when used in a reactive environment and can often lead to escalations in problematic behaviors (Mayer, 1995; Shores et al., 1993). Thus, alternative approaches and practices began to be explored. “Over the past 15 years, greater attention has been directed toward approaches that increase the availability, adoption, and sustained use of validated practices and applying what we know about the science of human behavior to improve the effectiveness and efficiency of school systems and organizations” (Sugai & Horner, 2006, p. 246). As a result, there has been a push for schools to adopt proactive approaches to discipline problems. In 1997, the Individuals with Disabilities Education Act (IDEA) defined the terms “positive behavior supports” and “positive behavioral interventions and supports”. Similarly, the US Department of Health and Human Services (2001) called for priorities to be given to efforts focusing on primary prevention, where positive climates can be established and
Data-Based Decision Making
The selection of new practices should be based on data. In a PBIS framework, data is also used to guide decisions at multiple levels, including school-wide, classrooms/grades, non-classroom settings, and with individual students (Sugai & Horner, 2002). PBIS teams can use the Team Initiated Problem Solving process (TIPS) where the collection and use of data allows for status review and problem identification, development of hypotheses, selection of solutions, implementation, and evaluation (Newton, Horner, Todd, Algozzine, & Algozzine, 2012). The use of TIPS allows for early identification and regular assessment of student behaviors. Perhaps most importantly, data is also used to evaluate the outcomes and implementation of PBIS. In order for this to be done effectively and efficiently, teams should meet regularly to review data that has been collected across multiple formats. The data reviewed and used include data on fidelity of implementation and outcomes (e.g., behavior and achievement).
Systems Perspective
Support at the systems level is imperative for the effective and durable
implementation of PBIS (OSEP, 2009). PBIS is implemented across all systems in a school including classroom systems, non-classroom systems (e.g., halls, lunchroom), and
targeted/individual student systems (e.g., individualized support plans). The cornerstone of the systems approach is the development of a leadership team that will guide and
organize implementation (Sugai & Horner, 2002; Sugai & Horner, 2006). According to Sugai and Horner, the team “coordinates local coaching, training, and evaluation activities, and establishes sustainable political, visibility, and funding supports” (2006, p. 250). The team
should be representative of staff in the school in order to ensure that all voices are heard when planning for PBIS activities. It is also imperative for an administrator to regularly attend the team meetings in order to ensure that the school and its resources are committed to PBIS. Another major task of the team is to develop an action plan used to guide implementation. It is also the responsibility of the leadership team to establish an evaluation process, where outcome data can be used to guide decisions.
Outcomes
In order for schools to effectively evaluate PBIS, they need to carefully consider, acknowledge, and define outcomes that are measurable and achievable (Sugai & Horner, 2002; Sugai & Horner, 2006). All stakeholders should endorse these outcomes. According to OSEP (2004), “Valued outcomes include increases in quality of life as defined by a
school’s and/or individual student’s unique preferences and needs and by positive lifestyle changes that increase social belonging” (p. 10). Recent research has focused on outcomes related to academic achievement, social skills, decreases in problematic behaviors,
attendance and tardiness, rates of expulsions and suspensions, and office discipline
referrals. It is notable, however, that research has not addressed improvements in positive social behavior as an outcome in PBIS.
Assessment Measures and Evaluation of PBIS
There are multiple levels at which PBIS is evaluated. The first type, research-based evaluation, serves the purpose of disseminating information about PBIS implementation and effects to the broader academic and scientific community. There have been numerous single-subject studies (see Solomon, Kline, Hintze, Cressey, & Peller, 2012 for a
meta-analysis) and group design studies, including randomized control trials (Bradshaw, Mitchell, and Leaf, 2010; Horner et al., 2009), that have demonstrated the effectiveness of PBIS using scientific-standards of research. The second type of evaluation, local
implementation evaluation, is conducted to improve locally-implemented PBIS in a school. This process is managed by a team in the school and is part of a continuous-improvement process. The third type, regional systems-based evaluation, is similar to local
implementation evaluation but serves the purpose of supporting and improving
implementation across multiple school that is coordinated at a district, regional, or state level (see Simonsen et al., 2012, for an example of Illinois’ evaluation of its efforts to coordinate PBIS).
The three levels of PBIS evaluation deal with two primary categories of data: (a) fidelity of implementation and (b) outcomes. The following section reviews the specific types of data used in evaluation of PBIS.
Assessment of Fidelity of Implementation
Several assessment tools exist to measure the fidelity of implementation of PBIS. The Team Implementation Checklist, Self Assessment Survey, School-wide Evaluation Tool, School Safety Survey, and School-wide Benchmarks of Quality have been widely regarded as the most useful tools available (Childs, Kincaid, & Goerge, 2010; OSEP, 2009) and are available for access and use on www.pbisassessment.org. These tools, in addition to the recently developed Implementation Phases Inventory, will be described below.
School-wide Evaluation Tool. The School-wide Evaluation Tool (SET) is a measure
Lewis-Palmer, Todd, & Horner, 2001). The SET is designed to be used in conjunction with other measures to establish multiple perspectives of implementation. Results of the SET are used to assess features of PBIS that are in place, establish annual goals, evaluate
ongoing implementation, revise procedures as needed, and draw comparisons across years of implementation. A trained outside observer visits the school site to annually assess implementation across 28 items addressing seven key areas of PBIS (expectations defined, expectations taught to all students, procedures for rewarding appropriate behaviors, systems for responding to behavior violations, procedures for data-collection and decision making, management systems, and district support). Data are collected through the use of direct observation, review of permanent products, and interviews with administration, teachers, staff, team members, and students. Evaluator site visits for completing the SET generally take about two hours to complete. Each of the 28 items is given a score between 0 and 2. Summary scores are calculated across each of the seven areas (subscales) and
schools are given a total summary score.
In contrast to many of the other implementation measures of PBIS, the SET has been described primarily as a research tool. There are a few states that use it systematically for their regional systems-based evaluation (see McIntosh, Filter, Ryan, Bennet, & Sugai [2010] for an example of Minnesota’s efforts to use SET data statewide) but it is sufficiently time and resource-intensive as to be prohibitive for many large scale evaluations. The SET has been used as an evaluation tool in several published evaluations of PBIS (e.g., Horner et al., 2009; Bradshaw, Reinke, Brown, Bevans, & Leaf, 2008).
The SET has strong psychometric properties. Horner et al. (2004) found that the SET had acceptable internal consistency, with an overall alpha of .96. Other reliability coefficients were also high, with average test-retest found to be .97, with an interobserver agreement of 99%. Measures of validity compared the SET to the Effective Behavior Support Survey (EBS; since renamed as the Self-Assessment Survey), which is a fidelity of implementation survey completed by all staff in a school. Construct validity between the two measures was found to be positively correlated at Pearson r=.75 (p .01).
Intercorrelations between the seven subtests of the SET were found to be high to moderately high (with a range of r=.44 to r=.81 and a median of r=.65). A paired t-test revealed that the SET was sensitive to change.
A recent study by Vincent, Spaulding, and Tobin (2010) reexamined the
psychometric properties of the SET. Internal consistency data resembled that of Horner et al., (2004), with an overall reliability coefficients were found to be α=.850 for elementary schools , α=.854 for middle schools, and α=.899 for high schools (it should be noted that the original study included only elementary and middle schools). Deviations were noted in high schools on the subscales of Behavioral Expectations Taught and Consistent Reward Systems. When compared to the Team Implementation Checklist (Sugai, Horner, & Lewis-Palmer, 2002), a self-assessment of similar PBIS implementation domains, moderate to high correlations were found.
Although the SET is widely used, further evaluation of its psychometric properties is needed. In the original study, Horner et al. (2004) used only elementary and middle
eight schools were used in the analysis of test-retest reliability). Other concerns regarding implementation have been raised. Vincent et al. acknowledged the variability in training that may exist (2010). Additionally, documentation is lacking regarding the extent to which procedures follow those of the training manual. Finally, as the number of schools implementing PBIS drastically increases, the likelihood of conducting on-site evaluations at each school may become increasingly more difficult due to the time intensity of the
measure (Cohen, Kincaid, & Childs, 2007).
Team Implementation Checklist. The Team Implementation Checklist (TIC) is a
self-assessment measure designed to be completed by the leadership team on a quarterly basis (Sugai et al., 2002). The TIC is regarded as a quick and cost-effective tool for guiding school-wide decision-making. It is not generally used in research-quality outcome studies of PBIS. The TIC contains a total of 17 items that are ranked using a three point scale (Achieved, In Progress, or Not Yet) (Barrett et al., 2008; Bradshaw, Debnam, Koth, & Leaf, 2008; Sugai et al., 2002). Although the TIC is widely used, little research exists on its psychometric properties. Analysis of a modified version of the TIC, the Maryland Team Implementation Checklist, revealed a high internal consistency for the measure
(Cronbach’s alpha= .93) (Barrett et al., 2008).
Self Assessment Survey. The Self Assessment Survey (SAS) was originally named
the Effective Behavior Supports (EBS) survey. The SAS is a measure used by schools to assess the current implementation of various behavioral supports (Sugai, Horner, &Todd, 2000). The survey is completed annually by school staff and addresses school-wide
hallways, cafeterias), and targeted systems for individual students. On each of the survey’s 18 items, school staff independently evaluate the current status of a school on a three point scale (In Place, Partially In Place, and Not In Place) and the priority for improvement (High, Medium, and Low). Results of the SAS are analyzed and used by the school for decision-making and action plan development.
Saffran (2006), in a paper describing how the SAS is used by schools during the action-planning process, reported in internal reliability alpha coefficient of .85 for the current status index and .96 for the improvement priority index. Subscale reliabilities for the current status index ranged from .60 to .75 and subscale reliabilities for the priority status index range from .81 to .92. This was based on responses from staff in two
elementary schools and one middle school in a rural Midwestern city.
When compared to similar measures such as the SET, two main differences are noted (Horner et al., 2004). First, the SAS relies on reports of local staff. Second, the SAS examines several different features than the SET, including family involvement and
continued training. However, since it is a self-evaluation, it is not regarded as being as valid as the SET, which is an external evaluation.
The School-wide Benchmarks of Quality. The School-wide Benchmarks of Quality
(BoQ) is a self-report tool designed to allow schools to assess their own strengths and weaknesses of implementation (Kincaid, Childs, & George, 2005). Development of the measure included generation of items based off the Florida PBS Training Manual, expert ratings on items, cognitive interviewing, and a pilot study. The scale contains 53 items addressing 10 key domains of PBIS implementation (PBS team, Faculty Commitment,
Effective Discipline Procedures, Data Entry, Expectations and Rules, Reward System, Lesson Plans, Implementation Plans, Crisis Plans, and Evaluation). The BoQ consists of three documents; coaches complete the Coach Scoring Form while team members complete the Team Member Rating Form. Using information from these two forms, the coach then completes the Team Summary Report, while noting and discussing any discrepancies with team members. Items are rated using a three point scale (not in place, needs improvement, or in place), with a total possible score of 100. A cutoff score of 70 is used, with schools scoring above this being considered “high implementers” and those below “low
implementers”.
Research indicates that the BoQ has strong psychometric properties (Cohen et al., 2007). Internal consistency for the measure was high, with an overall Cronbach’s alpha of 0.96. Test-retest was found to be 0.94 (p< 0.01), with 28 coaches participating and one week between administrations. A test of inter-rater reliability revealed a correlation of 0.87 (p<.01). The relationship between the BoQ and the SET was examined in order assess convergent validity. A moderate overall correlation of 0.51 (p<.05) was found between the two measures, indicating the measurement of similar constructs with differing specificities. According to authors, the BoQ is better able than the SET to discriminate among schools that are implementing PBIS with high fidelity. Therefore, the BoQ is often regarded as a more efficient and potentially more sensitive alternative to the more traditional SET for research-level evaluations.
Implementation Phases Inventory. The Implementation Phases Inventory (IPI)
school’s phase of PBIS implementation (Bradshaw et al., 2009). The measure was
developed over the course of six meetings, where existing fidelity measures (e.g., SET, TIC) were reviewed and a list of key features was established. These key features were then categorized into four successive phases to make up the IPI: (a) preparation, (b) initiation, (c) implementation, and (d) maintenance. The IPI contains 44 items that the PBIS coach or other facilitator rate as 0 (not in place), 1 (partial), or 2 (full implementation). The IPI is designed to be completed twice a year. In order to advance to the next stage of
implementation, a school must receive a score of 80 on the previous phase. Overall, scores on the IPI range from 0% to 100%.
One study has examined the psychometric properties of the IPI. Results indicated a strong internal consistency with a Cronbach’s alpha of .94 (Bradshaw et al., 2009). Alphas for the four subscales ranged from .65 to .91. Thirty-three PBIS coaches (40 schools) were used in the evaluation of test-retest reliability which was found to be r(40)=.80, p≤.01 (with a three week lapse between administrations). Finally, inter-rater reliability was examined using data from 33 PBIS coaches (participants in the test-retest study) and 33 team leaders. Results indicated the IPI has moderate inter-rater reliability, r(34)=.61, p≤ .01.
School Safety Survey. The School Safety Survey (SSS) provides a basic index of
school safety and is used to guide training and support needs regarding school safety and violence prevention (Sprague, Colvin, & Irvin, 1996). The SSS contains 33 items and is divided into three sections, Assessment of Risk Factors for School Safety and Violence (17 items), Assessment of Response Plans for School Safety and Violence (16 items), and
Comments on School Safety and Violence. Each item is ranked using a five point scale (not at all, minimally, moderately, extensively, don’t know). The SSS produces two scores, a Risk Factor score and a Protective Factor score, with higher scores indicating higher levels of these areas. The SSS is completed by a minimum of five school personnel which must minimally include at least one administrator, one custodial worker, one
supervisory/classified staff member, one certified member, and one office staff member. Little data exists on the survey’s psychometric properties, although an internal consistency of .90 has been reported (as cited in Horner et al., 2009). Although the SSS is available for schools to use on the website www.pbisassessment.org, a site for fidelity of
implementation measures of PBIS, it has also been used as an outcome measure in large scale evaluations of PBIS (see Horner et al., 2009).
Evaluation of Outcomes
There are a number of valued outcomes of PBIS. The most commonly reported outcomes relate to student behavior. However, it can be argued that the primary goal of schools is to maximize learning outcomes. Therefore, it is also important to measure the effect of PBIS on academic achievement. It is not assumed that the relationship between the social behavior changes inherent in PBIS and the improvement in academic achievement would be direct. Rather, a reduction in time spent managing discipline problems in a school is believed to lead to an increase in instructional time across a school, which in turn leads to more academic achievement (Lassen, Steele, & Sailor, 2006).
Regarding behavior outcomes, most outcome measures in PBIS deal with decreases in problem behavior along with corresponding decreases in things like suspension and
expulsion. It is notable that there exists no current measure of positive behavior in PBIS. A number of the behavior outcomes measures most commonly cited in PBIS literature will be reviewed in the following section.
Office Discipline Referrals. In 2000, Sugai, Sprague, Horner, and Walker defined
Office Discipline Referrals (ODRs) as “an event in which (a) a student engaged in a behavior that violated a rule/social norm in the school, (b) a problem behavior was observed by a member of the school staff, and (c) the event resulted in a consequence delivered by administrative staff who produced a permanent (written) product defining the whole event” (p. 96). ODRs are a practical outcome measure in schools as they are easily
documented and maintained by school staff. When an ODR occurs, data on the student(s), referring teacher, time of day, location, and nature of the problem can also recorded (Irvin et al., 2006). ODRs are widely used by school staff in order to identify patterns in
problematic behavior, monitoring individual student behavior, and as an outcome measure for school-wide behavioral interventions as they assess the school’s overall behavioral climate (Irvin, Tobin, Sprague, Sugai, & Vincent, 2004).
When a three-tier response-to-intervention framework is implemented along with PBIS, schools often utilize cutoff scores in order to identify students in need of additional supports (Hawken & Horner, 2003). Two to five office discipline referrals is a common cutoff for tier two services, with six or more referrals typically indicating tier three services. In an extensive review of ODR data, McIntosh, Frank, and Spaulding (2010) identified trajectories and specific behaviors that predicted individual students’ tiers of services. In the analysis of trajectories, no sharp rise in mean ODR rates across the school
year was observed. One ODR became an adequate predictor of tier two services at the end of December (however it should be noted that little interpretation can be made off of a single event). The presence of two ODRs became a highly accurate predictor of tier three services at the end of October. In addition to ODR trajectories, 10 behaviors were also identified as significant predictors of two or more ODRs, with the most significant predictor being the display of gang signs. Finally, a predictor of two or more ODRs by October and a reported act of physical aggression or disrespect were identified as the highest combined predictor of tier three membership.
In order to assess the validity of ODRs for PBIS and other school-wide behavioral interventions, Irvin et al. (2004), utilized Messick’s Unified Approach to Construct Validity. Messick’s framework is applicable for measures used in educational and psychological assessments. Consistent with Messick’s approach, Irvin et al investigated four areas of ODRs (a) Evidence for interpreting the meanings of ODRs, (b) Evidence for the relevance, use, and utility of ODRs, (c) Foundations for value interpretations of ODR measures, and (d) Consequences of using school-wide ODR measures.
The analysis revealed ODRs were correlated with behavior rates, with high ODR rates persisting in schools where school-wide behavior support interventions are not implemented. Thus, ODRs were found to be accurate indicators of school-wide behavior climates (Irvin et al., 2004). Second, ODRs were found to be sensitive to intervention effects and an effective outcome measure for behavior supports. Third, correlations were found between staff perceptions of behavior change in schools and ODR rates. Further, school staff reported high rates of social validity in ODR usage. Finally, ODRs were found to be
effective for guiding data-based decision making and school-wide intervention planning. ODRs were found to be predictive of other negative behaviors in school such as drug use, unexcused absences, conduct problems, defiance of authority, disrespect, and
violent/rebellious behaviors.
Nelson, Benner, Reid, Epstein, and Currin (2002) investigated the convergent validity of ODRs with the Teacher Report Form (TRF), a scale examining the internalizing and externalizing behaviors of students identified as at-risk for behavior problems. Results indicated that ODRs failed to identify a large number of students in need of intensive interventions. This may be due to the fact that in some cases ODRS may underrepresent problem behaviors and internalizing behaviors are often not referred to the office (Irvin et al., 2004).
School-wide Information System for ODRs. Sprague, Sugai, Horner, & Walker (1999) reported that many schools were not recording and tracking ODR data
systematically and were even discarding data at the end of each school year. Therefore, many schools were not utilizing ODR data. As a result, it was determined that a functional system for ODR data collection and analysis was needed. The School-wide Information System (SWIS) is a widely-used web-based data system used to enter, organize, manage, and report discipline data through electronic records. Administrative support, staff buy-in, levels of behavior violation, consistent consequences for violations, and active teaching of behavior expectations are key points in SWIS use. SWIS was created to improve ODR referrals across two main areas. First, SWIS was developed in an effort to increase the effectiveness of reporting ORD data by the creation of a comprehensive, standardized
protocol (May et al., 2002). Standardized reports summarize ODR rates at the school, classroom, and individual levels. Information is obtained on times of day, settings, days of the week/month, and problem behavior.
Secondly, SWIS was created to be a more efficient method of reporting, by minimizing the efforts in reporting, managing, and using ODR data (May et al., 2002). A SWIS facilitator provides a school with technical support and direct training in computer software and data-based decision making. Data from SWIS reports can be used to improve school discipline practices, intervention planning and monitoring of individual students, reporting discipline data at the districts, state, or school level, and in the interpretation of data across years or in comparison to schools within the state/district (Irvin et al., 2006).
As a result of PBIS implementation, several studies have indicated a reduction in ODR rates reported through SWIS (Childs et al., 2010; Lassen et al., 2006). Childs found that one year of training in PBIS lead to a 33% decrease in ODR rates (2010). The mean difference in ODRs in baseline and year one was found to be 45.01 per 100 students (SD=101.3, p=.001). Lassen et al., found that the number of ODRs per student was significantly reduced each year across three years of implementation. In a randomized, waitlist controlled study, Horner et al. (2009), lower ODR rates were noted in schools that received training in PBIS.
Irvin et al. (2006), examined participation and perceptions of SWIS utility. Results indicated that most schools enter ODR data at least on a weekly basis, with entry time ranging from 10 to 60 minutes. Respondents also reported that SWIS requires relatively low effort to use and works “adequately” to “exceptionally”. Finally, the majority of
respondents rated SWIS as increasing the effectiveness and efficiency of decision making, with data being accessed at a weekly to monthly basis in most schools. Using Messick’s framework, Irvin et al., reported that SWIS met basic validity criteria for educational assessment.
In an examination of the validity of ODRs, Pas, Bradshaw, and Mitchell (2011) compared rates of ODRs as reported through SWIS to teacher reports of students ODR rates. Results indicated that the two sources were significantly to moderately correlated (r=.57, p<.01). In 94.1% of cases, teachers were in agreement with SWIS data regarding students that had medium/high referrals (two or more ODRs). Cohen’s kappa was also calculated and found to be .57 (p<.01), revealing a moderate agreement while accounting for chance. In addition, each source of data was compared to the Teacher Observation of Classroom Adaptation-Checklist (TOCA-A), a validated assessment of student classroom behaviors in the areas of disruptive behaviors, concentration problems, and prosocial behaviors. All correlations were found to be moderate and significant at p<. 01, with rates of .34 for disruptive behaviors, .27 for concentration problems, and -.29 for prosocial behaviors for teacher reports. In comparison to SWIS data, correlations were found to be
r=.38 for disruptive behaviors, .29 for concentration problems, and -.31 for prosocial behaviors.
Suspension Rates. In addition to reporting and monitoring office discipline
referrals, many schools implementing PBIS also track suspension rates as an outcome. Research indicates that lower suspension rates are associated with PBIS implementation (Barrett et al., 2008; Childs et al., 2010; Lassen et al., 2006). In a repeated measures
analysis, Barrett et al. (2008) found a significant reduction in suspension rates following one year of training in PBIS. Lassen et al. (2006), investigated suspension rates across baseline and three years of PBIS implementation. Results indicated that suspension rates significantly decreased with each year of implementation. Childs et al. (2010), examined whether implementation of PBIS lead to a decrease in the number of days of in-school (ISS) and out-of-school suspension (OSS). Results indicated a 16% average reduction in the number of days of ISS following one year of PBIS implementation. However, it was also found that days of OSS increased by 2% following one year of initial implementation. A t-test revealed that there was no statistically significant difference in rates between baseline and year one of implementation.
Academic Achievement. PBIS was intended to improve the overall effectiveness of
schools as a learning environment by increasing the amount of instruction time in the classroom (Horner et al., 2009). In addition, PBIS intends to improve the level of student academic engagement during classroom instruction. Several studies have investigated the relationship between PBIS and changes in academic performance. In order to accomplish this, student performance on standardized achievement test is often assessed.
Horner et al. (2009), conducted a randomized, wait-list controlled trial to assess the impact of PBIS on academic achievement, where schools in the treatment group received PBIS training during year one and control/delay schools received training one year later (year two). The percentage of third graders meeting state reading standards was used a measure. A statistically significant difference in percentages from year one to year two in the treatment group was found. A significant difference was also found between the two
groups following year two. Similarly, Childs et al. (2010), found that in comparison to schools not implementing PBIS, schools implementing the intervention in Florida had higher percentages of performance at grade level on the state’s comprehensive reading assessment.
Sadler and Sugai (2009) noted “dramatic” changes in kindergarten students meeting DIBELS benchmarks following the implementation of PBIS. A relationship between
behavior and academic performance was also found, where students with fewer discipline referrals were likely to score higher on reading assessments. For example, fifth graders that received one or fewer ODRs scored 8 points higher on DIBELS measures. Lassen et al. (2006) also noted a connection between behavior and academic achievement, stating that disruptive behavior is among several factors that can account for students performance on such measures, as it typically results in a loss in instruction time which can compromise student learning. According to Lassen et al., interventions that recover and maximize instruction time and decrease disruptive behaviors should lead to an increase in student academic performance (2006). Results from the study indicated that standardized scores in mathematics increased significantly over three years of PBIS implementation. Scores in reading decreased in the initial year of implementation then increased from year one to three. However, these increases were not significant.
Teacher Perception of Behavior Change. Tobin, Lewis-Palmer, and Sugai (2002)
investigated whether teacher perceptions of behavior change over a two year period were consistent with actual rates. Over the two years, teachers were asked whether they
Teacher responses were then compared to ODR rates. Results indicated that in four out of the five schools, teacher perceptions of behavior change were consistent with actual changes in ODR rates across the two years.
Improved Social Behavior. Core to PBIS implementation is the prevention of
problem behaviors through the teaching and encouragement of positive social behaviors. However, these increases in positive social behavior are not often measured directly. In recent research, improved social behavior is most often measured through the use of ODR data (Sadler & Sugai et al., 2009). For example, Sadler and Horner compared ODR rates for districts implementing PBIS to those not implementing PBIS. Although lower ODR rates were found in PBIS schools, there was no evidence that positive social behavior itself increased in these districts, only that problematic behaviors were lower.
The Behavior Outcome Survey (BOS) was developed by the Tri-State Consortium for Positive Behavior Support (TSCPBS) as a measure of behavior change for schools
experiencing high rates of problematic behavior (Kincaid, Knoster, Harrower, Shannon, & Bustamante, 2002). The BOS was used to measure a team’s rating of observed changes in school-wide behavior problems, with staff indicating changes in frequency (more or less often), severity (more or less severe) and duration (longer or shorter) following PBIS implementation. In addition, the staff reported on student acquisition, frequency,
appropriateness, and independence of socially acceptable alternative skills in replacement of problematic behaviors. Results indicated that the majority of staff members observed reductions in problem behavior following PBIS implementation. Eighty-two percent rated behaviors as occurring less frequently, 78% reported less severe behaviors, and 76%
reported decreases in duration. Positive alternative behaviors were rated as occurring
more frequently by 71% of members, more appropriately by 88%, and more independently
by 76% of staff following the implementation of PBIS. Finally, team members reported that overall, they were satisfied with the utility, efficiency, and outcomes of PBIS.
The Problem and Pro-social Student Behavior Scale was developed as a measure of staff perceptions regarding problematic and prosocial behaviors of students (Clonan, Lopez, Davison, & Rymarchyk, 2004). Results indicated that four out of the five items addressing prosocial behavior increased following PBIS implementation. However, none of these increases were statistically significant. Further, the utility of the scale is questionable as it is not easily accessible to schools.
Positive Behavior Construct
The construct of positive behavior, which is a valued outcome of PBIS
implementation in schools, lacks a clear and concise definition in literature. Hearron and Hildebrand (2006), for their purposes, have provided a definition of positive behavior as “those which help children move along toward the goal of becoming well adjusted, fully functioning adults” (p. 1). They go on to state, “positive behavior is not, therefore, the same thing as compliance with adult wishes”.
Other definitions of positive social behavior have included, “social competence with peers and adults, compliance to rules and adult direction, and autonomy or self reliance” (Epps, Eun Park, Huston, Ripke, 2003, p. 4). Social competence referred to getting along with others, being liked by others, generosity, thoughtfulness, and being perceptive of the feelings and perspectives held by others. Compliance was described as expanding beyond
conforming and encompassed obedience to rules without requiring constant supervision. Autonomy/self-reliance refers to behavioral independence and ability to not depend on others for unnecessary assistance.
In general, the literature has failed to provide a clear distinction between positive behavior and prosocial behavior despite having established a relatively clear description of prosocial behavior. Kidron and Fleischman (2006) provide that prosocial behaviors are voluntary and are intended to assist, benefit, or help others. Specific examples provided include sharing, comforting, rescuing, and helping. They report that antecedents for prosocial behavior include empathy, moral values, and a sense of personal responsibility. They concluded that prosocial behaviors do not include those that are done as a means of personal goal-attainment. This view is supported by other research as well. Carlo and Randall (2002) determined prosocial behaviors are those conducted under the intention to benefit others.
Several scales exist to measure prosocial behavior. Eisenberg and Fabes (1998) identified four types of prosocial behavior: Altruism, compliant, emotional, and public. Altruism encompassed behaviors that were voluntarily done and lead by motivation for the concern for the needs and/or welfare of another. Compliant prosocial behaviors were described as fulfilling a request to assist another. Emotional prosocial behaviors were characterized as voluntary acts directed towards the assistance of others that were in emotional distress (e.g. an injured individual that is crying). Public prosocial behavior was a term used to describe behaviors as those conducted in front of others/an audience. The motivation behind these acts was the desire to gain the approval and/or respect from
others. Carlo and Randall (2002) expanded on the work of Eisenberg and Fabes, to also include anonymous and dire prosocial behaviors. Anonymous prosocial behavior included those where helping is done without the acknowledgement of the individual providing the help. Dire prosocial behavior included those where help is given in an emergency situation. To measure these behaviors, participants were given specific examples of prosocial
behavior in each area and asked to rate the degree to which it described their behaviors. After a review of the literature, the difference between positive and prosocial behaviors appears to be the motive or intent behind behavior. Research continually indicates that prosocial behaviors are altruistic in nature and are performed in order to benefit another. On the other hand, according to literature, positive behaviors are not performed solely to serve this same function. Rather, behaviors are positive when they contribute to the development or personal growth of an individual. Therefore, literature alludes to the consideration that positive behaviors can be performed in order to benefit others, but this motive is not required in order for a behavior to be considered positive.
Preliminary research by the author that informed the development of the present teacher-rating measure of positive behavior was predicated on the assumption that positive student behaviors in school are the behaviors that adults value to the degree that they are willing to provide intentional reinforcement for the occurrence of these behaviors (Ebsen & Filter, 2013). A series of studies indicated that teachers were more than 50% likely to provide reinforcement for five types of behaviors, which have been named for the acronym, SHUCK: (a) Supporting Other Students in Following the Rules, (b) Helpful, (c)
Using Manners, (d) Cooperating/Sharing, and (e) Kind/Caring. Table 1 includes definitions of each of the SHUCK positive behaviors from (Ebsen & Filter, 2013).
Table 1
Behaviors and Definitions
Behavior Definition Examples Non Examples
Supporting Other Students
Appropriately reminding classmates and peers of the rules or behavior expectations of the school
• Nicely reminding another student to walk in the hallways
• Modeling appropriate school behavior for another student
• Appropriately reminding a student of the
consequences of their behavior
• Noticing when other students engage in positive behavior
• Telling on a student that has broken a school rule
• Telling another student how to behave based on rules that he or she has created that are not based on school rules
Helpful Providing task assistance or service to benefit another
• Opening a door for another
• Volunteering to pass out papers in a classroom • Tutoring another • Saying something nice to another • Displaying a positive attitude
Using Manners Using words or behaviors that are deemed to be socially appropriate
• Saying “please” and “thank you”
• Welcoming a visitor into the classroom
• Paying a compliment
• Working with students that have no one to work with
Cooperating/ Sharing
Giving materials to or using materials with another person
• Lending another student personal materials, such as a pencil or scissors
• Using school property appropriately with another
• Relaying ideas and
• Offering to include an individual in their group
• Bringing in items for donation
thoughts in a group setting
• Effectively working together towards a common goal
Kind/Caring Displaying concern, thought, or positive regard to another
• Paying a compliment
• Cheering up a classmate that is feeling sad
• Bringing in items for donation
• Asking an individual to join their group
• Carrying a heavy item for another
• Offering to assist another student who is struggling with an assignment
The present study evaluates the new teacher-rating measure of positive behavior that was based on this preliminary work with these five categories of positive behaviors (i.e., SHUCK).
Purpose of Present Study
The present study aims to expand the literature on the construct and measurement of positive behaviors. More specifically, it extends the preliminary research conducted by the author. In order to do this, a positive behavior measure, the Positive Student Behavior Scale (PSBS), was developed to measure the teacher reports and perceptions of recent positive behavior occurrences within the school setting. The current study addressed four research questions:
1. Can the findings from the present survey confirm themes of positive student behavior in schools that have been developed based on previous findings? 2. Can the PSBS be condensed to contain fewer items, but still accurately address
3. Does a significant correlation exist across multiple ratings over of the PSBS over a short period of time?
4. Do schools with high level of PBIS implementation fidelity report higher levels of positive behavior on the PSBS?
CHAPTER 3-METHODOLOGY Research Methods Participants
All participants for the study were recruited during Fall 2012 PBIS trainings in Minnesota. Two cohorts were represented in the sample, one cohort in their first year of PBIS training (cohort 8) and one cohort in their second year of PBIS training (cohort 7). Forty percent of the participants were from cohort 7 (n=163), while 60% of the
participants were from cohort 8 (n=243). All participants were members of their school’s PBIS team, with a mean of 4.2 participants per school (standard deviation of 2.6). The number of team members completing the survey ranged from one to 12 per school. A total of 406 participants representing 96 schools completed the initial survey. The sample was comprised of 23% males (n=93) and 77% females (n=313). Table 2 reveals that the sampling of schools encompassed all grade levels with the majority of respondents working in elementary schools. Table 3 depicts the demographics of the respondents.
Table 2
School Information
School Type n Percentage of Sample
Elementary 52 54%
Middle School 13 14%
Combined Type 21 22%
Table 3
Staff Information
Staff n Percentage of Sample
General Education Teacher 187 46%
Special Education Teacher 44 11%
Administrator 49 12%
Licensed, Non-Instructional Staff 52 13%
Non-Licensed, Non-Instructional Staff 32 8%
Other 39 9%
Not Identified 3
Measures
Positive Student Behavior Scale. The questionnaire used in this study, the Positive
Student Behavior Scale (PSBS), was derived from the author’s previous study of five
categories of positive behaviors (Ebsen & Filter, 2013). SHUCK is an acronym representing the five behavioral categories: (a) Supporting Other Students in Following the Rules, (b) Helpful, (c) Using Manners, (d) Cooperating/Sharing, and (e) Kind/Caring. Previous research on the SHUCK behaviors took place in three phases. Phase I involved asking school teachers and staff from an elementary school and a high school in Southern
Minnesota to write down all of the student behaviors that they were likely to reward with positive referral tickets (PRTs) that were used in a token economy system. Forty-five respondents participated and a total of 226 behaviors were reported.
Phase II involved the creation of what would become known as the SHUCK
categories of behaviors. The author reviewed the behaviors listed in Phase I of the study and reduced them into categories of positive behaviors. A second researcher reviewed and confirmed the results of the categorization process. Seven behavior categories were
developed: (a) Helpful, (b) Kind/Caring, (c) Organized, (d) Using Manners, (e)
Cooperating/Sharing, (f) On-Task, and (g) Supporting Other Students in Following the Rules. Each behavior was operationally defined and examples and non-examples were included in the definitions (see Table 1 for examples of definitions). The checklist was distributed at a PBIS training in Southern Minnesota and school teachers and staff on PBIS teams in schools from multiple school districts were instructed to indicate how likely they were to reward a student displaying each of the seven behaviors with a PRT. PRTs are given out by staff when they see positive behavior; which is contrasted with office discipline referrals, which are paper tickets that staff deliver when students engage in a behavior violation. In total, 123 teachers and school staff completed checklists.
Respondents in phase II of the previous study rated each of the seven categories of positive behaviors on the following scale: (1) Definitely not give a PRT, (2) Probably not give a PRT, (3) Probably give a PRT, and (4) Definitely give a PRT. Results indicated that five of the seven behavior categories obtained mean ratings above 2.5 (the middle point) on the 4-point scale: (a) Supporting Other Students in Following the Rules, (b) Being Helpful, (c)
Using Manners, (d) Cooperating/Sharing, and (e) Kind/Caring. Organized and On-task received mean ratings below 2.5 on the 4 point scale and were thus excluded from the next phases of the study.
Phase III involved testing the reliability of a behavior observation coding system that was based on the five SHUCK behaviors that were derived from Phase I and Phase II. A 15-minute partial interval recording system was developed wherein a different student was observed every 10 seconds. Three doctoral students were trained in data collection. A total of 16 observations were conducted in two elementary classrooms in Southern
Minnesota. Results indicated that although positive behaviors occurred at a low frequency, even when all five behaviors were combined (4.7% of intervals in Classroom A and 3.3% of intervals in Classroom B), the observation code displayed high levels of inter-rater
reliability (98% in Classroom A and 97% in Classroom B).
The PSBS, a teacher-rating measure developed for the present study, consists of 35 items with seven specific positive behaviors under each of five SHUCK behavior categories. Behaviors included in the measure were selected by reviewing the behavior teaching matrices posted on the PBIS Technical Assistance Center website (www.pbis.org). These matrices are examples of systematically organized behavior expectations across various school settings that are used to guide the process of teaching behavior expectations in PBIS schools (see Appendix A for example teaching matrix). The matrices on the PBIS website were examples from real schools around the country and were created by staff in those schools to reflect the local behavior expectations. Therefore, they represent field-generated, valid examples of positive behaviors according to the definition of positive
behavior utilized in the present study. The author reviewed the behaviors from the
matrices and matched them to the five SHUCK behavior categories. The faculty advisor for this study reviewed and validated the category assignments.
Respondents to the PSBS in the present study were asked to report the degree to which they observed each of the 35 behaviors over the past three months using the following four-point scale: (0) Never, (1) Infrequently, (2) Somewhat Frequently, or (3) Frequently. The authors chose not to include a designation of “very frequently” based on findings from a previous observational study, which indicated that the SHUCK positive behaviors were generally low-frequency behaviors (Ebsen & Filter, 2013). The survey took approximately 10 minutes to complete. Items from each SHUCK category were
interspersed every five items throughout the questionnaire such that items 1, 6, 11, 16, 21, 26, and 31 were from the S (Supporting Other Students in Following the Rules) category; items 2, 7, 12, 17, 22, 27, and 32 were from the H (Helpful) category; items 3, 8, 13, 18, 23, 28, and 33 were from the U (Using Manners) category; items 4, 9, 14, 19, 24, 29, and 34 were from the C (Cooperating/Sharing) category; and items 5, 10, 15, 20, 25, 30, and 35 were from the K (Kind/Caring) category. See Appendix C for a copy of the PSBS.
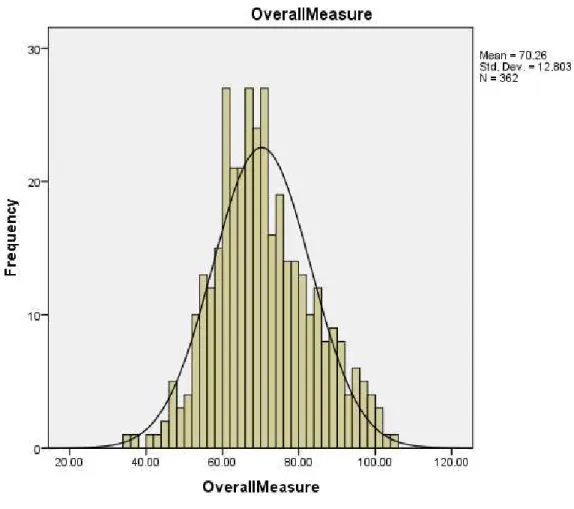
Descriptive statistics for the overall PSBS scale and each of the five SHUCK subscales are represented in Table 4. An overall score on the measure was calculated for each
participant. A minimum possible score on the PSBS was zero, if a participant answered each of the 35 items with a “never” response. A maximum possible score on the measure is 105, if a participant answered “frequently” to each of the 35 items. Overall measure
to be 70.26, with a standard deviation of 12.80. Score ranges on the PSBS were 35 to 104. Possible participant scores on the five SHUCK categories had a possible range in scores of zero to 21 with an observed range of five to 21.
Table 4
Descriptive Statistics for the PSBS Responses by SHUCK Subscale
Overall Measure Supporting Other Students… Helpful Using Manners Cooperating/ Sharing Kind/ Caring N Valid 362 401 390 402 395 400 Missing 44 5 16 4 11 6 Mean 70.26 10.28 10.29 12.75 15.24 12.14 Median 69 10 10 13 15 12 Mode 61 9 9 12 14 12 Std. Deviation 12.80 2.11 2.14 2.43 2.74 2.49 Range 69 10 10 12 16 13 Minimum 35 5 5 6 5 5 Maximum 104 15 15 18 21 18
Figure 1. Overall distribution of PSBS scores
Participants from cohort 7 schools had a mean overall score of 69.6 (standard deviation of 13.4). Participants from cohort 8 schools had a mean score of 70.7, with a standard deviation of 12.4.
School-wide Evaluation Tool. The School-wide Evaluation Tool (SET) is a
commonly used measure in the assessment of fidelity of implementation in a PBIS
framework. Schools are given an overall summary score based on the critical elements of PBIS they have in place. The SET has demonstrated adequate psychometric properties,
with an overall internal consistency of .96 (Horner et al., 2004). Please see literature review for a comprehensive review of the SET. Data on each participating school’s SET scores were requested from the Minnesota Department of Education. Data from the SET were collected in the spring of 2012, approximately 4 months after the SHUCK scale data were collected. Procedures
The PSBS was distributed to school staff during the Minnesota Department of Education-sponsored PBIS trainings in November 2012. Respondents received a brief verbal description of the study and its purpose. A letter that contained information about the study, its purpose, and contact information for the researcher accompanied each survey. Participants were given approximately 15 minutes to complete the PSBS before responses were collected. In order to collect data on the test-retest reliability of the measure, all participants were invited to complete the scale a second time. Respondents that chose to participate provided their email addresses. Participation in both
administrations was voluntary. No consent was gathered in either administration, as participants were informed that their responses would also serve as their consent for participation.
Approximately two weeks after completing the initial PSBS, the author contacted interested respondents via e-mail to invite them to participate in the re-administration of the PSBS for the purpose of test-retest analyses. Respondents were asked to complete the electronic version of the PSBS available on SurveyMonkey. The author sent a reminder via e-mail approximately one week later to respondents that had not yet responded. They
online survey was closed one week later. Therefore, all re-test responses were collected between two to four weeks after initial PSBS data collection.
Data Analysis
Data were entered and analyzed using SPSS 21 and SPSS Amos. Any data left blank by respondents were treated as a listwise deletion, where an entire record was excluded from analysis if any values were missing. Demographic information was coded using binary (gender, member of PBIS team), nominal (name of school, role in school), and scale (years of training in PBIS) levels of measurement. Responses to the 35 items PSBS were coded using a scale level of measurement, ranging from zero to three.
The first research question, “Can the findings from the present survey confirm themes of positive student behavior in schools that have been developed based on previous findings?” was examined through the use of confirmatory and exploratory factor analyses. The second question, “Can the original scale be condensed to contain fewer items, but still accurately address levels of positive behavior?” was evaluated using Cronbach’s Alpha internal consistencies for each of the five scales and the overall measure. Test-retest was examined in research question number three, which asked, “Does a significant correlation exist across multiple ratings over a short period of time?” using simple correlations
coefficients. The final research question asked, “Do schools with high level of PBIS
implementation fidelity report higher levels of positive behavior on the newly developed measure?” To answer this, analyses of variance (ANOVAs) and linear regressions were performed.
CHAPTER 4-RESULTS
Confirmatory and Exploratory Factor Analyses
A confirmatory factor analysis was conducted to examine whether theoretically derived models were a proper model fit or if a different model fit the sample data more appropriately. In this study, the two models were theoretically-based on the author’s previous research (Ebsen & Filter, 2013). The first model was a five-factor model, wherein each of the five SHUCK behavior areas represented independent latent variables, with seven factor loadings each (manifest variables). The other model is a one-factor model, wherein all 35 items loaded onto one factor of positive behavior. Conducting a
confirmatory factor analysis allowed for the explicit testing of the researcher’s hypothesis that the theoretical models adequately fit the data.
Data analysis was conducted using SPSS Amos. Several indices were run to evaluate the overall model fit. These included the goodness-of-fit Chi-Square statistic (X2), the ratio of X2 to degrees of freedom (X2/df ratio) the root square error of approximation (RMSEA), the Bentler comparative fit index (CFI), and the Tucker Lewis index (TLI). Cut-offs points recommended by Walker (2010) were utilized in order to serve as recommended
indicators for goodness-of- fit for the two models (Table 5). This was selected due to the similar sample sizes of the studies, similar content, and similarities of fit indexes used between the present study and Walker study.