University of Connecticut
OpenCommons@UConn
Doctoral Dissertations University of Connecticut Graduate School
7-8-2014
Observed and Simulated Processes Linked to the
Recent Climate Variability and Changes over the
Greater Horn of Africa
Vincent O. Otieno
University of Connecticut -, [email protected]
Follow this and additional works at:https://opencommons.uconn.edu/dissertations Recommended Citation
Otieno, Vincent O., "Observed and Simulated Processes Linked to the Recent Climate Variability and Changes over the Greater Horn of Africa" (2014).Doctoral Dissertations. 497.
i
Observed and Simulated Processes Linked to the Recent Climate Variability and Changes over the Greater Horn of Africa
Vincent O. Otieno, Ph.D. University of Connecticut, 2014
The main objective of this dissertation is to document characteristics of the processes and mechanisms associated with 20th and 21st century spatio-temporal modes of climate variability and changes over the Greater Horn of Africa (GHA) region.
This thesis research comprises three major parts. The first part used output from ten Earth System Models (ESMs) from the fifth phase of coupled model intercomparison project to characterize seasonal and annual mean precipitation cycle over the Greater Horn of Africa (GHA) region. Each ESM had at least 2 ensemble members. In spite of distributional anomalies of observations, ESM ensemble means were examined on the basis of gridded precipitation data. Majority of the ten ESMs analyzed correctly reproduce the mean seasonal and annual cycle of precipitation for the period 1979–2008 as compared to gridded satellite-derived observations. At the same time our analysis shows significant biases in individual models depending on region and season. Specifically, a modest number of models were able to capture correctly the peaks of bimodal (MAM and OND) and JJAS rainfall while a few either dragged the onset to subsequent months or displaced the locations of seasonal rainfall further north. Nearly all models were in agreement with their representation of the zonal orientation of spatial pattern of the leading EOF rainfall modes; more so, enhanced precipitation over the Indian Ocean and a dipole mode of precipitation pattern are captured in the first and second mode respectively. Further, the corresponding EOF time series of the ESMs rainfall modes were all in phase with observations.
ii
However, all models output were positively biased against observations, with large medians and varied range of anomalies. Therefore, caution needs to be taken when choosing models for applications over the region, especially when ensemble means have to be considered.
The second part focused on the ESM projections under AR5 Representative Concentrations Pathways (RCP), 4.5 and 8.5 scenarios projections of the GHA Climate. Six Earth System Models (ESMs) from CMIP5 archive have been used to characterize projected changes in seasonal and annual mean precipitation, temperature and the hydrological cycle by the middle of twenty-first century over the GHA region. There is significant variation among models in projected precipitation anomalies, with some models projecting an average increase as others project a decrease in precipitation during different seasons. The ensemble mean of the ESMs indicates that the GHA region has been experiencing a steady increase in both precipitation and temperature beginning the early 1980s and 1970s respectively in both RCP4.5 and RCP8.5 scenarios. Going by the ensemble means, temperatures are projected to steadily increase uniformly in all the seasons at a rate of 0.3/0.50C/decade under RCP4.5/8.5 scenarios over northern GHA region leading to an approximate temperature increase of 2/3 0C by the middle of the century. On the other hand, temperatures will likely increase at a rate of 0.3/ 0.4
0C/decade under RCP4.5/8.5 scenarios in both equatorial and southern GHA region leading to an
approximate temperature increase of 2/2.5 0C by the middle of twenty first century. Nonetheless, projected precipitation increase varied across seasons and sub-regions. Notably, as precipitation increases, the deficit (E-P) between evaporation (E) and precipitation (P) increased over the years, with a negatively skewed distribution. This generally implies that there is a high likelihood of an increased deficit in local moisture supply. This remarkable change in the general hydrological cycle (i.e. deficit in local moisture) is projected to be also coincident with
iii
intensified westerly anomaly influx from the Congo basin into the region. However, better understanding of the detailed changes in hydrological cycle will require comprehensive water budget analyses that require daily or sub-daily variables.
The third part was the sub-regional analysis of precipitation and evaporation using high resolution Coordinated Regional experiments (CORDEX) output over the GHA sub region. Over southern GHA region, the number of wet and extreme wet days is projected to increase, expanding the length of a growing season during DJF. However during MAM, the number of wet days is projected to decrease by the middle of the 21st century over southern GHA region. Over equatorial GHA region, the number of wet days is projected to decrease during MAM and OND seasons. This might impact negatively on the agricultural activities in the region. Over the northern GHA region, significant increase/decrease in the number of wet/dry days is projected during September-October-November (SON) season. However, the number of extreme wet days is projected to increase during MAM, JJA and SON seasons while the number of extreme dry days is expected to remain relatively the same in all the seasons.
The projected changes in precipitation distribution over the GHA region will have different impact on those sub-regions. For agricultural activities, causes of rain failure might be considered in terms of delayed onset of rains, an early withdrawal, or short but intense rainfall events separated by long dry spells. However, in this research the main focus was on the changes in distribution of rains. Other aspects such as onset and withdrawal and the gap between dry and wet spells also need to be documented for right choice of crop and optimum production.
iv
Observed and Simulated Processes Linked to the Recent Climate Variability and Changes over the Greater Horn of Africa
Vincent O. Otieno
B.S., University of Nairobi, 2007 M.S., University of Connecticut, 2010
A Dissertation
Submitted in Partial Fulfillment of the
Requirements for the Degree of Doctor of Philosophy at the
University of Connecticut 2014
v
APPROVAL PAGE Doctor of Philosophy Dissertation
Observed and Simulated Processes Linked to the Recent Climate Variability and Changes over the Greater Horn of Africa
Presented by Vincent O. Otieno, B.S., M.S. Major Advisor_______________________________________________________________ Richard Anyah Associate Advisor_____________________________________________________________ Xiusheng Yang Associate Advisor_____________________________________________________________ Guiling Wang Associate Advisor_____________________________________________________________ Chuanrong Zhang University of Connecticut 2014
vi
AKNOWLEDGEMENT
I first of all give thanks to the Almighty God for His protection and guidance through my life as a graduate student at the University of Connecticut.
I gratefully acknowledge the patient counsel provided by my major advisor Dr. Richard Anyah throughout the course of my doctoral program and also through financial support. I’m greateful to having met Dr. Anyah and privileged to work with him and many thanks for helping me build the skills that I now possess and to establish a research trajectory that I can continue to follow in my own academic career. You have always been more than a mentor. Thanks a lot. To my dissertation committee – Dr Guiling Wang, Dr. Xiusheng Yang, and Dr. Chuanrong Zhang, I am very grateful for having learnt from you in various aspects, especially through classes that inspired discussions.
I would also like to extend my gratitude to other faculty members and staffs in the Department of Natural Resources and the Environment for all their support and encouragement, especially Dr. Civco who was always open for discussion and his willingness to help. Dr. Mayor always inspired me with his challenging questions and Dr. Clausen for his love and fatherly advice. I’m also grateful to other faculty members whom I had various discussions with for their understanding, especially Dr. Rudnicki. To our staff Beth and Suzie, many thanks for the excellent logistical support and encouragement. To our department head, thanks for your understanding.
vii
My appreciation also goes to the early mentoring and guidance that I received from my B.S supervisor while at the University of Nairobi, Dr. Franklin Opijah, and most importantly the support I received from the director of IGAD Climate Prediction and Application Center (ICPAC), Dr. Laban Ogallo.
I would also like to appreciate the support I received from friends at ICPAC, Dr. Philip Omondi – your early mentoring is really appreciated and George Kabaka for having always helped with data. Friends at the University of Connecticut; Kobby, Dickens, Aimee, Jason parent and James Hurd, your support and the times we shared were absolutely invaluable.
My greatest gratitude to my fiancée Beatrice for always being there for me, my mother – Mary Otieno and my Siblings, Marveline and Nicholas for their support and encouragement through my stay at UCONN.
Lastly, my thanks goes to the World Climate Research Program Working Group on Coupled Modelling, which is responsible for CMIP, and also the climate modeling groups, who provided the data used mostly in this dissertation work for producing and making available their model output.
viii
Table of Contents
Chapter 1: Introduction ... 1
1.1 The Study Area ... 5
1.1.1 Physical Features of the Greater Horn of Africa. ... 5
1.1.2 General climatology of the Greater Horn of Africa region ... 8
1.2 Global and Regional Dynamics of the GHA Climate ... 15
1.2.1 Large scale forcing: Teleconections ... 15
1.2.2 Inter-Tropical Convergence Zone (ITCZ) Influence ... 18
1.2.3 Intraseasonal variability: Quasi-Biennial Osciallation (QBO) and Madden-Julian Oscillation (MJO) ... 19
1.2.4 Forcing due to Land Surface Characteristics ... 20
1.3 Objectives and Scientific Questions ... 21
Chapter 2: CMIP5 simulated climate conditions of the Greater Horn of Africa (GHA): contemporary climate ... 25
2.2 Data ... 27
2.3 Methodology ... 29
2.3.1 Analysis of uncertainty in observations used for model evaluation ... 29
2.3.2 Time-Latitude Precipitation and OLR Analysis ... 31
2.3.3 Empirical Orthogonal Function (EOF) Analysis ... 31
2.4 Results and Discussions ... 32
2.4.1 Uncertainty in observations used for model evaluation ... 32
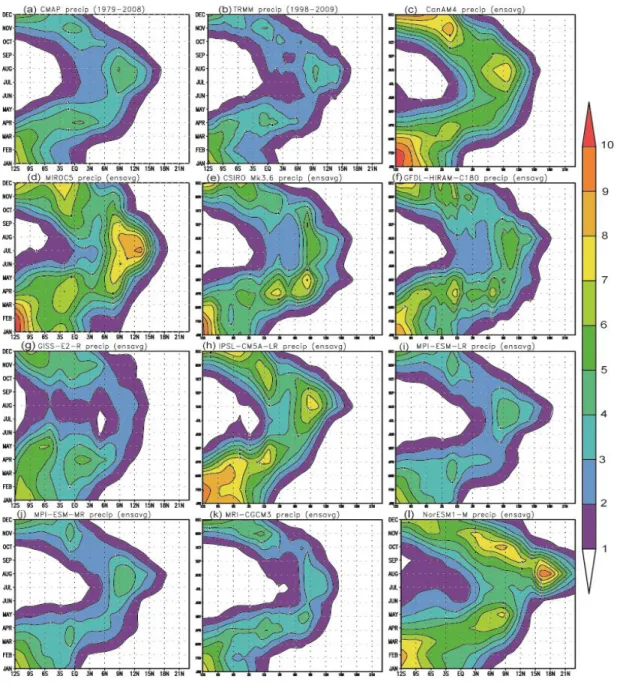
2.4.2 Mean annual cycle and inter-annual variability ... 35
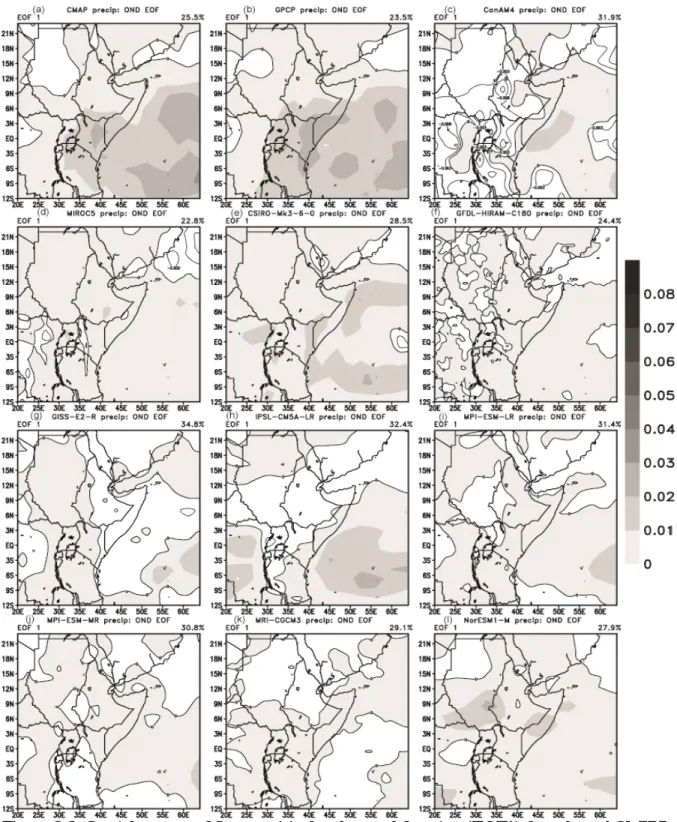
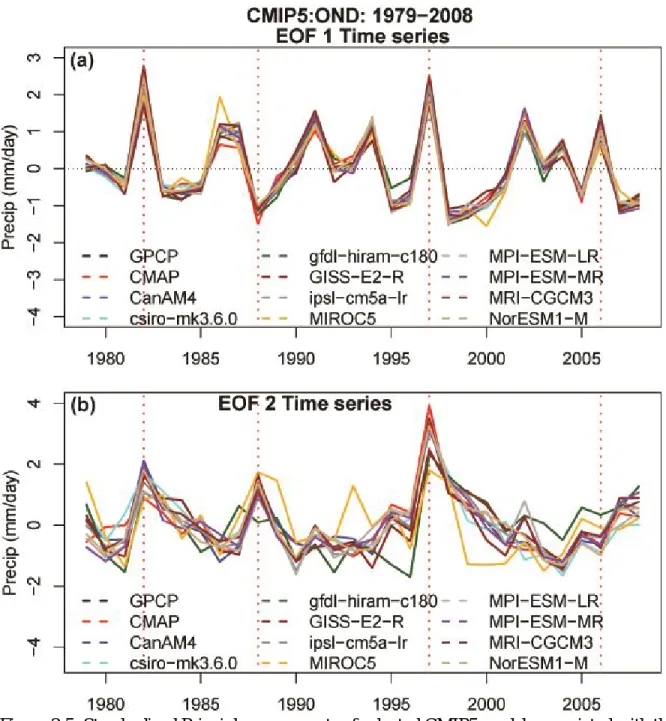
2.4.3 Inter-annual variability based on EOF analyses ... 37
2.4.4 Mean radiative heating (OLR) and ITCZ location ... 42
2.4.5 Intermodal variability ... 45
2.4.6 Summary and Conclusions ... 48
Chapter 3: CMIP5 projected climate conditions of the Greater Horn of Africa (GHA) by the mid of 21st century ... 53
3.2 Data and Methodology ... 55
3.2.1 Time-Latitude Precipitation patterns ... 57
ix
3.2.3 Water budget Analysis ... 59
3.3 Results ... 59
3.3.1 Mean annual precipitation cycle and the ITCZ ... 59
3.3.2 Projected changes in Precipitation and temperature trends ... 62
3.3.3 Trends and variability in primary terms of the hydrological cycle ... 66
3.3.3.1 Temporal patterns of changes in the hydrological cycle ... 67
3.3.3.2 Spatial pattern of moisture anomalies over the GHA region ... 73
3.3.4 Present day and projected wet and dry days distribution ... 78
3.3.4.1 Southern GHA region ... 79
3.3.4.2 West Equatorial GHA region ... 86
3.3.4.3 East Equatorial GHA region ... 90
3.3.4.4 Northern GHA region ... 94
3.4 Summary and Conclusion ... 102
Chaper 4: CORDEX: Performance of Regional Climate Models in Projecting the Greater Horn of Africa climate by the middle of 21st century ... 111
4.2 Data and Methodology ... 112
4.3 Results ... 114
4.3.1 Seasonal mean differences between precipitation (P) and Evapotranspiration (E) ... 114
4.3.2 Projected mean change in precipitation under RCP4.5 and 8.5 scenarios ... 120
4.3.3 Mean Changes in the Atmospheric Water Cycle Components ... 133
4.4 Summary and Conclusion ... 138
Chapter 5: ... 145
5.1 General Summary and Discussions ... 145
5.2 Lessons Learnt and what needs to be done ... 155
ix
Figure Captions
Figure 1.1: Map of Africa showing the Greater Horn of Africa (GHA – dark green region) ... 7 Figure 1.2: Topographic map depicting physical features of the Greater Horn of Africa (modified from Anyah et al., 2009, CLIVAR Exchanges). ... 8 Figure 1.3: Long-term mean annual climatological rainfall over Greater Horn of Africa
(1981-2010). Units are in mm. Data source: CPC Merged Analysis of Precipitation (CMAP) ... 9 Figure 1.4: Spatial patterns of the mean seasonal rainfall (mm) over GHA region for (a)
December-February, (b) March-May, (c) June-September, and (d) October-December. Data source: CPC Merged Analysis of Precipitation (CMAP) ... 14 Figure 2.1: Empirical quantile-quantile plot of area averaged precipitation over latitude 5oS-5oN
and longitude 29oE-42oE for (a) TRMM3B42 vs CMAP, (b) GPCP vs CMAP, (c) UDEL vs CMAP and (d) ERAINT vs CMAP. Overlaid are the deviation ellipses at 0.05
confidence level. ... 34 Figure 2.2: Time-Lat hovmoler plot of CMAP, TRMM3B42 and selected CMIP5 models
precipitation averaged over longitude 250E and 480E. ... 38
Figure 2.3: Spatial pattern of first empirical orthogonal function (EOF1) for selected CMIP5 models. Positive contours are shaded. ... 40 Figure 2.4: Same as figure 4, but for second EOF mode ... 41 Figure 2.5: Standardized Principle components of selected CMIP5 models associated with the
EOFs for (a) first principle component, and (b) second principle component ... 43 Figure 2.6: Time-Lat hovmoller plot of outgoing longwave radiation from HIRS, NOAA OLR
and the selected 10 CMIP5 models. Averages are taken over longitude 250E and 480E. 46 Figure 2.7: Box plots of CMAP and CMIP5 models used in the analysis. In the left panel the
plots are ordered by their medians and the right panel the data are ordered by the Inter-quartile range. The notches are drawn at 95% confidence interval of the median. All the data have been normalized by CMAP standard deviation. ... 48 Figure 3.1: Figure showing the Greater Horn of Africa region with the three sub-regional
divisions ... 57 Figure 3.2: Hovmoller plots of precipitation anomalies for selected CMIP5 ESM models. The
upper two panels are the anomalies between rcp4.5 and historical while the two lower panels are the anomalies between rcp8.5 and historical runs. ... 61 Figure 3.3: Time series analysis of precipitation anomalies over the GHA sub regions for
different seasons. The anomalies are taken on a base period of 1981-2000. The shaded regions are the bounds taken from lower quartile and upper quartile of the anomalies [q.25,
x
Figure 3.4: Same as figure 3.3, but for temperature. The shaded regions are at 95% confidence
level ... 66
Figure 3.5: Time series of ensemble anomalies for evaporation (green bars) and precipitation (cyan bars) under RCP4.5 projection scenario. The red line is the difference between evaporation and precipitation anomalies. Precipitation values are inverted. ... 68
Figure 3.6: same as figure 3.5, but for RCP8.5 scenario. ... 69
Figure 3.7: Velocity potential and divergent wind anomalies for ensemble mean of six CMIP5 models at 850 hPa level. The anomalies are taken at a base period of 1981-2000. ... 75
Figure 3.9: Figure showing distribution of precipitation anomalies by the mid of 21st century, over the southern (central Tanzania) GHA region. Numbers of wet days are the days that received precipitation above 75th percentile of the 1981-2000 long term mean. ... 80
Figure 3.10: Figure showing distribution of precipitation anomalies by the mid of 21st century, over the southern (central Tanzania) GHA region. Numbers of dry days are the days that received precipitation below 25th percentile of the 1981-2000 long term mean. ... 83
Figure 3.11: same as figure 3.9 but for the equatorial GHA region. ... 87
Figure 3.12: same as figure 3.11 but for the western equatorial (Kenya, Uganda) GHA region .. 90
Figure 3.13: same as figure 3.09 but for the eastern equatorial (Kenya, Ethiopia, and Somali) GHA region. ... 91
Figure 3.14: same as figure 3.10 but for the western equatorial (Kenya, Uganda) GHA region. 93 Figure 3.15: same as figure 3.09 but for the northern GHA (Ethiopia highlands) region. ... 95
Figure 3.16: same as figure 3.10 but for the northern GHA (Ethiopia highlands) region. ... 96
Figure 3.17: Figure showing distribution of precipitation anomalies by the mid of 21st century, over the southern (central Tanzania) GHA region. Numbers of extreme wet days are the days that received precipitation above 95th percentile of the 1981-2000 long term mean. ... 98
Figure 3.18: same as figure 3.17, but for western (Kenya, Uganda) equatorial GHA region ... 100
Figure 3.19: same as figure 3.17, but for eastern GHA region ... 101
Figure 3.20: same as figure 3.17, but for northern GHA region ... 102
Figure 4.1: Surface height (m) and model domain for CORDEX Africa simulation. The domain includes a sponge zone of 10 grid points in each direction. (Modified from Panitz et al. 2013) ... 113
Figure 4.2: DJF percentage spatial difference between precipitation and evapotranspiration (P-E). The hatched areas indicate regions with significant difference at .05 level ... 117
Figure 4.3: MAM percentage spatial difference between precipitation and evapotranspiration (P-E). The hatched areas indicate regions with significant difference at .05 level. ... 118
xi
Figure 4.4: JJA percentage spatial difference between precipitation and evapotranspiration (P-E). The hatched areas indicate regions with significant difference at .05 level. ... 119 Figure 4.5: OND percentage spatial difference between precipitation and evapotranspiration
(P-E). The hatched areas indicate regions with significant difference at .05 level ... 120 Figure 4.6: Projected percentage changes in average precipitation during DJF for the period
2011-2040 under RCP4.5 scenario. Changes are calculated with respect to the period 1971-2000 long term mean. Hatched areas are regions showing where the changes are significant at .05% confidence level ... 125 Figure 4.7: Projected changes in average precipitation during MAM for the period 2011-2040
under RCP4.5 scenario. Changes are calculated with respect to the period 1971-2000 long term mean. Hatched areas are regions showing where the changes are significant at .05% confidence level. ... 126 Figure 4.8: Projected changes in average precipitation during JJA for the period 2011-2040 under RCP4.5 scenario. Changes are calculated with respect to the period 1971-2000 long term mean. Hatched areas are regions showing where the changes are significant at .05% confidence level. ... 127 Figure 4.9: Projected changes in average precipitation during JJA for the period 2011-2040 under RCP4.5 scenario. Changes are calculated with respect to the period 1971-2000 long term mean. Hatched areas are regions showing where the changes are significant at .05% confidence level ... 128 Figure 4.10: Projected changes in average precipitation during DJF for the period 2041-2070
under RCP8.5 scenario. Changes are calculated with respect to the period 1971-2000 long term mean. Hatched areas are regions showing where the changes are significant at .05% confidence level. ... 129 Figure 4.11: Projected changes in average precipitation during MAM for the period 2041-2070
under RCP8.5 scenario. Changes are calculated with respect to the period 1971-2000 long term mean. Hatched areas are regions showing where the changes are significant at .05% confidence level. ... 130 Figure 4.11: Projected changes in average precipitation during JJA for the period 2041-2070
under RCP8.5 scenario. Changes are calculated with respect to the period 1971-2000 long term mean. Hatched areas are regions showing where the changes are significant at .05% confidence level. ... 131 Figure 4.12: Projected changes in average precipitation during DJF for the period 2041-2070
under RCP8.5 scenario. Changes are calculated with respect to the period 1971-2000 long term mean. Hatched areas are regions showing where the changes are significant at .05% confidence level ... 132
xii
Figure 4.13: Time series of ensemble anomalies for evapotranspiration (blue circles) and precipitation (black circles) under both RCP4.5 (left panel) and RCP8.5 (right panel) projection scenarios. Green line is the difference between precipitation and Evaporation (P-E). The anomalies are taken over western Ethiopia (34 – 40oE, 6-13.2oN). The red
dotted line shows the 5th and 95th percentile of contemporary daily precipitation... 135 Figure 4.14: Time series of ensemble anomalies for evapotranspiration (blue circles) and
precipitation (black circles) under both RCP4.5 (left panel) and RCP8.5 (right panel) projection scenarios. Green line is the difference between precipitation and Evaporation (P-E). The anomalies are taken over Northern Uganda (30.5 – 35oE, 1-4.6oN). The red dotted line shows the 5th and 95th percentile of daily recorded precipitation ... 136
Figure 4.15: Time series of ensemble anomalies for evapotranspiration (blue circles) and precipitation (black circles) under both RCP4.5 (left panel) and RCP8.5 (right panel) projection scenarios. The difference between precipitation and Evaporation (P-E) is shown in green line. The anomalies are taken over Eastern Kenya (37.2 – 44oE, 0-5.8oN).
The red dotted line shows the 5th and 95th percentile of daily recorded precipitation. .. 137 Figure 4.16: Time series of ensemble anomalies for evapotranspiration (blue circles) and
precipitation (black circles) under both RCP4.5 (left panel) and RCP8.5 (right panel) projection scenarios. The difference between precipitation and Evaporation (P-E) is shown in green line. The anomalies are taken over Western Ethiopia 29 – 35oE, 8-3oS). The red dotted line shows the 5th and 95th percentile of daily recorded precipitation ... 138
Table Captions
Table 2.1: CMIP5 Earth System Models considered in this study ... 28 Table 2.2: CMIP5 Earth System Models used in this study ... 56 Table 3.2: Distributional differences of E-P of different seasons of each GHA sub-region
1
CHAPTER 1
1.0 INTRODUCTION
It is increasingly becoming apparent that in spite of the ongoing research and debate on climate change many parts of Africa are already reeling under the stress associated with erratic climatic conditions (e.g Tierney et al., 2013; Anyah and Qiu, 2012; Cook and Vizy, 2012; Lyon and DeWitt, 2012; Otieno and Anyah, 2013, 2012; Shongwe, 2011) These are likely associated with regional climatic changes (Lu et al. 2007; Funk et al. 2008; Williams and Funk 2011a; Lyon et al. 2013). For instance, in early 2011, the Horn of Africa was impacted by a particularly severe drought, never witnessed for decades, following the failure of two successive rainy seasons (Funk 2011; Lott et al. 2013a). In some countries within the region like Kenya, the two primary rainfall seasons “short rains” (October–December) in 2010 and the “long rains” (March–June) in 2011 failed in succession. With inadequate rainfall during these successive seasons, the region experienced massive and widespread crop failure. This situation, along with the political situation, lead to extreme famine in the region, especially in the war-ravaged Somalia (Funk 2011). With African economies significantly hinged on a predominantly rain-fed agriculture, such occurrence is expected to pose unprecedented challenges in future.
Of serious concern is that, the entire African continent is the least studied region in terms of ecosystem dynamics and climate variability (IPCC 2007; Shongwe et al. 2011). Thus, the primary mechanisms associated with coupled climate human-ecosystem changes are not well understood. A comprehensive assessment of the potential impacts of climate change on many of Africa’s natural ecosystems is hampered by a current lack of understanding of the fundamental physical and dynamical processes that govern the evolution, variability, and changes in the
2
climate systems of the region. Hence, how such changes are likely to impact agro-ecological sectors that directly form the lifeline for a large population still remain in question. This is further exacerbated by inadequate observations that can be used for comprehensive empirical analysis of the regional climate systems (Shongwe et al. 2011; Nikulin et al. 2012; Sylla et al. 2013; Love et al. 2004). Further challenges lie in understanding low frequency multi-decadal and centennial climate variability due to the vastness and uniqueness of the complex African terrain and associated different climate systems over the eastern, western, southern, and northern portions of the continent (Anyah and Qiu 2012; Diro et al. 2012; Zeleke et al. 2012). The IPCC AR4 report (2007) further highlights’ Africa’s unique vulnerability to extreme impacts associated with global climate change, for instance, in the event that emissions of greenhouse gases continue to increase, the likely impacts of continued anthropogenic warming could include extinction risks for plant and animal species (Ottichilo et al. 2000; Ogutu and Owen-Smith 2003; Ogutu and Owen-Smith 2005; James et al. 2013), and direct physical and health risks to people and communities (Patz et al. 1878; Githeko et al. 2000; Anyamba et al. 2009; Omumbo et al. 2011; Anyamba et al. 2012), in addition to economic risks (Nkomo et al. 2006; Hellmuth et al. 2007).
In recent years over the Greater Horn of Africa (GHA) region, particularly in Kenya, Ethiopia and Somali, climate related extremes have been the dominant trigger of natural disasters. The region has recently witnessed frequent episodes of both excessive (Anyah and Semazzi 2006a; Kijazi and Reason 2009b) and deficient rainfall (e.g Hastenrath et al. 2007; Kijazi and Reason 2009; Funk 2011; Lyon and DeWitt 2012; Zeleke et al. 2012; Viste et al. 2012; Lott et al. 2013b). Shongwe (2011) reports that there has been a change in frequency of extreme events
3
over the GHA region, in particular, the frequency of anomalously strong rainfall causing floods has increased. The analysis of reported incidences from the International Disaster Database EM-DAT (http://www.em-dat.net/) revealed an increase in the number of reported
hydro-meteorological disasters in the region, from an average of less than 3 events/year in the 1980s, to over 7 events/year in the 1990s, and almost 10 events/year from 2000 to 2006, with a particular increase in floods, from an average of less than 1 event each year in the 1980s to 7 events/year between 2000 and 2006 (Guha–Sapir et al. 2012). While part of the trend is due to better reporting, it also reflects’ a rising vulnerability to natural hazards, and potentially an underlying trend in climate variability and extremes (Shongwe et al. 2009). It should be noted that a large number of these hydrometeorological disasters are driven by El Niño southern Oscillation (ENSO) related anomalously rainfall episodes. However, some warm ENSO (El Nino) events have at times been noted to abruptly change to cold ENSO episode, such as, the heavy rains of 1997/1998 El Niño events that preceded the dry 1998 La Niña conditions and El Niño event of 2004/2005 that preceded 2005 La Niña conditions over the equatorial eastern Africa (Hastenrath et al. 2007; Kijazi and Reason 2009b; Kijazi and Reason 2009a). In such occurrence, many locations with strong ENSO signal have observed severe floods that are followed by severe droughts, leading to even harsher socioeconomic impacts (Hellmuth et al. 2007).
Consequently, there has been an upsurge in interest both from the scientific communities (e.g. van Oldenborgh et al. 2005) and from policy makers to the risk of increased extreme climatic events. Williams and Funk (2011) observes that during the past few decades, each 1oC rise in global average temperature has boosted Indian Ocean SSTs by about 1.5oC. With the expected
4
decrease; exposing more than 17.5 million people to food insecurity. Notably, there has been renewed vigor by East African governments to better manage climate risks. In Kenya for instance, the Kenya Adaptation to Climate Change in Arid Lands (KACCAL) project aims to address the increasing risk of floods and droughts (Andrew Mude, Robert Ouma, Jeannette van de Steeg, Juliet Kariuki, Denis Opiyo 2007), while in Rwanda there is already progress on low carbon projects (SEI 2009).
More recently the Inter-Governmental Authority on Development (IGAD) formed a regional body, IGAD Center for Pastoral Area and Livestock Development (ICPALD), to support livestock development in the arid and semi-arid areas of the region. This is an effort towards poverty alleviation and employment creation. Of more interest, the body works hand in hand with climate centers to help avail and interpreting climate data tailored towards livestock community.
No doubt, there is an obvious and urgent need for better analyses of the likely response of extreme climate events in this region to global warming to inform disaster preparedness and development planning. Such demands inform the present study. The primary aim of this thesis is to undertake comprehensive analysis of the new generations of Global Climate Models (GCMs) in order to interrogate their ability to simulate the current climate conditions and isolate consistency/inconsistency and uncertainties between model and observed regional variability and changes. This study further assesses variations in future climate of the region in terms of changes in the hydrological cycle under global warming. An assessment of climate change projections over the region requires a careful evaluation of a model’s ability to simulate temporal and spatial
5
scale hydroclimatic variables and the structure and daily evolution of the monsoon systems. Understanding the ability of these models to simulate climate of various regions of the world can aid in assessing and determining regional impacts and responses, and can be particularly relevant in areas where both conservation and food security are intricately linked to climate patterns.
1.1 The Study Area
1.1.1 Physical Features of the Greater Horn of Africa.
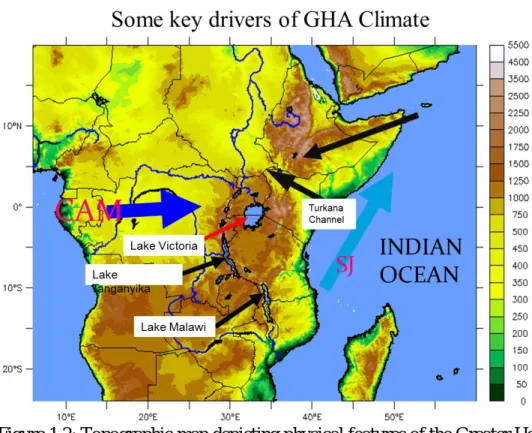
The Greater Horn of Africa (GHA) covering eastern and the Horn of Africa is bounded between latitudes 12°S and 23°N and longitudes 26°E and 45°E. The geographical area of the GHA sub-region comprises eleven countries namely; Kenya, Uganda, Tanzania, Rwanda, Burundi, Djibouti, Eritrea, Ethiopia, Somalia, South and North Sudan (fig 1.1). The region has complex topographical features (fig 1.2), which include high mountains and water bodies. Some of the highlands in the region such as the Ethiopian highlands over western Ethiopia and East African highlands that include high mountains (e.g. Kenya (5199 m), Kilimanjaro (5895 m), Elgon (4321 m), Aberdare Ranges (3999 m) and the Mau escarpment (3098 m)) form the main water catchment areas (Mogaka et al. 2006). Mountains such as Mount Kenya and Kilimanjaro have permanent glaciers at their top throughout the year which makes them very special as potential indicators of regional and/or large-scale climate fluctuations (Kaser et al. 2004). The complex mountains are not only homes to rich ecosystem but also supports most major sectors of the economy. For example the Mau forest complex in Kenya which is part of the five main Kenya Water Towers that include Mt. Kenya, Aberdare, Mt. Elgon and Cheranganyi is the source of River Mara, which is key to the survival of wildlife in Masai Mara Game Reserve in Kenya, the Serengeti National park in Tanzania and the Sondu River which has Sondu Miriu Hydropower
6
complex with a capacity of 60 MW. They therefore form an integral component of the regional hydrological cycle as well as the complex ecosystem.
Bordering the Indian Ocean to the east, the region is also endowed with freshwater masses of Lake Victoria (fig 1.2) with an area extent of about 60, 000 km2. The second largest fresh water Lake in the world, Lake Victoria is also the source of River Nile, one of the longest rivers in the world. The Great Rift Valley which extends from Lebanon in the North to Mozambique in the south through the GHA region uniquely lies between western and Eastern highlands, which decline to a plain towards the Indian Ocean (Ayele et al. 2006; Ebinger et al. 2008; Roberts et al. 2012). This configuration generates land-sea and land-lake breezes, as a result of the water and land temperature contrasts, due to differential solar heating and radiative cooling. For instance, Lake Victoria has a strong circulation of its own with a semi-permanent trough, which migrates from land to lake during the night and Lake to land during the day respectively (Song et al. 2004; Anyah and Semazzi 2009).
The climate of GHA region ranges from cold arctic type of climate on top of some of the high mountains like the Kilimanjaro and Kenya, humid equatorial and tropical climate, savannah grasslands, hot dry semi-desert among many others. The savannah climate that has one distinct dry/wet season is the home to most of the African wildlife and livestock. Tourism and wide range of agricultural activities are extensive in this region. Most of the locations with equatorial climate are concentrated largely near the large water bodies and over the highlands. The semi-desert region covers the northeast and east. A relatively moist zone covers the coastal belt of the Indian Ocean. Agriculture and utilization of forest resources are the major socio-economic
7
activities in this region. Soil erosion arising from such activities is however a major environmental problems in many of these areas.
8
Figure 1.2: Topographic map depicting physical features of the Greater Horn of Africa (modified from Anyah et al., 2009, CLIVAR Exchanges).
1.1.2 General climatology of the Greater Horn of Africa region
The climate of the Greater Horn of Africa (GHA) region has strong annual and seasonal cycle components, with precipitation being the parameter with highest space-time variability. Figure 1.3 shows long-term mean annual rainfall over region based on 1981-2010 climatology. On average more than 800 mm of annual rainfall is observed over most of the southern GHA region, that include south and western Tanzania, most parts of Uganda, areas bordering Lake Victoria on the western side of Kenya, and the Indian Ocean to the east along Tanzania and Kenya coast lines. The highlands of central Kenya, Ethiopian highlands and south-west of South Sudan also receive rainfall of more than 800 mm. However, most parts of Sudan, Eritrea, Djibouti, and Somali, northern and eastern parts of Kenya, which are semi-arid, receive less than 800mm of rainfall annually.
9
Figure 1.3: Long-term mean annual climatological rainfall over Greater Horn of Africa (1981-2010). Units are in mm. Data source: CPC Merged Analysis of Precipitation (CMAP)
The periodic north–south migration of precipitation presents the region with four seasons; December-February (DJF), March–May (MAM), June–September (JJAS) and October-December (OND), with two seasons, MAM and OND, of rainfall received within the equatorial zone, and one season each over the south (DJF) and northern (JJAS) of GHA region. These rainfall patterns are mainly controlled by the seasonal migration of the Inter-Tropical Convergence Zone (ITCZ). The ITCZ is characterized by a belt of low-level convergence and
10
upper-level divergence with strong upward motion, deep penetrative convection, frequent cloudiness, and heavy rainfall. It is a region of large scale convergence of the inter-hemispheric monsoonal winds that often leads to unsettled atmospheric column. It has a distinct seasonal migration across the equator, manifested by a precipitation maximum that shifts from 8oN in April–November to 8oS in December–March, with an equatorial minimum during boreal winter (Nicholson 1996, Wu et al. 2003). Over the GHA region the ITCZ is the main synoptic system that defines seasonal differences.
During DJF season, the ITCZ extends from the Atlantic through West Africa at about 50N turning meridionally over central Africa land mass reaching the east coast of Africa at about 15oS. During this time precipitation is observed over most parts of Tanzania, extending to the lake region over western Kenya and Uganda (fig 1.4a). By February, the ITCZ slowly begins its journey northwards crossing the equatorial region during MAM season. During this time precipitations is concentrated over most of the equatorial GHA extending northwards to southern parts of South Sudan and Ethiopia (fig 1.4b). By July the ITCZ has moved further north located at approximately 12oN over Ethiopia and Sudan. Throughout this time rainfall is concentrated over most parts of Ethiopia and Sudan extending south to northern parts of Uganda and western parts of Kenya around the Lake region (fig 1.4c). Similar to MAM rainfall, the OND seasonal rainfall is also concentrated along the equatorial GHA region (fig 1.4d) as the ITCZ slowly retreats southwards across the equator.
Notably, apart from the dominant bimodal cycle, areas around Lake Victoria receive rainfall throughout the year. This has been linked to a quasi-permanent trough that occurs over Lake
11
Victoria (Song et al. 2004; Anyah and Semazzi 2006; Anyah and Semazzi 2009; Chamberlain et al. 2013) due to locally induced convection and orographic influence modulated by land-lake thermal contrast over the lake and hinterlands. The existence of this quasi-permanent trough over the lake favors convection throughout the year. Nonetheless, large-scale precipitation over the lake is mainly initiated from easterly/southeasterly (Indian Ocean) monsoon flow that transports maritime moisture into the GHA region converging with westerly humid Congo air mass as in the 1997/98 OND season (Anyah and Semazzi 2006).
In addition, the temporal pattern of rainfall over East Africa displays a strong inter-annual variability, marked by extremes of drought and flood events. Previous studies have shown that the interannual variability is mainly associated with perturbations in the global sea surface temperatures (SSTs), especially over the equatorial Pacific and India Ocean basins (Saji et al. 1999; Indeje et al. 2000; Gissila et al. 2004; Abram et al. 2008; Viste and Sorteberg 2011). SST perturbations over the tropical Atlantic also have important influence on the regional climate especially over the northern parts of the GHA (Viste and Sorteberg 2011). However, not all seasons are influenced by the large scale weather systems. For instance, Ogallo 1988 and Nyenze 1992 found a weak correlation between MAM seasonal rainfalls at various stations over equatorial GHA region and global SSTs, which suggest dominance of local factors rather than large-scale factors in the modulation of rainfall patterns during this season (Hanstenrath et al. 1993).
The dominant forces of internnual variability over the region have been summarized as (a) El Niño/Southern Oscillation(ENSO)
12
(b) Indian Ocean Zonal temperature gradient (or Dipole Mode) (c) Tropical Atlantic Ocean temperature anomalies
(d) Quasi-biennial oscillation (QBO) in the equatorial zonal wind (e) Orographic forcing
(f) Madden-Julian oscillation
In addition, regional climate variability has also been linked to global warming footprint, through its influence on the tropical circulation systems, especially over the last two decades (Shreck and Semazzi 2004; Tanaka et al. 2005; Held and Soden 2006; Vecchi and Soden 2007; William and Funk 2011; Lott et al. 2013; Cook and Vizy 2013; Bony et al. 2013; Chadwick et al. 2013). Under increasing greenhouse gas concentrations, land–sea thermal contrasts are expected to increase. The increase is in part due to differences in thermal inertia between land and ocean. Oceans convert more of the anomalous incoming energy into latent heat rather than increasing surface temperature (Sutton et al. 2007). Where moisture is abundant (i.e., over oceans), warmer surface temperatures lead to robust increases in atmospheric water vapor owing to the nonlinear Clausius–Clapeyron relationship, which are associated with weakening of the tropical (Hadley, Walker, and monsoon) circulations (Held and Soden 2006). Weakening of tropical circulation especially the Walker system over the Indian Ocean is expected to impact negatively on the supply of moisture over the GHA region (e.g William and Funk 2011, Lyon and DeWitt 2012; Lott et al. 2013).
Another major component of regional climate variability over the region is the land surface characteristics (Ge et al. 2007, 2008; Otieno & Anyah 2012). Through turbulence transfer of mass, momentum and heat in the planetary boundary layer (PBL), land surface characteristics
13
that include surface roughness, albedo and moisture transfer form vital component of climate variability. Human modification of the land surface therefore affects regional to global climate processes by changing the fluxes of mass and energy between an ecosystem and the atmosphere (Pielke et al. 2002; Paeth et al. 2009; Otieno & Anyah 2012).
As atmospheric concentrations of CO2 continue to rise, substantial changes to the earth system
are expected. For instance, GCM projections in the IPCC, AR4 report project a mean global warming of 2-3oC by mid of the century over the GHA region (Anyah and Qui 2012). These projected climatic changes will likely impact the biosphere, while vegetation changes will produce feedbacks on the climate. Hence the impact of rising levels of CO2 will be felt in two
ways; that is, through radiative and physiological forcing (Betts et al. 1997; Betts et al. 2004, 2007; Cox et al. 2004; Notaro et al. 2006; Cox et al. 2013). The direct radiative effect on the atmosphere produces warming, which can extend the growing season in colder environments, induce drying and vegetation dieback in water limited regions, and incur heat stress over boreal forests. On the other hand, the physiological effect of rising CO2 on vegetation (i.e., the CO2
fertilization effect) enhances photosynthesis, particularly among C3 plants (Betts et al. 1997; Bala et al. 2006, 2013; Bonan 2002; Gedney et al. 2006; Cao et al. 2010). This might result in changes in plant structure, physiology, competition, and distribution (Pritchard et al. 1999). For instance, an expansion of boreal forests into snow covered tundra would reduce the surface albedo and enhance the regional warming (Foley et al. 2000; Notaro et al. 2005, 2006; Liu et al. 2006) due to a positive albedo feedback (Bonan et al. 1992; Levis et al. 2000). By enhancing vegetation amount through the physiological effect, vegetation feedbacks on the atmosphere can then produce additional climatic changes.
14
The following subsections give a brief description of the modes of inter-annual variability and their linkages to the climate of the GHA region.
15
Figure 1.4: Spatial patterns of the mean seasonal rainfall (mm) over GHA region for
(a) December-February, (b) March-May, (c) June-September, and (d) October-December. Data source: CPC Merged Analysis of Precipitation (CMAP)
1.2 Global and Regional Dynamics of the GHA Climate
The Greater Horn of Africa has a vast and diverse physical environment, with very complex terrain and heterogeneous vegetation characteristics. The diversity, both in terrain and vegetation leads to varying climate characteristics that tend to match the pattern of the physical environment. This can be attributed to varied response to both local (vegetation) and large scale climatic forcing, some of which are reviewed below.
1.2.1 Large scale forcing: Teleconections
Fluctuations in sea surface temperatures (ssts) of the tropical oceans, more so, in the Atlantic and Indian Oceans have been associated with rainfall perturbations over the Greater Horn of Africa region (Mutai and Ward 1998; Bahera et al. 1999, 2005; Saji et al. 1999; Annamalai and Murtugudde 2004; Abram et al. 2008; Funk et al. 2008; William & Funk 2011; Diro et al. 2011). For instance, Nicholson and Entekhabi (1987) found a direct correlation between coastal rainfall and SST fluctuations over the GHA region. They further showed that increased rainfall over the region was also associated with positive SST anomalies in the central Indian Ocean. Similarly, Annamalai and Murtugudde (2004) associated rainfall variability over the GHA with SST anomalies over the Indian Ocean. More recently, Omondi et al. (2013) investigated the role of major oceans in decadal variability over equatorial GHA region. Using singular value decomposition (SVD) technique, they showed that the leading three SVD-coupled modes explained more than 75% of the squared covariance between the SST variability and
16
precipitation over the region. For instance, the first SVD mode for Indian, Atlantic and Pacific Oceans contributed to 50, 43 and 38% of the total square covariance for MAM season, respectively. The same mode accounted for 65, 48 and 40% for OND rainfall season, respectively and about 61, 39 and 42% of the variance during the JJA season. The study further corroborated previous findings that forcing of decadal rainfall over the region is also associated with El Niño mode that is prominent over the Pacific Ocean (Ogallo 1988; Indeje et al. 2000; Phillips and McIntyre 2000; Osman and Shamseldin 2002; Segele & Lamb 2005; Korecha & Barnston 2007), while Indian Ocean dipole is the leading mode over the Indian Ocean basin (e.g Saji et al. 1999; Birkett et al. 1999; Black et al. 2003; Clark et al. 2003; Ashok et al. 2004; Yamagati et al. 2004; Schott et al. 2009; Ummenhofer et al. 2009; Zheng et al. 2013) and that an inter-hemispheric dipole mode that is a kin to the ENSO phenomenon in the pacific (Saravan and Chang 2000; Xie and Carton 2004; Keenlyside and Latif 2007; Polo et al. 2008) is a prominent feature in the Atlantic Ocean forcing regional decadal rainfall.
As global warming continues, SSTs are expected to rise. For example, Williams and Funk (2011) observes that during the past few decades, each 1 degree rise in global average temperature has boosted Indian Ocean SST by about 1.5 degree. However there still exists disagreement on the impact of the Indian Ocean SST rise on GHA climate. For instance IPCC (2007) projects an enhanced precipitation over most of the equatorial GHA while William and Funk (2011) and Held and Soden (2006) anticipate a continued decrease in precipitation over most of equatorial GHA due to weakening of the Walker circulation cell.
Most, if not all of the extreme climate events over the GHA region have been associated with the El Niño/Southern Oscillation (ENSO) phenomenon, tropical cyclone activity, SST anomalies,
17
and anomalies in monsoon wind systems, among many other regional systems (Camberlin et al. 2004). ENSO events for example have a strong influence on the Inter-Tropical Convergence Zone (ITCZ), regional monsoon wind circulation, and pattern of rainfall over the sub region (Ambeje 2000, Indeje et al. 2000). The impacts, however, vary significantly from season to season and location to location. For example, El Niño episodes are often associated with above-normal rainfall conditions over the equatorial parts of eastern Africa during October to December and below-normal rainfall over much of the Horn of Africa during the June to September rainfall season. On the other hand, La Niña events often has been linked to below-normal rainfall over much of the Greater Horn of Africa during October to December and March to May and above-normal rainfall during the June to September rainfall season (Gissila et al. 2004; Riddle and Cook 2008).
East-west SST variability over the Indian Ocean has also been linked to rainfall variability over the African region and parts of Asian continent (e.g Hastenrath et al. 1993; Behera and Yamagata 2003; Saji et al. 1999; Black et al. 2003). Over equatorial east Africa, the zonal dipole mode over the Indian Ocean (IODZM - Saji et al. 1999; Birkett et al. 1999; Black et al. 2003; Clark et al. 2003; Ashok et al. 2004) has been linked to short rains (October–December – OND). For instance, Birkett et al. (1999) suggested that the abnormal East African rainfall during fall 1997 that resulted in rapid rise in regional lake levels was due to Indian Ocean SST. This has since been corroborated by Anyah and Semazzi (2006) who showed that coupled ENSO and IODZM effects led to the abnormal rainfall witnessed over the GHA region during fall. Black et al. (2003) while examining the role of IODZM on the African monsoon system during boreal fall, focusing separately on the rainfall variations over the equatorial region and regions slightly to the south of equator, noted a double digit increase in standard deviation of rainfall over East
18
Africa as compared to the southern region. Similarly, analyses of more than 40 years of data by Behera et al. (2003) concluded that the East African rainfall is largely influenced by IODZM. While there has been a debate on whether IODZM mode is independent of ENSO influence (e.g Allan et al. 2001; Dommenget and Latif 2002, 2003; Dommenget 2010; Behera et al. 2002), there is however a general agreement that the influence of IODZM on East African rainfall is asymmetric, with above/below average rainfall occurring during OND in the course of a positive/negative IOD phase.
1.2.2 Inter-Tropical Convergence Zone (ITCZ) Influence
The climate of the GHA region has strong annual and seasonal cycles, with precipitation being the parameter with the highest space–time variability. The periodic north–south migration of precipitation presents the region with four seasons; December-February (DJF), March–May (MAM), June–September (JJAS) and October-December (OND), with two seasons, MAM and OND, of rainfall received within the equatorial zone, and one season each over the south (DJF) and northern (JJAS) of GHA region. These rainfall patterns are mainly controlled by the seasonal migration of the Inter-Tropical Convergence Zone (ITCZ). The ITCZ is a quasi-continuous belt of unsettled, often rainy weather around the tropics, sandwiched between generally fine weather to the north and south of the subtropical highs (Nicholson 1986). It is associated with the convergence of air-streams from the subtropical highs. Where these flows meet, strong upward motion occurs that causes rainfall if the air contains sufficient moisture. It is therefore a region of large-scale convergence of the inter-hemispheric tropical monsoonal wind systems that generally move meridionally with the overhead sun.
19
1.2.3 Intraseasonal variability: Quasi-Biennial Osciallation (QBO) and Madden-Julian Oscillation (MJO)
Lower equatorial stratospheric (30-mb) zonal winds from easterly to westerly and vice versa with a periodicity of approximately 28 months have also been associated with climate variability over the tropical Africa (Jury et al. 1994; Indeje and Semazzi 2000). The stratospheric Quasi-biennial Oscillation (QBO) plays a role in modulating rainfall over parts of Africa. The Walker circulation cell connecting Africa and the Indian Ocean interacts with the QBO, and during its westerly phase, rising tropospheric motion occurs over Africa (Indeje and Semazzi 2000). During the QBO easterly phase, tropical cyclones are more frequent in the Indian Ocean and convection increases significantly over Madagascar (Jury et al. 1994). Increased cyclones over the western Indian Ocean drains most of the moisture from the neighboring African continent leaving the land relatively dry (Ogallo et al. 1988; Ogallo et al. 1994; Shanko and Camberlin 1998). Shanko and Camberlin (1998) have also shown that years exhibiting consecutive occurrence of several tropical depressions/cyclones over the southwest Indian Ocean coincided with the drought years in Ethiopia. A study by Indeje and Semazzi (2000) estimated that about 36% of rainfall variability over Eastern Africa during the long rainfall season is associated with the QBO in the lower equatorial stratospheric zonal winds and further suggested that the relative role of QBO and rainfall over Eastern Africa is stronger in the time-lag sense than the simultaneous relationship.
The GHA climate has also been characterized at the intraseasonal timescale by the succession of wet and dry spells. This has been associated by a mode of variability known as Madden-Julian Oscillation (MJO- Madden and Julian 1971, 1972). MJO has been known for years to be the
20
dominant mode of intraseasonal climate variability over the Indian and the West Pacific Oceans. MJO propagates eastward around the global tropics with a periodicity of around 30-60 days (Salby and Hendon 1994; Zhang 2005).
In Equatorial GHA region it has been found that precipitation is significantly modulated by MJO during both the MAM and OND rainy seasons (Pohl and Camberlin 2006a). The rainfall responses however are spatially different, for instance, Pohl and Camberlin (2006a) reports that the eastern region (Kenyan coast) precipitation index is out of phase with the index in the western region (Highland region). The difference was found to reflect the influence of local topography and large-scale zonal gradients of mean sea level pressure (MSLP) between the Atlantic and Indian Ocean basins. Generally, eastern region experiences a rainfall peak associated with easterly advection of moisture from the Indian Ocean, corresponding to low (high) MSLP over the Atlantic (Indian) basins. On the other hand, the rainiest periods in western region is estimated to start from deep atmospheric convection, and a reversed anomaly of the pressure gradient between the two oceans. These opposite patterns are triggered by the MJO cycle and materialize in its opposite phases.
1.2.4 Forcing due to Land Surface Characteristics
The primary source of energy driving most atmospheric circulations is at the surface of the earth (Seth and Giorgi 1996; Zheng et al. 1997; Chase et al. 1999). The land surface characteristics that include the surface roughness, albedo, moisture availability, among others control the land-atmosphere interactions. These surface conditions play a major role in the turbulence transfer of mass, momentum and heat in the Planetary Boundary Layer (PBL), hence providing a vital link between the atmosphere and the surface of the earth.
21
Changes in land cover as a result of human activities on land is an important forcing to climate (Bonan 1997; Copeland et al. 1996; Olson et al. 2008). Human uses of land such as cultivation, grazing, forest clearing and forest regrowth on abandoned farm lands affect climate by altering net radiation at the surface, portioning of available energy into sensible and latent heat and portioning of precipitation into runoff and evapotranspiration (Chase et al. 1999, 2000; Feddema et al. 2005). This arises from the differences in land cover types that can either be of vegetated or none vegetated. Vegetation types also differ in albedo, surface roughness, stomatal conductance and leaf area index.
1.3 Objectives and Scientific Questions
The overarching motivation of this thesis research is to use both Earth System Model output (from CMIP5 archive) and Regional Climate Model (RCM) simulations to characterize and understand physical and dynamical processes associated with 20th and 21st century spatiotemporal modes of climate variability and changes over the GHA region.
The two main objectives and associated hypotheses are as follows;
Objective 1: Undertake a comprehensive analysis of the key physical and dynamical processes associated with the Horn of Africa 20th and 21st century climate variability, trends and changes using outputs from an ensemble of the current family of Earth System Models (ESMs), that we also employ in the latest IPCC, AR5 assessments.
22
Hypothesis: The current ESMs are able to better reproduce the physical modes and forcings of historical climate variability and extremes over the Horn of Africa, as well as the primary physical and dynamical processes controlling the same.
To test the above hypothesis, our activities are aimed at answering the following questions;
• How realistic is the representation of east-west temperature gradient over the Indian Ocean (Indian Ocean Dipole-IOD pattern) and ENSO influence over the GHA in the current ESMs?
• Are the ESMs capable of representing the unique characteristics and regional (GHA) responses to different IOD and/or ENSO episodes
• How well are GCM representations of Intra-seasonal and seasonal variability modes (e.g MJO and QBO) to the predictability and prediction of GHA climate?
Objective 2: Characterize and understand trends and response of the hydrologic cycle and key driving processes, over different sub regions of the Horn of Africa during the recent decades and in the near-term future. Both Global Model Output and high-resolution Regional Climate Model simulations are analyzed and also compared.
Hypothesis: Different terms in the hydrological cycle vary and respond differently to climate variability and near-term projected climate change over different GHA sub regions and will change uniquely due to global warming in the near future and this can be better captured in a high resolution climate model.
To test the above hypothesis, our research activities will try to answer the following specific questions also;
23
• Under different climate change scenarios are there specific changes to water balance terms and thus the hydrological cycle over different parts of the GHA?
• How can representation of key parameters responsible for regional hydrological cycle changes be improved by adopting high resolution regional climate models?
• Can coupled Land-Atmosphere model better represent observed climate variability under different land use/vegetation change scenarios?
1.4 Organization of the Thesis
This thesis is organized in various chapters as follows;
• The first chapter gives a brief description of factors, both local (e.g land use/land cover change, topography and inland water bodies) and large scale (e.g ENSO and IOD events), that control climate over the Horn of Africa.
• In chapter 2 we undertake a comprehensive analysis of the fith phase of the coupled model intercopmarison project phase 5 (CMIP5) output in comparison to observed and reanalyzed data sets. This chapter also interrogates uncertainty in both observations and climate models.
• Chapter 3 focuses on CMIP5 projected climate over the Greater Horn of Africa. In this chapter we look at the projected changes in hydrologic cycle under both RCP4.5 and 8.5. The projected change in hydrologic cycle is interrogated in terms of changes in precipitation and evaporation. We also analyze the projected changes in extremes of precipitation under both RCP’s
24
• In chapter 4 we analyze coordinated regional climate downscaling experiment (CORDEX), focusing on the projected changes in hydrologic cycle as in chapter 3. This high resolution data is analyzed and compared to the GCMs output in chapter 3.
25
CHAPTER 2
Drivers of the 20th century (contemporary) climate over the Greater Horn of Africa: CMIP5 OGCMs simulations
2.1 Introduction
The entire African continent is the least studied region in terms of ecosystem dynamics and climate variability (IPCC 2007, Shongwe et al. 2011). Thus, the primary mechanisms associated with coupled climate human-ecosystem changes are not well understood. This may be attributed to the fact that any comprehensive assessment of the potential impacts of climate change on many of Africa’s natural ecosystems is hampered by the complexity of African regional climates and the influence of regional geographic features, such as deserts, land cover variations, mountain chains, large lakes, land-sea contrasts and the sea surface temperatures (SSTs) of the surrounding Indian and Atlantic oceans. Such diversity influences the distribution and statistics of daily rainfall and extremes and the onset and evolution of the monsoon rainy season (Cook & Vizy 2008, Sylla et al. 2010).
Hence, spatial and temporal variability of rainfall over most parts of Africa and dramatic changes in extremes of rainfall events offers considerable challenges for assessing and understanding climate change over the continent, which in turn may have a much greater impact on natural systems and human activities. An assessment of climate change projections over the continent thus requires a careful evaluation of a model’s ability to simulate fine temporal scale hydroclimatic variables and the structure and daily evolution of the African monsoon systems.
However, except for localized regions that contain dense long-term in situ measurement networks, rain gauges are scarce over Africa. As a result, rain gauge networks have not been often used to document precipitation variability over the continent (New et al. 2006, Aguilar et
26
al. 2009, Sylla et al. 2012), and these measurements are insufficient for quantifying model biases. Hence, satellite-derived products developed in recent years are widely used as an alternative for evaluating climate output over many regions, including Africa (e.g., Rocha et al. 2008, Shongwe et al. 2009, 2011, Williams et al. 2010, Sylla et al. 2010, 2012, Vizy and Cook 2012, Otieno and Anyah 2012). A number of satellite-derived products as well as available in situ observations are employed in this study to evaluate Global Climate Models (GCMs outputs and understand large scale processes linked to 20th and 21st century climate variability over the
Horn of Africa. But Is still important to note that the merged precipitation products also experience uncertainties related to merging sparse and insufficient observations, errors associated with satellite measurements, extraction algorithms, and interpolation techniques (Yamamoto et al. 2008, Sylla et al. 2012). Still, merged observations currently provide the best product for evaluating models’ ability to simulate climate events over Africa.
Uncertainty has been part of climate change research and applications, present in every phase, from the physical science (e.g., projections of future climate) to the impacts through to the effort to make decisions regarding mitigation and adaptation across different temporal and spatial scales. While many processes are represented in models by fundamental physical equations, parameterizations are also employed to approximate certain processes. The scientific knowledge on which such parameterizations are based comes from studying the current climate and proxy studies of past climate and, as such, their ability to simulate the climate under different forcing conditions may potentially be limited (Tebaldi et al. 2005).
The primary aim of this part of the thesis research comprehensively analyze the new general circulation models (GCM) generations in order to interrogate their ability to reproduce key
27
features of the contemporary climate of the GHA and isolate consistency/inconsistency between models.
Therefore, in this chapter we undertake a comprehensive evaluation of the new Earth System models (ESMs) output over the GHA region. Our focus is to test the ability of ten ESMs to reproduce present day climate conditions. These results are expected to provide validation of the current CMIP5 models over the GHA region that would act as a basis for selecting models for projection studies. Quantification of the model error is important, since poor performance in present climate conditions is associated with outlier-like behavior in the projection period (Knutti et al. 2010, Brands et al. 2011b).
2.2 Data
The data that forms the basis of this part of the study are derived from the new generation of the Earth System Models (ESMs) available to through the Program for Climate Model Diagnosis and Inter-comparison (PCMDI) archive (www.pcmdi.llnl.gov). Relative to the third phase, the fifth phase of the Climate Model Intercomparison project (CMIP5) incorporates additional components describing the atmosphere interaction with land use and vegetation, such that, for the first time in CMIP, some of the Atmospheric Ocean General Circulation Models (AOGCMs) have been coupled to biogeochemical components that account for the fluxes of carbon between the atmosphere, ocean and terrestrial biosphere reservoirs, thereby closing the carbon cycle in the model (Taylor et al. 2012). Our primary goal in this study is to evaluate performance in present climate conditions, particularly how a subset of the CMIP5 models simulate the climatology of the Greater Horn of Africa. We thus consider only a subset of the AMIP runs of the CMIP5
28
family. The AMIP runs are model simulations in which an AGCM is constrained by realistic/observed sea surface temperatures (SSTs) and sea ice from 1979 to near present, with a comprehensive set of fields saved for diagnostic research.
We specifically analyze monthly data for 10 GCMs from PCMDI archive. Some of the models have single realizations for the 20th and 21st centuries, while some models have multiple realizations/simulations (table 2.1). The models were picked at random, with the only consideration being that the time period stretches from 1979-2008 and having at least two ensemble members. The idea of considering models with at least two members was to capitalize on the consensus representation of the best effort made by each independent single member. For this exercise we are only considering precipitation and TOA outgoing longwave radiation.
Table 2.1: CMIP5 Earth System Models considered in this study
Model Runs Reference
CanAM4 4 Scinocca et al. (2008).
CSIRO-Mk3.6 10 Rotstayn et al. (2010) GFDL-HIRAM-C180 3 Anderson et al. (2004) GISS-E2-R 5 HanSen et al. (2007) IPSL-CM5A 5 Dufresne et al. (2012) MIROC5 2 Watanabe et al. (2011) MPI-ESM-LR 3 Raddatz et al. (2007) MPI-ESM-MR 3 Raddatz et al. (2007), MRI-CGCM3 3 Yukimoto et al. (2011)