EXAMINING THE EFFECTS OF AN ECO-DRIVING SYSTEM ON DRIVER DISTRACTION
by
HOSSEIN ROUZIKHAH
Master of Road and Transportation Engineering, University of Tehran, Iran Bachelor of Civil Engineering, University of Tabriz, Iran
A THESIS
Submitted in partial fulfillment of the requirements for the degree
MASTER OF APPLIED SCIENCE (HL84)
The Centre for Accident Research and Road Safety – Queensland (CARRS-Q) QUEENSLAND UNIVERSITY OF TECHNOLOGY
Brisbane, Australia
June 2012
Supervisors: Dr. Mark King Professor Andry Rakotonirainy
One who has wisdom is powerful.
Ferdowsi (940–1020 CE)Page I
Abstract
Driver distraction has recently been defined by Regan as “the diversion of attention away from activities critical for safe driving toward a competing activity, which may result in insufficient or no attention to activities critical for safe driving (Regan, Hallett & Gordon, 2011, p.1780)”. One source of distraction is in-vehicle devices, even though they might provide other benefits, e.g. navigation systems. Currently, eco-driving systems have been growing rapidly in popularity. These systems send messages to drivers so that driving performance can be improved in terms of fuel efficiency. However, there remain unanswered questions about whether eco-driving systems endanger drivers by distracting them. In this research, the CARRS-Q advanced driving simulator was used in order to provide safety for participants and meanwhile simulate real world driving. The distraction effects of tasks involving three different in-vehicle systems were investigated: changing a CD, entering a five digit number as a part of navigation task and responding to an eco-driving task. Driving in these scenarios was compared with driving in the absence of these distractions, and while drivers engaged in critical manoeuvres. In order to account for practice effects, the same scenarios were duplicated on a second day. The three in-vehicle systems were not the exact facsimiles of any particular existing system, but were designed to have similar characteristics to those of system available.
In general, the results show that drivers’ mental workloads are significantly higher in navigation and CD changing scenarios in comparison to the two other scenarios, which implies that these two tasks impose more visual/manual and cognitive demands. However, eco-driving mental workload is still high enough to be called marginally significant (p ~ .05) across manoeuvres. Similarly, event detection tasks show that drivers miss significantly more events in the navigation and CD changing scenarios in comparison to both the baseline and eco-driving scenario across manoeuvres.
Analysis of the practice effect shows that drivers’ baseline scenario and navigation scenario exhibit significantly less demand on the second day. However, the number of missed events across manoeuvres confirmed that drivers can detect significantly more events on the second day for all scenarios.
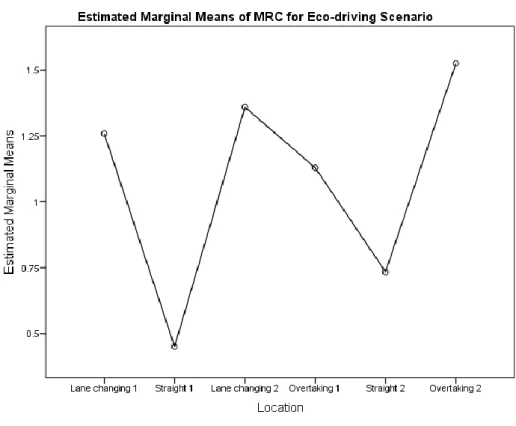
Distraction was also examined separately for five groups of manoeuvres (straight, lane changing, overtaking, braking for intersections and braking for roundabouts), in two locations for each condition. Repeated measures mixed ANOVA results show that reading an eco-driving message can potentially impair driving performance. When comparing the three in–vehicle distractions tested, attending to an eco-driving message is similar in effect to the CD changing
Page II In lane changing manoeuvres, drivers’ missed response counts degraded when they engaged in reading eco-driving messages at the first location. However, drivers’ event detection abilities deteriorated less at the second lane changing location. In baseline manoeuvres (driving straight), participants’ mean minimum speed degraded more in the CD changing scenario. Drivers’ lateral position shifted more in both CD changing and navigation tasks in comparison with both eco-driving and baseline scenarios, so they were more visually distracting. Participants were better at event detection in baseline manoeuvres in comparison with other manoeuvres. When approaching an intersection, the navigation task caused more events to be missed by participants, whereas eco-driving messages seemed to make drivers less distracted. The eco-eco-driving message scenario was significantly less distracting than the navigation system scenario (fewer missed responses) when participants commenced braking for roundabouts.
To sum up, in spite of the finding that two other in-vehicle tasks are more distracting than the eco-driving task, the results indicate that even reading a simple message while driving could potentially lead to missing an important event, especially when executing critical manoeuvres. This suggests that in-vehicle eco-driving systems have the potential to contribute to increased crash risk through distraction. However, there is some evidence of a practice effect which suggests that future research should focus on performance with habitual rather than novel tasks. It is recommended that eco-driving messages be delivered to drivers off-line when possible.
Page III This thesis is dedicated to my father, who passed away a few months ago but left invaluable good memories for his family. It is also dedicated to all of my family members, especially my wife, Shabnam, for her endless support.
Page IV
1-1- Introduction ... 2
1-2- Road Safety Overview Worldwide ... 2
1-3- Road Safety Status in Australia ... 2
1-4- What is Driver Distraction?... 3
1-5- Is Driver Distraction a Road Safety Issue? ... 4
1-6- Eco-driving systems and Eco-driving behaviour ... 6
Chapter 2 - Literature Review ... 9
2-1- Introduction ... 10
2-2- In-vehicle Distraction ... 11
2-3- In-vehicle Navigation Systems ... 13
2-4- Radio Tuning/CD players ... 17
2-5- Eco-driving ... 19
2-6- Practice Effect ... 20
2-7- Location of Distraction ... 22
2-8- Individual Differences in Driver Distraction ... 23
2-8-1- Age ... 24
2-8-2- Distraction Caused by Mobile Phone & Age ... 25
2-8-3- Relationship between Age and Driving Experience... 29
2-8-4- Gender ... 30
2-8-5- Conclusion ... 31
2-9- Measures of Driver Distraction ... 32
2-9-1- Mental Workload ... 32
2-9-2- Driver Distraction and Situational Awareness ... 33
2-9-3- Measures of Driving Distraction ... 35
2-9-4- Secondary Task Mental Measurement ... 38
2-9-5- Choosing Driving Performance Measures ... 41
2-9-6- Reference Tasks ... 42
2-10- Application of Cognitive and Behavioural Models in Driver Distraction ... 42
2-10-1- Introduction ... 42
2-10-2- Driver Behaviour Model ... 43
2-10-3- The Multiple Resource Model Theory ... 44
2-10-4- Summary and Conclusion ... 46
2-11- Research Questions ... 47
2-12- Scope of Research ... 49
Chapter 3 - Methodology and Research Design ... 50
3-1- Introduction ... 51
3-2- Design of Research... 52
3-2-1- Network Creation for the Proposed Research ... 52
3-2-2-Dependent and Independent variables ... 54
Page V
3-5- Apparatus ... 65
3-5-1- Advanced Driving Simulator ... 65
3-5-2- Driving Lab Simulator ... 68
3-5-3- Communication System and Data Synchronisation ... 68
3-5-4- Eco-driving System ... 69
3-5-5- Navigation System ... 70
3-5-6- CD player ... 71
3-6- Data Analysis... 72
3-7- Research Ethics/Statement ... 74
Chapter 4 - Data Analysis and Results ... 75
4-1-Introduction ... 76
4-2- Data Analysis for the First Day (entire road network) ... 76
4-2-1- DALI Mental Workload ... 76
4-2-2- Missed Response Count ... 80
4-2-3- Summary ... 81
4-3- Analysis of Manoeuvres (first day) ... 82
4-3-1- Summary Results for No Particular Manoeuvre (baseline manoeuvre) ... 82
4-3-2- Summary Results for Lane Changing Manoeuvres ... 83
4-3-3- Summary Results for Overtaking Manoeuvres ... 84
4-3-3- Summary Results for Commence Braking Task at Intersections ... 85
4-3-5- Summary Results for Commence Braking Task at Roundabouts ... 86
4-3-6- Summary of First Day Data Analysis ... 87
4-4- An Analysis on the Practice Effect (entire road network) ... 89
4-4-1- DALI Mental Workload ... 89
4-4-2- Missed Response Count ... 91
4-4-3- Wrong Response Count ... 92
4-4-4- Summary for Practice Effect on Entire Network ... 93
4-5- Practice Effect on Driving Measures Based on Type of Manoeuvre ... 94
4-5-1 Practice Effect for Baseline Manoeuvre ... 94
4-5-2 Practice Effect for Lane Changing Manoeuvre ... 96
4-5-3 Practice Effect for Overtaking Manoeuvre ... 97
4-5-4 Practice Effect for Braking for Intersections Manoeuvre ... 99
4-5-5 Practice Effect for Braking for Roundabouts Manoeuvre ... 100
4-5-6 Summary Results of Practice Effect on Driving Measures Based on Type of Manoeuvre ... 101
4-6- Manoeuvres Comparison Based on Distraction Measures (first day) ... 101
4-6-1- Straight, Lane Changing and Overtaking Manoeuvres ... 102
4-6-2- Intersections and Roundabouts ... 114
Chapter 5 - Discussion and Conclusions ... 116
5-1- Summary ... 117
5-1- Thesis Outcomes Based on Research Questions ... 117
5-1-1- Does the Use of an Eco-driving System Distract Drivers in a Driving Simulator more than Two Other In-Vehicle Activities? ... 118
5-1-2- Is There a Practice Effect which Reduces the Level of Distraction under the Study Circumstances? ... 120
5-1-3-Do the Systems Have an Effect on Driver Performance When Drivers Engage in Particular Manoeuvres? ... 122
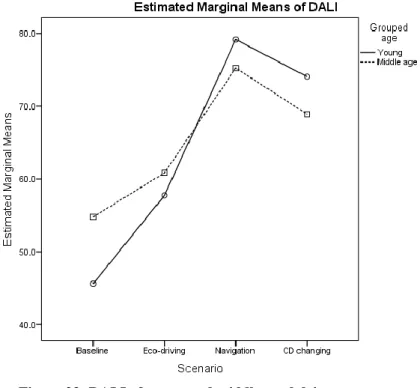
5-1-4- Are There any Differences between Young (Novice) and Middle-Aged (Experienced) Drivers, or Between Male and Female Drivers when They Get Distracted? ... 123
Page VI 5-4- Future Work ... 127 5-5- Contribution to Knowledge ... 128
Page VII
Table 1: Factors affecting workload extracted from (de Waard, 1996, p.20) ... 33
Table 2: Measuring locations order ... 61
Table 3: Summary of drivers rating to Motion Sickness Assessment Questionnaire (MSAQ); first day ... 63
Table 4: Summary of drivers’ ratings for Motion Sickness Assessment Questionnaire (MSAQ); second day ... 64
Table 5: Descriptive statistics of DALI for entire network ... 76
Table 6: Pair-wise comparisons of DALI mental workload in entire network ... 78
Table 7: Descriptive statistics of DALI based on gender ... 78
Table 8: Pair-wise comparisons of DALI mental workload based on gender... 78
Table 9: Descriptive statistics of DALI based on age group ... 79
Table 10: Pair-wise comparisons of DALI mental workload based on aged group ... 79
Table 11 : Descriptive statistics of MRCs for entire network ... 80
Table 12: Pair-wise comparisons of MRCs ... 81
Table 13: Summary of significant results, baseline manoeuvre, first day ... 83
Table 14: Summary of significant results, lane-changing, first day ... 84
Table 15: Summary of significant results, overtaking, first day ... 85
Table 16: Summary of significant results, Intersection, first day... 86
Table 17: Summary of significant results, braking at roundabouts, first day ... 87
Table 18: Summary of significant pair-wise comparisons of eco-driving scenario with all other scenarios (Lane changing, overtaking and baseline manouveres) ... 88
Table 19: Summary of significant pair-wise comparisons of eco-driving scenario with all other scenarios (Roundabouts and intersections) ... 88
Table 20: Summary of significant results, baseline manoeuvre, practice effect ... 95
Table 21: Summary of significant results, lane-changing, practice effect ... 97
Table 22: Summary of significant results, overtaking, practice effect ... 98
Table 23: Summary of significant results, intersection, practice effect ... 99
Table 24: Summary of significant results, braking at roundabouts, practice effect ... 101
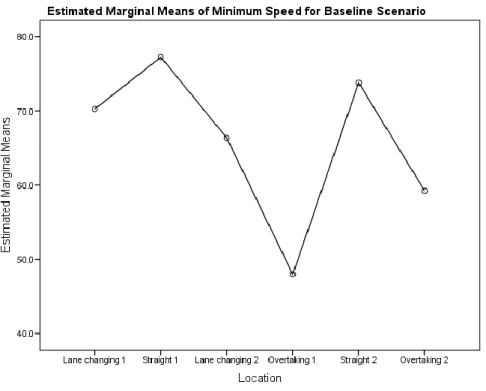
Table 25: Descriptive statistics of Minimum speed for baseline scenario... 102
Table 26: Pair-wise comparisons of minimum speed for baseline scenario ... 103
Table 27: Descriptive statistics of Minimum speed for in-motion locations in eco-driving scenario . 104 Table 28: Pair-wise comparisons of Minimum speed for in-motion locations in eco-driving scenario ... 104
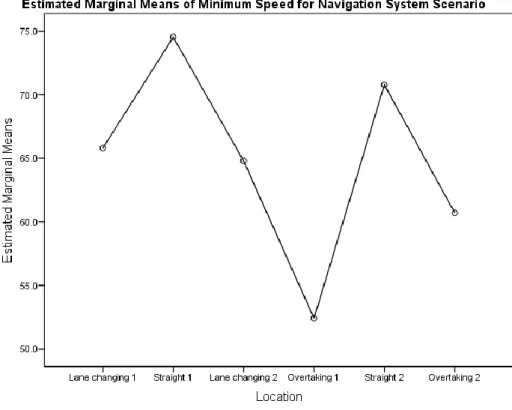
Table 29: Descriptive statistics of Minimum speed for navigation scenario ... 105
Table 30: Pair-wise comparisons of Minimum speed for navigation scenario ... 106
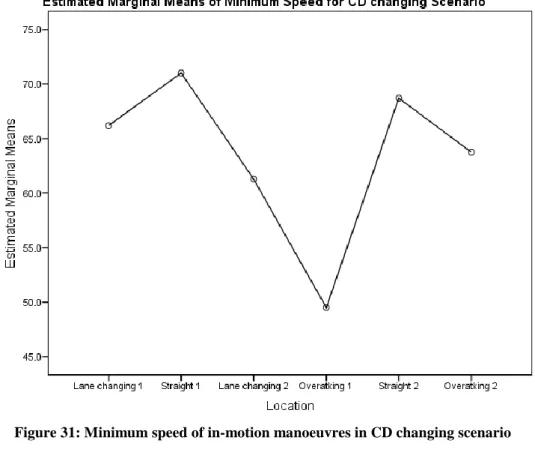
Table 31: Descriptive statistics of Min speed for CD changing scenario ... 107
Table 32: Pair-wise comparisons of Minimum speed for CD changing scenario ... 107
Table 33: Descriptive statistics of MRC for baseline scenario ... 108
Table 34: Pair-wise comparisons of MRC for baseline scenario ... 109
Table 35: Descriptive statistics of MRC for eco-driving scenario ... 109
Table 36: Pair-wise comparisons of MRC for eco-driving scenario ... 110
Table 37: Descriptive statistics of MRC for navigation scenario ... 111
Page VIII
Table 41: Summary of significant results in comparisons between all manoeuvres and first straight
driving at location ... 113
Table 42: Pair-wise comparisons of MRC for baseline scenario (intersections and roundabouts) .... 114
Table 43: Descriptive statistics of minimum speed across scenarios at location 2 ... 136
Table 44: Descriptive statistics of standard deviation of lane lateral shift for location 2 ... 138
Table 45: Descriptive statistics of standard deviation of steering wheel at location 2 ... 139
Table 46: Pair-wise comparisons of standard deviation of steering wheel at location 2 ... 140
Table 47: Descriptive statistics of MRCs across scenarios at location 2 ... 141
Table 48: Descriptive statistics of minimum speed at location 9 ... 142
Table 49: Descriptive statistics of standard deviation of lane lateral shift at location 9 ... 144
Table 50: Descriptive statistics of standard deviation of steering wheel at location 9 ... 145
Table 51: Pair-wise comparisons of standard deviation of steering wheel at location 9 ... 146
Table 52: Descriptive statistics for minimum speed at location 1 ... 148
Table 53: Descriptive statistics of standard deviation of lateral shift at location 1 ... 150
Table 54: Descriptive statistics of standard deviation of steering wheel ... 151
Table 55: Descriptive statistics of WRCs at location 1 ... 152
Table 56: Descriptive statistics of MRCs at location 1 ... 154
Table 57: Pair-wise comparisons of MRCs at location 1 ... 155
Table 58: Descriptive statistics of minimum speed at location 4 ... 156
Table 59: Descriptive statistics of Standard deviation of steering wheel across scenarios at location 4 ... 157
Table 60: Descriptive statistics of WRCs for young and middle aged drivers at location 4 ... 159
Table 61: Descriptive statistics of MRCs across scenarios at location 4 ... 161
Table 62: Descriptive statistics of minimum speed at location 5 ... 163
Table 63: Descriptive statistics of lane lateral shift at location 5 ... 164
Table 64: Descriptive statistics of Standard deviation of steering wheel at location 5 ... 166
Table 65: Descriptive statistics of MRCs at location 5 ... 167
Table 66: Descriptive statistics Mean minimum speed of drivers across scenarios at location 10 ... 168
Table 67 : Descriptive statistics of lane lateral shift at location 10 ... 169
Table 68: Descriptive statistics of standard deviation of steering wheel at location 10 ... 170
Table 69: Descriptive statistics of MRC at location 10 ... 170
Table 70: Descriptive statistics of MRCs at location 3 ... 172
Table 71: Descriptive statistics of MRCs at location 8 ... 173
Table 72: Descriptive statistics of speed at location 6 ... 175
Table 73: Descriptive statistics of MRCs at location 6 ... 175
Table 74: Descriptive statistics of acceleration at location 6 ... 177
Table 75: Descriptive statistics of speed at location 7 ... 178
Table 76: Descriptive statistics of MRCs at location 7 ... 179
Table 77: Descriptive statistics of acceleration at location 7 ... 181
Table 78: Descriptive statistics of standard deviation of lateral shift over 2 consecutive days (eco-driving scenario) ... 183
Table 79: Descriptive statistics of standard deviation of lane lateral shift across 2 consecutive days ... 187
Page IX
Table 81: Descriptive statistics for standard deviation of steering wheel over 2 consecutive days at location 9 (navigation scenario) ... 190 Table 82: Descriptive statistics of MRCs over 2 consecutive days at location 9 (baseline scenario) . 191 Table 83: Descriptive statistics of MRCs over 2 consecutive days at location 9 (eco-driving scenario) ... 192 Table 84: Gender practice differences on standard deviation of lateral shift in CD changing scenario at location 4 (CD changing scenario) ... 198 Table 85: Descriptive statistics of standard deviation of steering wheel over 2 consecutive days at location 5 (eco-driving scenario)... 204 Table 86: Descriptive statistics of minimum speed over 2 consecutive days at location 10(baseline scenario) ... 206 Table 87: Descriptive statistics of standard deviation of steering wheel over 2 consecutive days at location 10 (baseline scenario) ... 208 Table 88: Descriptive statistics of MRCs over 2 consecutive days at location 10 (CD changing
scenario) ... 210 Table 89: Descriptive statistics of acceleration over 2 consecutive days at location 6 (Age group) .. 215 Table 90: Descriptive statistics of acceleration over 2 consecutive days at location 6 (Gender) ... 216
Page X
Figure 1: Dashboard view of an eco-driving system extracted from Barbé and Boy (2006) ... 20
Figure 2: Relative risk of in-vehicle distraction fatalities and injuries extracted from Lam (2002) ... 25
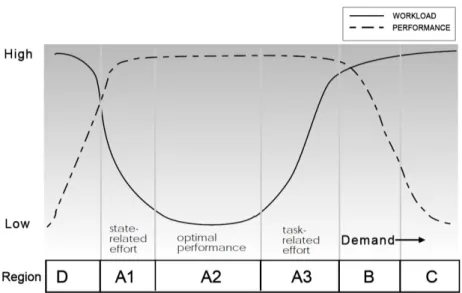
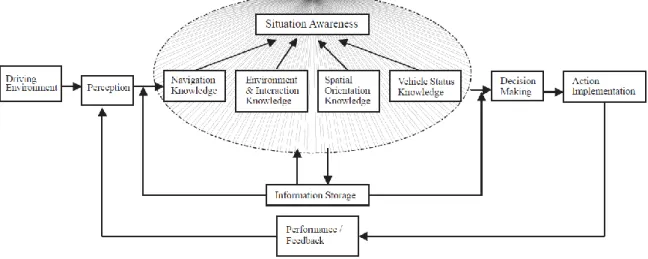
Figure 3: Relationship between workload and performance extracted from de Waard (1996, p.24) . 33 Figure 4: The information processing of driving task; situational awareness outlook extracted from Ma and Kaber (2005, p.942) ... 34
Figure 5: Driver behaviour model used by TNO (Keith et al., 2005, p.19) ... 43
Figure 6: The theory of planned behaviour (Ajzen, 1991, p.182) ... 44
Figure 7: The 4-D dimensional resource model (Wickens, 2008, p.450) ... 46
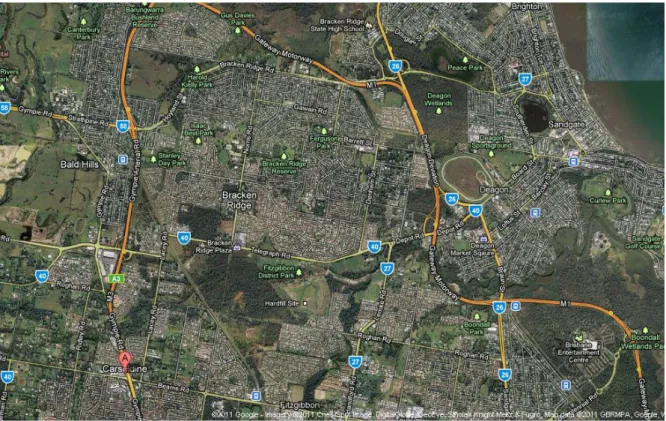
Figure 8: The network of simulated road in driving simulator ... 53
Figure 9: SCANeR software and created network of the study ... 54
Figure 10: Participants’ level of education ... 57
Figure 11: Participants’ previous experience with eco-driving ... 58
Figure 12: Participants’ frequency of changing CDs ... 58
Figure 13: Participants’ frequency of navigation system usage ... 59
Figure 14: Driving simulator’s average motion sickness symptom changes in two days ... 65
Figure 15: CARRS-Q Advanced Driving simulator (CARRS-Q, 2010) ... 68
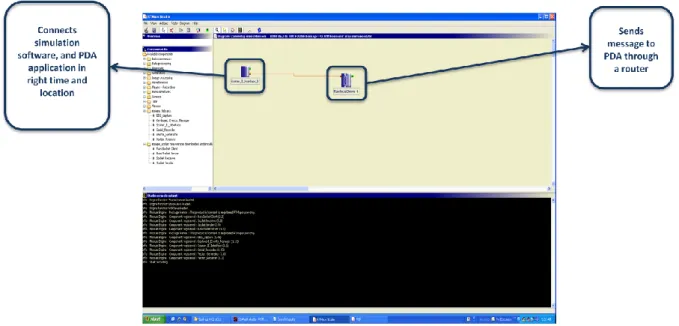
Figure 16: RTMaps diagram for synchronising sent messages in a PDA and SCANeR ... 69
Figure 17: Position of PDA holder in front of windscreen ... 70
Figure 18: Eco-driving messages on PDA ... 70
Figure 19: PDA screen in navigation scenario ... 71
Figure 20: CDs and CD player position ... 72
Figure 21: DALI mental workload for entire network across scenarios ... 77
Figure 22: DALI of male and female drivers across scenarios ... 79
Figure 23: DALI of young and middle aged drivers across scenarios ... 80
Figure 24: Missed response counts for entire network across scenarios ... 81
Figure 25: Effect of practice on drivers’ DALI mental workload ... 91
Figure 26: Effect of practice on drivers’ MRCs ... 92
Figure 27: Effect of practice on drivers’ WRCs... 93
Figure 28: Minimum speeds in all in-motion manoeuvres in baseline scenario ... 103
Figure 29: Minimum speed for in-motion manoeuvres in eco- driving scenario ... 105
Figure 30: Minimum speed of in-motion manoeuvres in navigation scenario ... 106
Figure 31: Minimum speed of in-motion manoeuvres in CD changing scenario ... 108
Figure 32: MRCs of in-motion manoeuvres in baseline scenario ... 109
Figure 33: MRCs of in-motion manoeuvres in eco-driving scenario ... 110
Figure 34: MRCs of in-motion manoeuvres in navigation scenario ... 111
Figure 35: MRCs of in move manoeuvres in CD changing scenario ... 113
Figure 36: MRCs of intersections and roundabouts in baseline scenarios ... 114
Figure 37: Minimum speed across scenarios at location 2 ... 136
Figure 38: Minimum speed of young and middle aged drivers across scenarios at location 2 ... 137
Figure 39: Minimum speed for male and female drivers across scenarios at location 2 ... 138
Figure 40: Standard deviation of lateral shift across scenarios at location 2 ... 139
Figure 41: Mean standard deviation of steering wheel across scenarios at location 2... 140
Page XI
Figure 45: Minimum speed of young and middle aged drivers across scenarios at location 9 ... 143
Figure 46: Minimum speed of male and female drivers across scenarios at location 9 ... 144
Figure 47: Standard deviation of lateral shift across scenarios at location 9 ... 145
Figure 48: Standard deviation of steering wheel across scenarios at location 9... 146
Figure 49: WRCs of drivers across scenarios at location 9 ... 147
Figure 50: MRCs of drivers across scenarios at location 9 ... 147
Figure 51: Minimum speed of young and middle aged drivers across scenarios at location 1 ... 149
Figure 52: Minimum speed of male and female drivers across scenarios at location 1 ... 149
Figure 53: Standard deviation of lateral shift across scenarios at location 1 ... 150
Figure 54: Standard deviation of steeing wheel across scenarios for location 1 ... 151
Figure 55: Standard deviation of steering wheel for male and female drivers across scenarios at location 1 ... 152
Figure 56: WRCs across scenarios at location 1 ... 153
Figure 57: Young and middle aged drivers’ WRCs across different scenarios at location 1 ... 153
Figure 58: Male and female drivers’ WRCs across different scenarios at location 1 ... 154
Figure 59: MRCs across different scenarios in location 1 ... 154
Figure 60: Minimum speed of drivers across scenarios at location 4 ... 156
Figure 61: Standard deviation of lateral shift across scenarios at location 4 ... 157
Figure 62: Standard deviation of steering wheel across scenarios at location 4... 158
Figure 63: WRCs across scenarios at location 4 ... 159
Figure 64: WRCs of young and middle aged drivers across scenarios at location 4 ... 160
Figure 65: WRCs of male and female drivers across scenarios at location 4 ... 160
Figure 66: MRCs across scenarios at location 4 ... 161
Figure 67: MRCs for young and middle aged drivers across scenarios at location 4 ... 162
Figure 68: MRCs for male and female drivers across scenarios at location 4 ... 162
Figure 69: Minimum speed of drivers across scenarios at location 5 ... 163
Figure 70: Lateral shift of drivers across scenarios at location 5 ... 164
Figure 71: Lateral shift of young and middle aged drivers across scenarios at location 5 ... 165
Figure 72: Lateral shift of male and female drivers across scenarios at location 5 ... 165
Figure 73: Standard deviation of steering wheel across scenarios at location 5... 166
Figure 74: MRCs across scenarios at location 5 ... 167
Figure 75: Minimum speed of drivers across scenarios at location 10 ... 169
Figure 76: Lateral shifts across scenarios at location 10... 169
Figure 77: Standard deviation of steering wheel across scenarios at location 10... 170
Figure 78: MRCs across scenarios at location 10 ... 171
Figure 79: MRCs across scenarios at location 3 ... 173
Figure 80: MRCs across scenarios at location 8 ... 174
Figure 81: Mean speed of drivers across scenarios at location 6 ... 175
Figure 82: MRCs across scenarios in location 6 ... 176
Figure 83: MRCs of male and female drivers across scenarios at location 6 ... 177
Figure 84: Acceleration across scenarios at location 6 ... 178
Figure 85: Mean speed across scenarios at location 7 ... 179
Page XII
Figure 89: Standard deviation of lateral shift for young and middle aged drivers over 2 consecutive days at location 2 (eco-driving scenario) ... 183 Figure 90: Minimum speed for male and female drivers over 2 consecutive days at location 9
(baseline scenario) ... 186 Figure 91: Minimum speed for young and middle aged drivers over 2 consecutive days at location 9 (navigation system) ... 187 Figure 92: Standard deviation of lateral shift for young and middle-aged drivers over 2 consecutive days at location 9 (baseline scenario) ... 188 Figure 93: Standard deviation of lane lateral shift for young and middle-aged drivers over 2
consecutive days at location 9 (eco-driving scenario) ... 189 Figure 94: Standard deviation of steering wheel for males and females over 2 consecutive days at location 9 (navigation system) ... 190 Figure 95: MRCs of young and middle-aged drivers over 2 consecutive days at location 9 (baseline scenario) ... 192 Figure 96: MRCs of young and middle-aged drivers across over 2 consecutive days at location 9 (eco-driving scenario) ... 193 Figure 97: Minimum speed of young and middle aged drivers over 2 consecutive days at location 1 (Baseline scenario) ... 194 Figure 98: Minimum speed of male and female drivers over 2 consecutive days at location 1 (Eco-driving scenario) ... 195 Figure 99: Standard deviation of lateral shift of male and female drivers over 2 consecutive days at location 4 (CD changing scenario) ... 198 Figure 100: WRCs of young and middle aged drivers over 2 consecutive days at location 4 (Baseline scenario) ... 199 Figure 101: WRCs of young and middle aged drivers over 2 consecutive days at location 4 (navigation system) ... 200 Figure 102: Standard deviation of steering wheel for young and middle-aged drivers over 2
consecutive days at location 5 (eco-driving scenario) ... 204 Figure 103: Minimum speed of male and females drivers over 2 consecutive days at location 10 (baseline scenario) ... 206 Figure 104: Standard deviation of steering wheel for young and middle-aged drivers over 2
consecutive days at location 10 (baseline scenario) ... 208 Figure 105: MRCs for male and female drivers over 2 consecutive days at location 10 (CD changing scenario) ... 210 Figure 106: MRCs of male and female drivers over 2 consecutive days at location 8 (CD changing scenario) ... 213 Figure 107: Acceleration of male and female drivers over 2 consecutive days at location 6 (Age group) ... 216 Figure 108: Acceleration of male and female drivers over 2 consecutive days at location 6 (Gender) ... 217
Page XIII
Appendices
Appendix 1 : Motion Sickness Assessment Questionnaire (MSAQ) ... 131
Appendix 2 : DALI (Driving Activity Load Index) Mental Workload Questionnaire ... 132
Appendix 3 : Demographic questionnaire ... 134
Appendix 4 : Summary of Participants Response to Demographic Questionnaire ... 135
Appendix 5 : Analysis of Manoeuvres at First Day ... 136
Page XIV
Glossary of Terms and Abbreviations
ABS Anti-lock Braking System
ADAM The German Advanced Driver Attention Metrics Program
ADAS Advanced Driver Assistance Systems
AHS Automated Highway Systems
ANOVA Analysis of Variance
CAMP The Consortium of the Collision Avoidance Metrics Partnership CARRS-Q Centre for Accident Research and Road Safety - Queensland
CDS Crashworthiness Data System
COSMODRIVE Cognitive Simulation Model of the Driver
CRC Correct Response Count
DALI Driving Activity Load Index
DWM Driver Workload Metrics
EID Ecological Interface Design
GNP Gross National Product
HASTE Human Machine Interface and the Safety of Traffic in Europe
HMI Human Machine Interface
ISO International Standards Organization
IVIS In-Vehicle Information Systems
MRC Missed Response Count
MRT Multiple Resource Model Theory
NASA-TLX NASA Task Load Index
NHTSA National Highway Traffic Safety Administration
OECD The Organisation for Economic Co-Operation and Development
OED Objects and Events Detection
OP Observed Power
PASW Predictive Analytics Software
PDA Personal Digital Assistant
PDT Peripheral Detection Task
QUT Queensland University of Technology
RBT Random Breath Testing
Rtmaps Real Time Multisensor Advanced Prototyping Software
SA Situational Awareness
SD Standard Deviation
SPSS Statistical Package for the Social Sciences
SWOV Institute for Road Safety Research, the Netherlands
TNO The Netherlands Organisation for Applied Scientific Research
WHO World Health Organization
Page XV “The work contained in this thesis has not been previously submitted to meet requirements for an award at this or any other higher education institution. To the best of my knowledge and belief, the thesis contains no material previously published or written by another person except where due reference is made.”
Signature
Date 14 November 2012 QUT Verified Signature
Page XVI
Acknowledgement
It is a pleasure to thank those who made this thesis possible. First, I would like to sincerely thank my principal supervisor, Dr. Mark King, for his great support in my research. I am also grateful to my associate supervisor, Professor Andry Rakotonirainy, for his support during the last two years.
I greatly thank Andrew Haines for his help in the preparation stage in the simulator lab. I also received an invaluable amount of his time during data collection in the advanced driver simulator room. I owe my deepest gratitude to Dale Steinhardt for his help in the data management stage and extracting data using the R statistical package. I would also like to acknowledge Dr Husnain Malik’s efforts in core programming of communication system using C++.
I also would like to thank Luke Daly, Angela Watson, and Dr Grégoire Larue for their assistance and advice for my study.
My special thanks go to all research participants in both pilot tests and actual driving tests for their time and research support.
I received constructive suggestions from my panel members, Professor Barry Watson, Director of the Centre for Accident Research and Road Safety - Queensland (CARRS-Q) and Ms Genevieve Graves, Manager of Sustainable Transport at RACQ. I sincerely appreciate their time and consideration.
Thank you to QUT and CARRS-Q for their financial support and the scholarships they offered in my masters degree.
I am indebted to all CARRS-Q staff and students for establishing a friendly and supportive environment. In particular, I would like to thank Mrs Kate Redford and Dr Judy Fleiter for their attention and kindness.
Page 1
Page 2
1-1- Introduction
In this chapter an overview of road safety as both a global issue and in Australia is given. More specifically driver distraction is defined, and the road safety issues associated with it are discussed. Chapter 1 provides an introduction to the literature review and signposts the broad context of the thesis.
1-2- Road Safety Overview Worldwide
“Although road traffic collisions kill more than 1.2 million people a year around the world, they are largely neglected as a health issue” (World Health Organization, 2004). This sentence, which was declared by the World Health Organization (WHO) on Global Road Safety Day in 2004, shows that the world will face widening road safety issues if no major actions and innovations in road safety world-wide are considered in the near future.
In plain words, approximately 3000 people lose their lives in road-related crashes around the globe every day, which is comparable to seven 747 jumbo jets with full passenger complements going down (Australian Transport Safety Bureau, 2004). In addition, road crashes constitute a major proportion of the injuries category, around 25% of all deaths around the globe (Peden et al., 2004). One study has projected that by 2020, driving-related fatalities will grow by 66% worldwide, decreasing by 28% in developed countries, but rocketing in countries such as China (by 92%) and India (by 147%) (Boyle & Lee, 2010).
Additionally, it is estimated that annual cost of road crashes account for approximately 1 to 3% of Gross National Product (GNP) for each country. Developing countries currently lose $100 billion every year, which is approximately twice the total development assistance they receive worldwide (World Bank, 2002). The Australian Transport Safety Bureau (2004) estimated that the global cost of road crashes was about US$518 billion in 1997. Therefore, road safety is a major concern. In particular, the nature of road safety issues is changing because of higher speed vehicles and the development of new in-vehicle entertainment technologies.
1-3- Road Safety Status in Australia
In developed countries such as Australia, the number of road crash fatalities appeared to have reached a plateau. From 1997 until the present, the average annual number of fatalities in Australia has remained approximately 1600 to 1700 (Australian Transport Safety Bureau, 2007). However, the fact that only 30% of global fatalities occur in developed countries shows that the countermeasures that have been implemented were effective in these countries. It remains a challenging task to decrease the fatality rate considerably. Drink driving and speeding are the major contributing factors to most road crash fatalities in Australia (Leung & Starmer, 2005).
Page 3 However, it seems that other factors require more consideration. For instance, Regan (2007) believes that there is still little understanding about the cause of distraction in Australia.
According to the Australian Transport Safety Bureau data, Australia was the eleventh country amongst OECD nations in terms of having fewest road crash deaths per 100 thousand people (8.9) in 2001 (Australian Transport Safety Bureau, 2004). In 2005, the rate was even lower with 8.0 road crash deaths per 100 thousand people (Australian Transport Safety Bureau, 2007). However, on average, five people are killed every day in road crashes in the country (Australian Transport Safety Bureau, 2004).
In Australia, it was estimated that the cost of road crashes was $17.85 billion in 2006. This represented 1.7% of Australian GDP (Department of Infrastructure Transport Regional Development and Local Government, 2009) and is a considerable amount of money, which could potentially be reduced with appropriate road safety countermeasures.
1-4- What is Driver Distraction?
Around the year 1915, it was believed that vehicles’ windscreen wipers could potentially distract or hypnotise drivers (Karlsson, 2005), while nowadays, listening to music, changing CDs, or even using a navigation system in-vehicle, are considered as everyday driving activities. However, potential danger of these tasks is still being debated.
Attention is necessary in order to achieve complete perception in driving tasks (Castro, 2009). Castro (2009, p.75) stated that distraction is the dysfunctional side of attention, and he noted that “Distraction is attention to irrelevant stimuli or actions, and this implies a definition of what is relevant or irrelevant for a given goal.” In these circumstances, momentary lapses are created by driver distraction. The lapses can affect safe driving in practice (Victorian Automobile Chamber Of Commerce, 2005). Considering this definition, distraction effects seem to be common events for road users. However, not all of them lead to traffic crashes (Castro, 2009). In many self-reported crash reports, drivers explicitly cite that “I was distracted” or “I had my mind elsewhere” (Castro, 2009, p.77). The reasoning behind this answer may be the fact that drivers have often experienced distracting tasks as a common part of everyday driving, but they do not expect themselves to be involved in road crashes. Now the question is what driver distraction is?
Generally, there is no internationally acknowledged definition of driver distraction (Ranney, 2008). The International Standards Organization (ISO) introduced the following basic definition: “Distraction is attention given to a non-driving-related activity, typically to the detriment of driving performance” (Ranney, 2008, p.2). Stutts et al. (2001) differentiated distraction from other types of driver inattention. They defined that distraction is a delay “in the recognition of
Page 4 information needed to safely accomplish the driving task because some event, activity, object, or person within or outside the vehicle compels or induces the driver’s shifting attention away from the driving task” (Ranney, 2008, p.2). It is agreed that a triggering activity is a critical component of the distraction definition (Ranney, 2008). Horberry, Anderson, Regan, Triggs and Brown (2006, p.186) stated that “distraction occurs when a triggering event induces an attentional shift away from [the main driving task]”. However, the Australian Road Safety Board (2006) offered the following widely used definition:
“Driver distraction is the voluntary or involuntary diversion of attention from the primary driving tasks not related to impairment (from alcohol, drugs, fatigue, or a medical condition)” (Ranney, 2008, p.2). The definition clarifies that “the diversion occurs because the driver is performing an additional task (or tasks) and temporarily focusing on an object, event, or person not related to the primary driving tasks” (Ranney, 2008, p.2).
Ranney (2008) stated one of the important positive points about the definition as being involved in a secondary task, which presents a clear boundary between distraction and other types of inattention.
Regan, Hallett and Gordon (2011, p.1780), who believe that all previous definitions are not consistent and their relationships are not clear, propose an alternative definition. They defined driver inattention as “insufficient or no attention to activities critical for safe driving” (p. 1780) and offer Driver Diverted Attention as a synonym of driver distraction. Finally, they defined Driver Diverted Attention as “The diversion of attention away from activities critical for safe driving toward a competing activity, which may result in insufficient or no attention to activities critical for safe driving” (Regan et al., 2011, p.1780).
Distraction has been categorised into four different types: visual, auditory, bio-mechanical (physical) and cognitive distraction (Young, Regan & Hammer, 2003). When the driver does not give enough attention to the road, visual distraction happens. In this case, instead of focusing visual attention on the road, distracted drivers look at another target for a certain period. Similarly, auditory distraction takes place when the driver focuses their attention on auditory stimuli instead of on the road environment. Biomechanical or physical distraction happens when drivers manipulate an object by hand(s) rather than keeping their hands on the steering wheel, and cognitive distraction could be defined as any thoughts that attract the driver’s attention in a way that they are not able to drive safely anymore (Young & Regan, 2007). After defining driver distraction, we must now answer the question, “Is driver distraction a road safety issue?”
Page 5 There is general agreement in the literature that driving tasks require the concurrent implementation of a range of cognitive, physical, sensory and psychomotor activities (Harvey, Stanton, Pickering, McDonald & Zheng, 2011; Young & Regan, 2007). In spite of these complexities, it is common to drive a vehicle while being engaged in various non driving-related tasks, from talking with passengers and listening to music, to even drinking a coffee and reading a map. With the introduction of IT technologies such as navigation systems, eco advising systems, and more advanced entertainment facilities, it is becoming more a point of concern for side effects of these technologies on driving performance (Young & Regan, 2007).
Driving tasks become mostly automated with more driving experience. Therefore, drivers are often capable of allocating their attention between tasks at the same time with little or no impairment of their driving performance. In addition, drivers use an adapting strategy in order to compensate for their decreased attention, and thus to compensate for their impaired driver performance. Despite these points, drivers can be distracted to the extent that they do not allocate sufficient attention to the main task (Young & Regan, 2007). Distraction can also be associated with lapses in controlling a vehicle and result in unintended speed variations or allowing the vehicle to move outside the lane borders (Ranney, 2008) and, therefore, safety of distracted drivers can be compromised. In this sense, when drivers’ cognitive processes in sharing their attention between tasks and their adaptive strategies fail, they are not able to separate adequately their attention between secondary tasks and the main task. As a result, they cannot maintain a satisfactory level of driving performance. In other words, driver distraction can take place due to complexity of the secondary tasks or high demand of the driving task itself (Young & Regan, 2007).
Many previous studies have shown that driver distraction is problematic. A naturalistic study found that about 78% of crashes and 65% of near-crashes involved inattention as a contributing factor (Klauer, Dingus, Neale, Sudweeks & Ramsey, 2006). The percentage figures may seem big if it is not considered that, in the study, inattention included fatigue, general inattention to the road, and distraction or secondary task demand (Regan, Lee & Young, 2009). Regan et al. (Regan et al., 2009) suggest that to distinguish distraction from inattention, it is essential to look into the nature of an activity or state. They suggested that distraction involves an “explicit activity” that attracts the driver’s attention, such as texting or thinking, in comparison with inattention, which involves a “cognitive state” and decreases the driver’s mindfulness to the driving task, such as drowsiness or fatigue (Regan et al., 2009, p.32).
In a ‘100-Car Naturalistic Driving Study’, it was found that distraction was a contributing factor in 23% of crashes and near-crashes (Young & Lenné, 2010). Another study previously
Page 6 showed that between 13% and 50% of all crashes occurred due to driver distraction or inattention (Lee, 2007).
Using the Crashworthiness Data System (CDS) in the US, it has been calculated that over the period from 1995 to 2003, about 10.5% of distracted drivers were involved in crashes severe enough to require at least one of the vehicles to be towed from the scene of the crash (Ranney, 2008). It found that distracted drivers were 50% more prone to be seriously injured or killed in their crashes, compared to attentive drivers. Compared to the crashes of attentive drivers, distracted drivers were more likely to crash during night time or evening hours. They also had less chance of crashes on high-speed, multi-lane roadways, curved parts of road, and at intersections (Ranney, 2008). In an epidemiological study, using 699 Toronto drivers who had a crash and also owned a mobile phone, it was found that the risk of crash while using a mobile phone was four-fold larger than when they were not using a mobile phone (Young & Regan, 2007). The issue may worsen in future. Strayer, Watson and Drews (2011) believe that new sources of driver distraction (e.g., email sending, internet browsing) could potentially be more cognitively distracting than old sources of distracters (e.g., eating, listening to music, talking with a passenger).
To sum up, distraction can increase the risk of crashes as well as the magnitude of crash severity on roads. It is especially important because of the fact that new vehicles are being equipped with different types of technology, which can bring more potentially in-vehicle distracting activities.
1-6- Eco-driving systems and Eco-driving behaviour
About 20% of world greenhouse gas emissions are caused by road transport (Young, Birrell & Stanton, 2011). Twenty five years ago, it was acknowledged that it was necessary to develop an in-vehicle device to give instant and precise fuel consumption information to the driver without actually distracting him/her from the main task or driving (Barkenbus, 2010). To date, such devices have been installed in new vehicles by many car manufacturers to provide drivers with instant feedback on fuel economy performance. They are called “eco-driving” systems or “smart driving” tools. They first came to market on hybrid-electric vehicles and perhaps the best-selling hybrid-electric car is produced by Toyota (Toyota Prius). It attracted a lot of attention for its dashboard centre-prominently-mounted display (Barkenbus, 2010).
Fuel economy information can be sent by three different methods to drivers: an immediate kilometre per litre figure, a 5 minute average kilometre per litre figure, and a trip duration kilometre per litre figure. Some other hybrid-electric vehicles not only offer driver feedback, but also set up driving parameters in the vehicle that can aid in eco-driving. Honda, for instance, is
Page 7 installing a driver-activated ECON mode that adjusts characteristics of performance to the most fuel-efficient condition in its hybrid vehicle (Barkenbus, 2010).
Apart from in-vehicle technology which informs drivers about their smart driving behaviour, previous studies found that just requesting drivers to drive economically can decrease fuel consumption by 10 to 15% (Young et al., 2011). Drivers generally interpret driving economically as going slower (Young et al., 2011). It has also been shown that heavy vehicle drivers reduced their fuel consumption 27% when trained in eco-driving (Caird & Hallihan, 2011). It should be noted that a speed between 60 and 80 km/h is the most fuel efficient speed to overcome both road surface resistance and wind resistance (Young et al., 2011).
In fact, there are also a number of other factors which can affect fuel consumption. It has been shown that “avoiding unnecessary stops, maintaining low deceleration levels, minimising the use of 1st and 2nd gears, increasing the use of 5th gear, and block changing gears where possible” can reduce fuel consumption (Young et al., 2011, p.535). It has also been shown that applying the maximum acceleration rate of a vehicle can increase fuel consumption by up to 60% (Young et al., 2011). Previously, it has been shown that excessive braking and acceleration can raise fuel consumption by up to 39% (Caird & Hallihan, 2011).
Young et al. (2011, p.535) reviewed observations in previous studies and provided the following guidelines for a “green driving” style:
Plan ahead to avoid stopping
Use moderate engine speeds and a uniform throttle for steady speeds
Change gear up as soon as possible using positive (but not heavy) acceleration Avoid sharp braking
Use engine braking for smooth deceleration.
It should be noted that there is some association between safe driving behaviour and fuel consumption. Speed is a major factor in driving safely, but relatively less critical for fuel consumption. However, acceleration is perhaps important in both safe driving and fuel economy. Nevertheless, the relationship between driving safely and fuel economy is not always positive (Young et al., 2011). For example, keeping a steady speed through trying to avoid braking may compromise safe driving headways. Using the highest possible gear in a trip could possibly have a negative effect on vehicle control. Interestingly, however, Haworth and Symmons (2002) reported an approximate 35% decrease in crash rates and 11% decrease in fuel reduction when drivers were trained in eco-driving.
The purpose of this research was therefore to investigate how in-vehicle tasks analogous to some of these new technologies might contribute to driver distraction.
Page 8 The thesis includes five chapters. After a brief introduction in Chapter 1, in Chapter 2, a literature review will be presented. In Chapter 3, the methodology and research deign will be explained in detail. All data analysis and results are presented in Chapter 4. The last chapter, Chapter 5, presents the discussion and conclusions.
Page 9
Page 10
2-1- Introduction
One of the causes of driver distraction is in-vehicle driver assistant systems (Horberry et al., 2006; Lee, Forlizzi & Hudson, 2008; Lee, 2007). In most developed countries, advanced in-vehicle systems have become as prevalent as ABS or seatbelts. Car manufacturing companies have focused more on in-vehicle driver assistance systems (Castro, 2009) and promoted them as a privilege through the media. However, there is little understanding of the side effects of most new technologies on safe driver performance. In addition, little research has been conducted on distraction or inattention caused by various in-vehicle technologies (Lee et al., 2008; Lee, Caven, Haake & Brown, 2001).
Leung and Starmer (2005) explained that for over twenty years the Australian government has introduced numerous strategies to lower road fatalities, such as reducing speeds in suburbs, introducing provisional licences, adopting speed cameras and Random Breath Testing (RBT), and designing education material for speeding and drink-driving. However, some major contributing factors to crashes, like distraction, are still in the research stages. One interesting study (n=70) showed that distractions are “a common component of everyday driving” and in total, drivers spent 14.5% of the total time while driving, excluding conversation with other passengers in-vehicle, on distracting activities (Stutts et al., 2005, p.1100). Although many aspects of distraction have been revealed in the last decade, more projects should be conducted to address the problem of distraction. Moreover, over the past two decades, various devices have been introduced to the market to assist and entertain drivers. It has been estimated that navigation systems, touch-screen displays and Bluetooth interfaces will be provided as standard or optional equipment for, respectively, more than 80%, 55%, and nearly 70% of 2008 model vehicles (Castro, 2009). These devices have the ability to distract drivers. Much research has been devoted to characterising the potential causes of distraction and determining how new in-vehicle systems may distract drivers.
In general, three sources of distraction are defined: visual distraction, where the eyes are taken off the road to attend to an in-vehicle system: manual distraction, where the hands are taken off the wheel to use a device; and cognitive distraction, where drivers’ attention is taken away from information processing (Strayer et al., 2011). Because of the complexity of the driving task, various concurrent cognitive, physical, sensory, and psychomotor skills are required (Young & Regan, 2007). Many in- and out-vehicle features may endanger the attention needed by a driver and increase the risk of crashes. Examples of in-vehicle sources of distraction include eating, drinking, talking to other people, and changing CD volume. Out-of-car distraction activities, such as advertising billboards or talking to someone outside the car, are also common. Young drivers in particular are more vulnerable to distraction by infotainment systems (Lee, 2007).
Page 11 In the real world, vehicle control degradation and missing object/event detection are signs of a withdrawal of attention. The mechanism of inattention is eye glances away from the road scene in the case of visual inattention. In distraction, the selective withdrawal of attention and driver’s vehicle control, such as speed maintenance and lane keeping, remain greatly unaffected. However, distraction causes degradation in object and event detection. Moreover, distraction caused by biomechanical interference may degrade vehicle control (Tijerina, 2000). In general terms, distraction deterioration affects drivers’ ability to recognise information at a perceptual level (Karlsson, 2005).
In this chapter, the main focus is presentation of a literature review on topics that are relevant to the study. Therefore after reviewing in-vehicle driver distraction, studies related to distractions from CD changing, navigation system usage and eco-driving system usage will be discussed. Secondary aims of the study are to investigate the practice effect and the effect of different kinds of manoeuvres on driver distraction. These two topics are also considered in the literature review. As an exploratory analysis, it is intended to look at individual differences (age and gender). A section has been assigned in the literature review on this topic. In addition two cognitive and behavioural models are discussed in terms of their contribution to a better understanding of driver distraction in the study.
2-2- In-vehicle Distraction
The importance of in-vehicle distraction has previously been investigated. In a study, an analysis on a database of police fatal accident reports in England and Wales showed that in-vehicle distraction, with the involvement of mobile telephones and entertainment systems, was a contributory factor in 2% of fatal crashes over the period 1985–1995 (Stevens & Minton, 2001). In a US study, it was estimated that eradicating mobile phone use while driving could decrease crash occurrence by 6%. In other words, 330,000 injuries, 12,000 critical injuries, and 2,600 road crash fatalities would be prevented if nobody used mobile phone in the US while the vehicle was in motion (Cohen & Graham, 2003).
The question is, what is happening in distracted drivers that may lead to crashes? In case of using a mobile phone, Strayer, Watson and Drews (2011) believe that using a mobile phone while driving brings inattention blindness, which is the cause of driver failure to perceive information in his/her sight line, whereas conversation with passengers does not. However, the level of attentional demand at which a driver may fail to perceive information is not discussed.
Interactions with in-vehicle devices divert the eyes of drivers away from the roadway and in consequence degrade scanning behaviour. Drivers generally like to concentrate on the road and
Page 12 do not look away for a long time, but in-vehicle devices can increase in-vehicle glance durations and frequency. More time is spent looking at in-vehicle systems so that drivers are at more risk of missing critical events or information (Castro, 2009). The extent of looking away depends on the traffic circumstances, and drivers in situations of increased complexity spend more time and have greater frequency of glances in the vehicle. National Highway Traffic Safety Administration (NHTSA, 2006) considered distraction times of two seconds unacceptable (Castro, 2009). The Alliance of Automobile Manufacturers has included the criteria “that visual-manual tasks performed while the vehicle is in motion should require no more than 20s total glance time and that single-glance durations should not exceed 2s” (Regan et al., 2009, p.101). In-vehicle tasks are considered safe if drivers comply with these criteria while driving (Regan et al., 2009).
Another important aspect of distraction studies is the location of the in-vehicle system, relative to not only the road and the driver, but also the type and layout of its controls. The visual angle from the road and location of the in-vehicle system in the simulator should match the placement of them in real vehicles “because its distance from the forward view directly contributes to the degree of distraction it imposes on drivers” (Regan et al., 2009, p.90). The location of in-vehicle systems in simulators relative to real vehicle on the road needs to be considered in simulator studies. Regan et al. (2009, p.90) believe that ”Discrepancies in the location and design of the in-vehicle system between simulated and real vehicles may lead drivers to interact with the system differently in the simulator and, thus, lead to driving performance being differentially affected across the simulated and real-world environments”.
Many studies have shown that, regardless of the type of technology, some level of driver distraction is created by the use of in-vehicle technologies. Mobile phone distraction studies have received most attention among all new in-vehicle technologies (Horrey & Wickens, 2006; McCartt, Hellinga & Bratiman, 2006). This might be because it is believed that it is the most widespread source of driver distraction that is also likely to lead to road fatalities. In an Australian study, “30% of people surveyed had used text messaging while driving and that 16% regularly used text messaging while driving” (Lee, 2007, p.203). In an internet survey study among 287 Victorian drivers, Young and Lenné (2010) found almost 60% of drivers used mobile phones while driving. A high percentage of them used audio entertainment systems, but only a few used visual displays such as DVD players. Young drivers (18-25) were more likely to be engaged in activities like using mobile phones, CD players, eating or drinking than their middle-aged and older counterparts. However, it is not clear from this study whether their reported results are based on the drivers’ travelled mileage or their number of trips. Furthermore, the types of roads, speeds at which they engaged in in-vehicle activities, traffic conditions and road environment when they engaged in distracting activities are not reported. In a driving simulator
Page 13 study, Horberry et al. (2006) studied two in-vehicle distraction tasks: operating the entertainment system and using a simulated hands-free mobile phone. They found that entertainment systems had the strongest effect on drivers’ distraction in three different age groups and environmental complexities. Lee et al. (2001) studied the effect of speech based email on driver attention to the roadway. Their results showed a 30% increase in reaction time with a speech based system. They concluded that a “speech based interface is not a panacea that eliminates the potential distraction from in-vehicle computers” (2001, p.631). In addition, there are endeavours to eliminate or at least decrease distraction by in-vehicle technologies. For instance, one study showed that applying contextually optimised navigation information can reduce a driver‘s perceptual load significantly (Lee et al., 2008).
Currently, eco-driving systems have been growing rapidly in popularity. These systems send messages to drivers so that driving performance can be improved in terms of fuel efficiency. Due to demand for decreasing fuel consumption and environmentally friendly transport, eco-driving systems are becoming common in the market. However, there remain unanswered questions as how eco-driving systems may influence driving behaviour; and whether they might distract drivers, particularly during potentially dangerous manoeuvres like overtaking.
After this overview of in-vehicle driver distraction, the next section reviews previous driver distraction studies on navigation systems, CD players and eco-driving systems.
2-3- In-vehicle Navigation Systems
In-vehicle navigation systems are intended to guide drivers to a specified destination. Drivers enter an address and the technology provides a path from the vehicle’s current location to the destination. The systems are helpful for drivers in unfamiliar places. However, in several ways, they could potentially distract drivers: physical distraction associated with manual destination entry; the visual distraction once looking at the display; the vocal distraction while listening to turn-by-turn instructions; and also the cognitive distraction once the driver thinks about the received information (Ranney, 2008). Distraction caused by these systems has attracted more attention in recent years.
It is estimated that more than 60% of good vehicles and over 20% of passenger vehicles are equipped with navigation systems in the Netherlands ("SWOV Fact sheet; Safety effects of navigation systems," 2010). In a study by the Netherlands Organisation for Applied Scientific Research (TNO, 2007), analysis on data of 1,144 drivers showed that 28% of drivers owned a navigation system. Over 35% of the drivers applied it on 20% of their trips and more than 15% applied it on 80% of their trips. The navigation system was primarily applied for unfamiliar
Page 14 destinations. The drivers who owned a navigation system were found to drive more per year than the drivers without such a navigation system. More specifically, 60% of navigation owners drive more than 20 thousand kilometre per year, while only 40% of non-owners drive more than 20 thousand kilometre per annum ("SWOV Fact sheet; Safety effects of navigation systems," 2010). In another study, destination entry in the visual/manual systems showed a higher possible distraction than the voice activated system. There was evidence of “longer completion times, more frequent glances at the device, longer eyes-off-road times, and a greater number of lane exceedances” (Ranney, 2008, p.16). The author stated that voice recognition technology in destination entry tasks could be less distracting than entering addresses manually (Ranney, 2008). A survey of 130 navigation system users found that just 10% of respondents utilise voice input to enter destination information and 25% frequently enter destination addresses manually while driving (Young et al., 2003). Of great concern, entering destination information in navigation systems is a time consuming task and is a very distracting activity for the driver. It may take up to nine minutes to enter a destination address. It should be added that it depends on the type of navigation system and the method of entering the information into it (Young et al., 2003). An outline of studies that have addressed the issue follows.
In one study, Tijerina, Parmer and Goodman (1998) investigated the effects of different methods of entering destination address in four different navigation systems: three visual-manual destination entry and one voice input and output entry method in a 12 km test truck study. Sixteen participants with equal number of males and females in two groups of younger (35 years or younger) and older (55 years or older) drivers were recruited to drive an instrumented vehicle. Mean glance time, number of lane exceedances, and time taken to enter destination information, were collected for each of the navigation systems. The authors reported that all three visual-manual systems were associated with longer times of entering destination information, longer eyes-off-road duration, more number of glances at the device, and a greater frequency of lane exceedances in comparison with the voice activated system. The result also revealed that drivers younger than 35 years old took on average over one minute to complete the task manually, while the older took twice the time to finish the same task. In conclusion, it was found that voice-recognition navigation systems are safer than the visual-manual systems in information entry task while driving. However, they did not report other aspects of driving performance, such as steering control, lane keeping, and speed.
One of the most prominent studies on distraction caused by navigation systems, is the camera car study conducted by the NHTSA (Dingus, McGeehee, Hulse, Jahns, & Manakkal, 1995). In the study, four different navigation systems were considered: turn-by-turn guidance screens, with voice guidance and without voice guidance, and an electronic route map with voice guidance, and
Page 15 without voice guidance (Young & Regan, 2007). In addition, two distracting conditions were examined, which directions were written on paper, and a paper map. Thirty participants drove an instrumented “camera car” while applying all of the navigation systems one by one. The electronic map without voice guidance and the paper map caused the greatest degradations in performance of drivers (Young & Regan, 2007). Engaging in electronic route map activities without voice guidance produced high visual attention demand. Thus, drivers spent longer time to retrieve information, and had more braking errors and lane deviations in comparison with other navigation systems. Conventional map usage also showed a need for a high level of cognitive attention, due to the high number of abrupt braking manoeuvres and high self-reported workload ratings. The best performance was for the turn-by-turn navigation screen with voice guidance. Therefore, it is believed that navigation systems that provide turn-by-turn instructions are less distractive and are the most useable means of navigation (Young & Regan, 2007). However, the study was conducted in 1995, and advances in the technology have possibly created more distracting navigation systems both visually and cognitively, due to higher quality screens and an increase in amount of information delivered to drivers.
Similarly, using a high fidelity driving simulator, Srinivasan and Jovanis (1997) examined driving performance while interacting with complex navigation systems. The study was designed to determine whether voice guidance or a turn-by-turn display make the usability of navigation systems better. Eight participants drove in a simulator while interacting with four types of navigation systems (Young & Regan, 2007): a map display, map and visual turn-by-turn displays, map and voice guidance, and a paper map. It was found that the vocal guidance system was the best in terms of driving performance degradation, with the fewest navigational errors, lowest workload, and fastest speeds. The author interpreted this to mean that due to instructing drivers to keep to the posted speed limit, slower speeds resulted in drivers facing greater distraction. The results also showed that drivers drove slower and had most navigational errors using the paper map, and thus they faced the highest workload (Ranney, 2008). However, the voice guidance feature could add another layer of distraction to drivers, especially in a complex environment.
According to a survey in the Netherlands, 85% of drivers use both audio and visual navigation facilities, 12% use only the display form of direction, and only 3% prefer voice instructions alone. As mentioned previously, visual distracters weaken the driver’s attention more than the audio distracters ("SWOV Fact sheet; Safety effects of navigation systems," 2010).
Summing up, an in-vehicle device can potentially distract drivers to a degree which is influenced by the design of the device. Furthermore, applying visual-manual means of entering destination information into navigation systems shows a more deleterious effect on driving performance than voice input technology. Similarly, navigation systems that give instructions via