Proceedings of the 2005 American Society for Engineering Education Annual Conference & Exposition Copyright ©2005, American Society for Engineering Education
E-learning Environmental Design of a Distributed Online
Laboratory for Optical Circuits Courses
Edward McKenna*, Randal Direen*, Frank Barnes*, Deniz Gurkan, Alan Mickelson*, and Driss Benhaddou
University of Houston/*University of Colorado
I. Introduction
E-learning offers students access to tools and course materials over the internet. By distributing tools and materials in this fashion, students isolated from the university environment can still work toward University degrees in most fields offered. Courses that include a laboratory component have traditionally required students to be on-site. This is primarily due to the need for laboratory resources to be in a centralized location for both practical and safety reasons. This fact has hampered the freedom of non traditional (off campus) students to achieve their educational goals. The web adaptations of software packages such as LabView allow control of experiments over the internet. Remote laboratories then become possible.
Online education has been gaining momentum for many years, in great degree due to the industrial need for training [1]. Broadband access, which provides high bandwidth access to the Internet, is beginning to have an effect on the content of such materials [2], [3]. There seems to be consensus that video streaming is preferable to simply static placement of material on a website. The efficacy of live streaming (large scale teleconferencing) versus asynchronously accessible streamed video on learning seems to be an open question. Although evidence presented in [2] is anecdotal, there are arguments for posting streaming pre–recorded video whose playback can be controlled by the viewing learner. There is added content in live streamed video with real time feedback when compared with a stored video presentation, even when the stored version has a playback control. But it is not hard to imagine that highly motivated students may respond more positively to controllably streamed materials available at their convenience than to a teleconference which must take place at a fixed time.
The National Instruments website [4] mentions one remote laboratory effort among three Labview related classroom efforts that National Instruments deems noteworthy. The laboratory was an optics related one demonstrated at Stanford for the first time in 1998 [5]. There seem to be no peer reviewed publications related to this demonstration, and, although there was a company involved in commercializing the materials, the website of the company contains no further information on the distance learning materials beyond that in the National Instruments brochure and the internal Stanford document. A group of researchers from Norway and the United States published results of a joint effort to implement electrical
Proceedings of the 2005 American Society for Engineering Education Annual Conference & Exposition Copyright ©2005, American Society for Engineering Education
circuits experiments in 1999 [6-8]. Several other researchers have published related work in other universities [9-16]. Of these efforts, the only one related in any way to optics does not appear in peer reviewed publications [5], but it appears from the unpublished advertisements that the subject material there does not relate to optical circuits either. Although the technology necessary to put an optical circuits laboratory online does seem to be available, there seems to be no model for the presentation of online material, per se.
This paper presents implementations and preliminary results of a joint effort between the University of Houston and the University of Colorado towards the development of an online laboratory for optical circuits courses. Presently, the theoretical course (ECEN 4006: Fiber Optic Communications) and a laboratory course are taught at the University of Colorado while in the future both laboratory and the theoretical courses will be given at both universities within the e-learning environment. This distributed teaching environment will allow different institutions to share expertise and expensive equipment.
II. Remote Laboratories
During the Fall 2004 term, three remote laboratory experiments were developed for ECEN 4006 Fiber Optic Communications. The material accompanying the experiments consists of three components: simulations, video prelabs and interactive remotely controlled experiments. The simulations allow students to perform experiments by varying parameters of a model and observing an output of that model. There is no actual lab bench equipment controlled by the student over the internet other than the PC that hosts the software used to implement the model. Video prelabs are simply a movie that clearly illustrates each of the procedures performed in an actual lab. The students never touch the lab equipment, but can observe how an experiment will be performed and are given data via the actual students performing the lab in the video. The video is distributed to the students via a host server that is accessible over the internet with an appropriate password. The interactive remote controlled laboratories involve the real time control of equipment on an actual lab bench. Feedback is offered via a video feed to the student over the internet along with virtual instruments that contain the actual data being recorded by the instruments on the actual lab bench.
III. Simulations
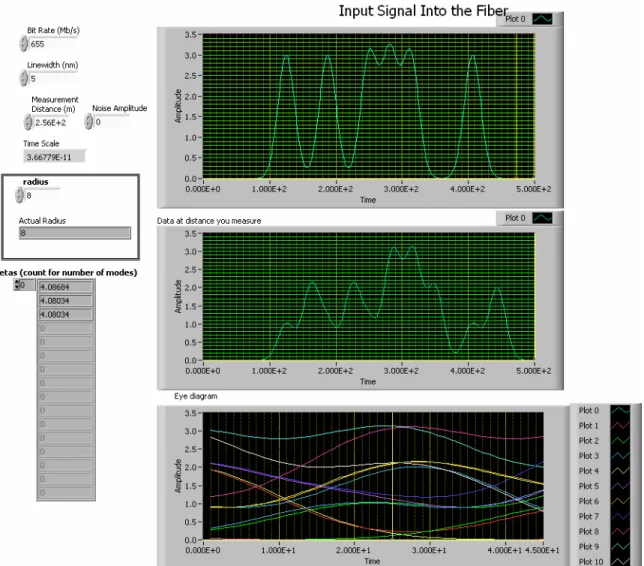
Optical fiber dispersion and receiver noise figure are two important concepts in fiber optic communication system design. A simulation tool was developed in order to give students the ability to experiment first hand with various fiber and laser parameters as well as receiver signal to noise ratios and the effect each of these parameters has for various bit rates. The front panel of the virtual instrument contains inputs that allow the user to change the following link parameters: bit rate, laser linewidth, fiber core and cladding dimensions and indices, receiver noise level and amplification. The output of the simulation is an eye-diagram and bit error rate (BER) (Figure 1). The eye diagram is a display method to show bit extinction level quality in digital communication systems. The oscilloscope displays the bits on top of each other in order to form an eye-shaped diagram. When enough number of bits is displayed in an overlapped fashion, for a 2-bit display screen, the user can see 1 transition, 1 eye opening, another transition, and another eye opening from left to right. These correspond to the possible bit patterns displayed on top of each other: "11", "10", "01", and "00". In the penalty free system with minimal error rate, the eyes should be open: the transitions from "0"
Proceedings of the 2005 American Society for Engineering Education Annual Conference & Exposition Copyright ©2005, American Society for Engineering Education
to "1" and "1" to "0" are sharp. In addition, the power level of "1" bits with respect to "0" bits should be high in order to have a good eye opening.
The simulation is distributed to students using LabView’s webserver application software. This software uses the host pc as a server and students can access the software over the internet. Control of the simulation tool can only be established with the use of the LabView 7.0 Active X runtime engine. This is downloaded free off of the National Instruments website.
Figure 1: Fiber communication link front panel from the LabView 7.0 program illustrating the distorted eye diagram at the bottom at the receiver and the actual waveform received is above that. The top readout illustrates the signal launched into the fiber.
IV. Video
The remote video developed for the course is based on a fiber characterization experiment from a Newport optics laboratory kit used in the optional laboratory course offered to the onsite students. The laboratory video was one hour long and includes the complete laboratory procedure performed by two students. Included with the video is a complete narration of the experiment with illustrations imbedded in the video to aid in the explanation of the material.
Proceedings of the 2005 American Society for Engineering Education Annual Conference & Exposition Copyright ©2005, American Society for Engineering Education
The video was recorded using a standard digital video camera. The recording was then transferred to a PC using Pinnacle Studio Dazzle Fusion video unit that converts the s-video signal from the camera into a WMA signal that can be captured using the PC’s USB port. The video was edited with Pinnacle Expressions video editing software and then converted into AVI format. The encoded video will be distributed via a remote video server accessible to students enrolled in the course via a password.
V. Remotely Controlled Experiments
The remotely controlled experiment developed for the ECEN 4006 uses a remotely controlled optical time domain reflectometer (OTDR). The goal of the experiment is to use the OTDR to measure the parameters of a single mode fiber connected to the OTDR. The OTDR is connected to a PC via the general purpose interface bus (GPIB) IEEE 488.2 on the back of the instrument. Remote operation of the instrument is accomplished with a virtual instrument panel written in LabView 7.0 that is accessed by the students over the internet using LabView 7.0 web server application software.
Along with the virtual OTDR instrument panel accessed over the Internet, the students can also view a live video feed from the lab to observe the changes in the actual OTDR display and the green laser active LED located on the instrument front panel as measurements are made. While the changes in the virtual instrument panel display are the same as those on the actual OTDR, the laser active LED isn’t present on the virtual instrument panel. Observing the changes in the real instrument panel give the user assurance that changes in the measurement parameters on the virtual instrument panel correspond to changes on the actual instrument. In addition, the live video can provides a view of all the set up as some of the equipment are not controlled by students. This will give students confident about their measurement as well as have an idea of the physical set up of the experiment.
The video feed is generated using an RCA VHS camcorder video feed that is connected to a Pinnacle Studio Dazzle Fusion video unit that converts the s-video signal from the camera into a WMA signal that can be captured using the PC’s USB port. The video is then sent for distribution over the internet to the University of Colorado’s video server, Kubrick, using Real Player’s Helix software. While there is no real advantage to the use of video in observing the instrument behavior during control, it offers numerous advantages when controlling more complicated experiments using remotely controlled positioners on an optics bench. Inclusion of this feature into the OTDR experiment ensured the software compatibility of the Helix software and the LabView 7.0 webserver software so that they could be used together in the future.
Proceedings of the 2005 American Society for Engineering Education Annual Conference & Exposition Copyright ©2005, American Society for Engineering Education
Figure 2: OTDR virtual instrument front panel with readings illustrating the measurement of a break after a short piece of single mode fiber.
VI Student Instructor Interaction
The technological advances with the test and measurement equipments allowed the manufacturing facilities at various production lines to have a remote monitoring and control over the processes. This e-learning project is in a way similar to the case where a factory may be isolated from human control over the production. In this respect, we would like to minimize the student-instructor interaction in order to have a close-to-real-life experience to our students for their future careers. However, educational goals will not be achieved without the proper learning environment. Therefore, we included a camera monitoring for both the instructor-student interaction and the lab test and measurement control environment. We will include an objective committee from industry professionals to assess the learning outcomes of this lab structure during our pilot labs.
VII. Student Performance Metrics and Assessment
The students will have full control over the test and measurement equipment. These controls will allow them to measure and take note of the results of their measurements as well as their observations on the experiment. Since there is an electronic environment with printing and data processing capabilities, there will be real-time processing opportunities. All data processing and measurements will be required in the student reports. These reports can be submitted electronically. Report grading and online timed exams and quizzes will be implemented to assess student progress and understanding of the subject material.
Assessment of distance learning courses is a challenging task. It is hard for the professor to get a feel of who is following the experiment correctly and who is not. In addition to laboratory report grading and exams a direct comparison of the remote students and the on-site student may be implemented. This will require remote and on-on-site students to take a common exam that include theoretical as well as experimental work related to the experiment.
Proceedings of the 2005 American Society for Engineering Education Annual Conference & Exposition Copyright ©2005, American Society for Engineering Education
Statistical analysis can be drawn from the results to assess the learning experience of remote student and compare them to on-site students. Development of assessment tools that provide a reliable feedback about student learning capabilities is important to distance learning and is a relevant line of research.
VIII. Future Optical E-Learning Laboratory Implementation
The electronic environment will enable a variety of experiments to be implemented. Updates of these experiments will be easily developed over the core experiments with records of older experiments available for future classes. This is an ongoing effort; we will provide more experiments with student assessment feedback and analysis. Laboratory distance education opens new challenges such as student instructor interaction and development of assessment strategies that provide reliable feedback about student learning capabilities.
References
[1] P. Hernandez-Ramos, D. Alexander, A. Belous and J. Behrens, Changing the way we learn: How Cisco Systems is doing it, International Workshop on Advanced Learning Technologies 2000, 177-179 (2000).
[2] S. Kariya, Online education expands and evolves, IEEE Spectrum May 2003, 49-51 (2003).
[3] E. Maga~na, and D. Morat¶o, Internet Technologies course with combined professor and on-line contents methodology, Tenth International Conference on Telecommunications, 1756-1761 (2003).
[4] National Instruments, Distance-learning remote laboratories using LabVIEW, web document of Naitonal Instruments (2002).
[5] L. Hesselink, D. Rizal and E. Bjornson, CyberLab: Remote access to laboratories throughout the world-wide-web, Stanford University document (1999).
[6] H. Shen, Z. Xu, B. Dalager, V. Kristiansen, Â. Str¿m, M. S. Shur, T. A. Fjeldly, J-Q. LÄu, and T. Ytterdal, Conducting laboratory experiments over the internet, IEEE trans. Education 42, 180-185 (1999).
[7] J. O. Strandman, R. Berntzen, T. A. Fjeldly, Y. Ytterdal, and M. S. Shur, LAB on-WEB: Performing device characterization via Internet using modern web technology, Fourth International Conference on Devices, Circuits and Systems, Aruba, April 17-19 (2002) 1022-1--1022-6.
[8] C. Wul®, T. Ytterdal, T. A. S½ther, A. Skjelvan, T. A. Fjeldly, and M. S. Shur, Next generation Laboratory-A solution for remote characterization of analog integrated circuits, Fourth International Conference on Devices, Circuits and Systems, Aruba, April 17-19, (2002), 1024-1--1024-4.
[9] G. Tait and N. Chao, Hands-on remote laboratory for freshman engineering education, ASEE/IEEE Frontiers in Education Conference T3 R-7 Boulder, CO (November 2003).
[10] B. A. Galwas and R. J. Rak, Virtual laboratory- A future part of the new web-based model of undergraduate engineering studies developed by Warsaw University of Technology, Joint IMEKO TC-1 & XXXIV MKM Conference 2002.
[11] D. Z. Deniz, A. Bulancak and G. Ä Ozcan, A novel approach to remote laboratories, ASEE/IEEE Frontiers in Education Conference T3 R-8-T3 R-12, Boulder, CO (November 2003).
[12] A. Ferrero, S. Salicone, C. Bonora and M. Parmagiani, ReMLab: A java-based remote, didactic measurement laboratory, IEEE trans. Instrumentation and Measurement 52, 710-715 (2003).
[13] M. Casini, D. Prattichizzo and A. Vicino, The automatic control telelab: a user-friendly interface for distance learning, IEEE trans. Education 46, 252-257 (2003).
[14] T. Ostermann, C. Lackner, R. Koessel, R. Hagelauer, K. Beer, L. Krahn, H. T. Mammen, W. John, A. Sauer, P. Schwarz, G. Elst and M. Pistauer, LIMA: The new e-learning platform for microelectronics applications, IEEE International Conference on Microelectronics Systems Education (2003).
[15] K. C. Chu, Development of a web-based teaching system for engineering education, Engineering Science and Education Journal, June 1999, 115-118.
[16] T. Kikuchi, S. Fukuda, A. Fukuzaki, K. Nagaoka, K. Tanaka, T. Kenjo, and D. A. Harris, DVTS-based remote laboartoory across the Paci¯c over the Gigabit network, IEEE Trans. Education 47, 26-32 (2004).